-
Paper Information
- Previous Paper
- Paper Submission
-
Journal Information
- About This Journal
- Editorial Board
- Current Issue
- Archive
- Author Guidelines
- Contact Us
American Journal of Environmental Engineering
p-ISSN: 2166-4633 e-ISSN: 2166-465X
2013; 3(2): 107-114
doi:10.5923/j.ajee.20130302.04
Analysis of Remote Surface Temperature of a Coastal Lagoon in Southern Brazil during the Passage of Frontal Systems
 Abstract
 Reference
 Full-Text PDF
 Full-text HTML
Marilei Bender Xavier1, Silvia Beatriz Alves Rolim1, Gervásio Annes Degrazia2, Lilian Piecha Moor2
1Programa de Pós-Graduação em Sensoriamento Remoto, Universidade Federal do Rio Grande do Sul, Porto Alegre, RS, Brazil
2Programa de Pós-Graduação em Física e Meteorologia, Universidade Federal de Santa Maria, Santa Maria, RS, Brazil
Correspondence to: Gervásio Annes Degrazia, Programa de Pós-Graduação em Física e Meteorologia, Universidade Federal de Santa Maria, Santa Maria, RS, Brazil.
| Email: |  |
Copyright © 2012 Scientific & Academic Publishing. All Rights Reserved.
This paper presents a method for estimating surface temperatures using satellite images. Remote observations of the surface temperature of the Mangueira Lagoon, during the occurrence of frontal systems, are analyzed. This study points out that the lagoon surface temperature drops during the passage of frontal systems. The investigation reveals that there is a direct relationship between measured temperature of the lagoon and the wind patterns. When there are intense winds large fluctuations of temperature are observed. In this case, turbulent air flow provides energy to generate turbulence and waves in the surface of the lagoon. These movements are responsible for the temperature fluctuations. In low wind speed conditions, when the turbulence forcing is weak there is not much energy transference from the air to the water. These winds are not strong enough to generate waves and turbulence in the lagoon surface. Consequently, the measured temperature fluctuations are small. It also is relevant to mention that the proposed methodology to measure remote temperature of lagoons is accurate, which allows to establish a connection between surface temperature and wind condition.
Keywords: Temperature, Lagoon, Wind, Image, Satellite
Cite this paper: Marilei Bender Xavier, Silvia Beatriz Alves Rolim, Gervásio Annes Degrazia, Lilian Piecha Moor, Analysis of Remote Surface Temperature of a Coastal Lagoon in Southern Brazil during the Passage of Frontal Systems, American Journal of Environmental Engineering, Vol. 3 No. 2, 2013, pp. 107-114. doi: 10.5923/j.ajee.20130302.04.
Article Outline
1. Introduction
- The measurements of geophysical quantities in natural environments might reveal and predict the effect of environmental impacts in particular ecosystems characterized by a short length geological time scale. Aquatic ecosystems that have small extensions, like lagoons that occur at the interface between ocean and continental regions of land (coastal region), are sensitive to weather changes caused by frontal systems[9],[10]. Such weather changes happen in temperature, wind speed, and other variables. As a result, the effects of climatic changes on these water bodies may be evaluated when considering the average of these parameters over long periods of time. Therefore, it is important to measure the surface temperatures of lagoons and establish their relationships with micrometeorological parameters[8].Despite the importance of conducting observations of meteorological parameters, obtaining local measurements of such quantities in natural lagoons is an extremely difficult task. For instance, collecting data on aquatic environments involves complicated logistics, since meteorological forcing present at the time of collection may make unviable the measurement procedure. Typically, the observations in lagoons are interrupted by sudden changes in the magnitude of the wind. An alternative technique for measuring surface temperatures of coastal lagoons is based on the use of satellite data[19]. These data are obtained from sensors located on satellites that continuously provide detailed measure of the surface temperatures of these particular aquatic ecosystems in different weather situations. Such weather patterns may represent the passage of frontal systems. These transient phenomena destabilize the water column. As a consequence, these weather patterns can be evaluated by analyzing the variations related to the biotic factors and physicochemical properties of the studied ecosystem[17]. In this case, the observations of surface temperatures, mediated in a time scale, can reveal major patterns of climate change. In addition, several biological communities, such as some species of fish and algae are sensitive to temperature variations of lagoons[12]. Thus, the measurement of surface temperature extracted from satellite images is a key variable for understanding phenomena related to environmental study of lagoons. Amicrometeorological parameter that influences fluctuations of the surface temperature of lagoons is the wind. With the passage of a frontal system it is possible to happen both a decrease and an increase in the incident solar radiation and the air temperature and wind velocity. In southern Brazil, in the State of Rio Grande do Sul (RS), specific lagoons are present characterized by a short geological time. Such aquatic systems, highly dependent on environmental changes, are located at the interface between the continent and the ocean. The aim of this study is to apply satellite images to remotely measure the surface temperature of the Mangueira lagoon. These observations are made during the passage of frontal systems in southern Brazil. An additional objective is to verify, using data known from the literature, whether these changes of the surface temperatures of the Mangueira lagoon are significant to influence some biotic environmental elements present in this water body. A complementary purpose of the study is to analyze the magnitude and direction of winds during the passage of fronts and relate these quantities to fluctuations of the surface temperature of the lagoon. For this study, it was used the methodology of product MOD11 of the MODIS sensor and meteorological data measured at the station in Santa Vitoria do Palmar. The Product MOD11 calculates the surface temperature as a function of the spectral radiance measurements and emissivities in bands 31 (10.78 to 11.28 μm) and 32 (11.77 to 12.27 μm) thermal infrared.
2. Description of the Study Area
- The Mangueira lagoon (Figure 1) is an aquatic ecosystem, constituted mainly by a shallow water body, with depths varying between 1.5 and 6 m[3]. It has an elongate shape with 92 km long and having a width ranging between 2 and 10 km. Its area is approximately 820 square kilometers and stretches in the southern coastal area of Brazil, being located between the cities of Santa Vitória do Palmar and Rio Grande. This lagoon is part of the hydrological system of the Natural Reserve of Taim, covering a total area of 2254 Km2. It is surrounded by a variety of habitats, such as beaches, forests, grasslands and wetlands dunes. Currently, the rice production is the main economic activity of the region and the extraction of water from the Mangueira lagoon to the crops has changed its hydrological regime. Lacustrine environments, as the system formed by the Mangueira lagoon are transitory, because they depend on the geological, fluvial, and climate dynamics of the region. In this sense, the complexity and the delicate ecological balance of the environments that shape the landscape surrounding this lagoon are sensitive to anthropogenic activities fostered by farm (rice cultivation).In the coastal region of RS, vegetation and wind are two agents responsible for changes in the hydrodynamics of the lake systems. According to[12] the Mangueira lagoon has different biotic characteristics and distinct physico-chemical properties of water. Such changes are demonstrated by spatial and temporal gradients of different properties. Studies by[12] show that the northern portion of the Mangueira lagoon is characterized by the presence of emerging macrophyte plants and the southern part is characterized by submersed macrophyte plants. In the northern portion of the lagoon, average water transparency is low. In this region, there is an increase in the concentration of total solids that is associated with the entry of nutrients and organic matter originating from the Taim natural reserve. Such material flow generates a higher concentration of chlorophyll in relation to the south, a region with clearer water. Different species of algae present in the Mangueira lagoon have different optimal growth temperatures. These temperatures for most algae vary between 15 and 25°C. Particularly, the Mangueira lagoon is a habitat that has favorable conditions for the maintenance and development of a specie of algae known as Spirulina. Spirulina is an important nutrient in the food chain of the different species present in the Mangueira lagoon. Algae Spirulina tolerate high temperatures, which may be between 30 and 40°C. Considering the winds,[5] shows that the air flows predominant in the Mangueira lagoon are from northeast to southwest (average speed of 8 m/s) along the main axis of the lagoon. The passage of cold fronts is more common in the winter than in the summer. As a result, the prevailing wind regime moves surface water southward in the Mangueira Lagoon[3];[6];[16];[20]. This wind field generates enough energy to occur one resuspension of fine sediments, resulting in a long fetch that can reach 90 km. At the same time, as a consequence of all this trophic chain, fine sediments and associated nutrients are transported to the North through the bottom counter-current, creating in the southern lagoon sandy sediments, high average transparency and low water concentration of chlorophyll-a .
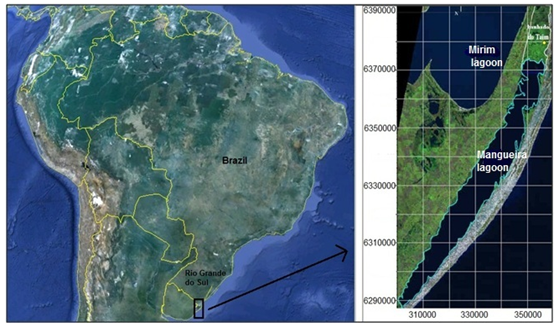 | Figure 1. Study area, Mangueira lagoon, RS, Brazil |
3. Methods and Measurements of Remote Surface Temperature and Wind
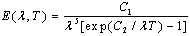
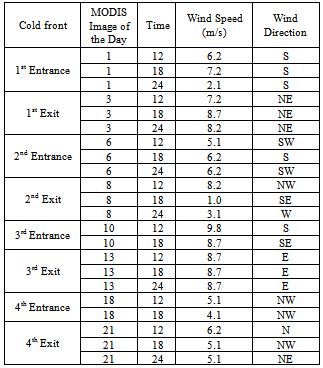
- A large number of scientific papers discuss and analyze the variation of the surface temperature of different targets through data emissivity and remote sensors aboard orbital platforms. Among them, it is highlighted the work of[1]; [2];[7];[13];[18]. Several sensors aboard satellites have data in the thermal infrared region, as the sensor Moderate Resolution Imaging Spectroradiometer (MODIS) of the satellite EOS-TERRA. Amongst the various products that can be obtained from the MODIS sensor, it is possible to highlight the product mod11-(Land Surface Temperature and Emissivity). One of the important applications of the product MOD11 is the validation and improvement of weather forecast models[15]. The orbital data used in this study for the surface temperature in the Mangueira lagoon were obtained from the product MOD11 (Surface temperature and emissivity) of the MODIS sensor. The satellite TERRA was launched in December 1999, collecting data from February 2000, with the passage of time at 10:30 over South America. Images were acquired using the dates of the passages of cold fronts in December 2005[11]. The use of remote sensing to estimate the surface temperature of the Earth employs the Planck function. The emission rate on each wavelength, called emittance or emissivity spectral power[W/m2.μm] of the blackbody is given by:
 | (1) |
 | (2) |
 is the spectral emittance of the actual body at a given wavelength and temperature.
  is the spectral emittance of the blackbody at the same temperature and wavelength of the real body. Observations of surface temperature provided by the MODIS product mod11 (at 1 km resolution) are calculated from the algorithm "generalized split-window",[21], which assumes a priori knowledge of the emissivity. Measurements of emissivity of bands 31 (10.78 to 11.28 μm) and 32 (11.77 to 12.27 μm) are obtained based on a classification in which the image pixel is identified with 14 classes of use of the Earth pre-set and the corresponding values of emissivity. From the knowledge of the emissivity, the algorithm "generalized split-window" performs the atmospheric correction based on the differential absorption between the two thermal bands (31 and 32) MODIS. According to[21] the estimate of the surface temperature by the generalized split-window algorithm of the MODIS sensor is given by:
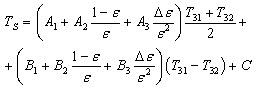 | (3) |
 and
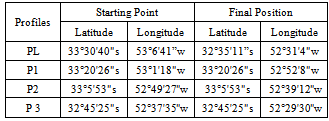
and  are the emissivities of the surface bands 31 and 32 MODIS. C, A1, A2, A3, B1, B2, B3 are the regression coefficients. This estimate is a regression equation that uses the brightness temperature of the thermal infrared channels to calculate the surface temperature. The regression coefficients are derived using a radiative transfer model with atmospheric features obtained from data derived from 12 global atmospheric temperature profiles[21].The original data of the pixel surface temperature of the product MOD11 provided in Kelvin were converted to degrees Celsius by calculating: T °C = (0.02 * Pix) – 273, where T °C is the pixel value in degrees Celsius. For observing the variation of temperature in the Mangueira lagoon, it were plotted three transverse profiles (P1, P2, and P3) and a longitudinal profile (PL) in the images temperature obtained from the MODIS sensor (Figure 2). The longitudinal profile was drawn towards South-North (SN) and transverse profiles, P1, P2, and P3 were drawn toward East-West (EW). The positioning of the profiles on the image of Figure 2 is shown in Table 1.
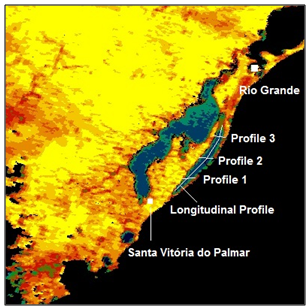 | Figure 2. Image of the MODIS sensor and surface temperature profiles in the Mangueira Lagoon |
|
|
4. Discussion of Results
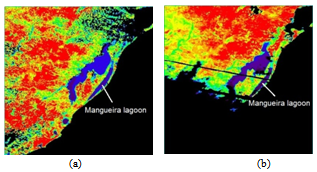
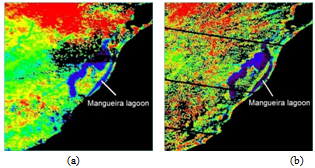
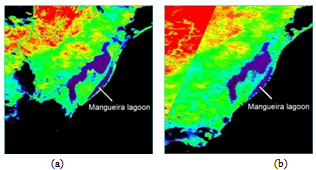
- Figures 3, 4, 5, and 6 show images of the surface of the Mangueira lagoon obtained from MODIS sensor during the passage of frontal systems. In these figures, the arrow shows the location of the Mangueira lagoon. Figures 3a and 3b, 4a and 4b, 5a and 5b, 6a and 6b represent the initial and final passages of frontal systems that reached southern Brazil in December 2005. Analyzing these figures one can observe color differences on the surface of the Mangueira lagoon. This distinctiveness of the colors shows the change in surface temperature of the lagoon caused by the event characterizing the front passage. The darker the tone of blue in the figure, the lower the surface temperature of the Mangueira lagoon. Therefore, interpreting the images shown in Figures one can conclude that the surface temperature of the Mangueira lagoon decreases after the passage of a cold front.
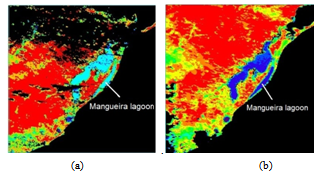 | Figure 3. First frontal system: (a) 12/01/05; (b)12/03/05 |
 | Figure 4. Second Frontal System: (a) 12/06/05; (b) 12/08/05 |
 | Figure 5. Third Front System: (a) 12/10/05; (b) 12/13/05 |
 | Figure 6. Fourth Front Systema: (a) 12/18/05; (b) 12/21/05 |
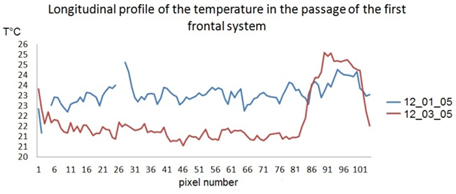 | Figure 7. Longitudinal profile of the first frontal system |
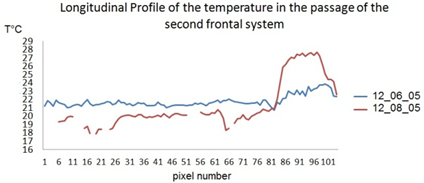 | Figure 8. Longitudinal profile of the second frontal system |
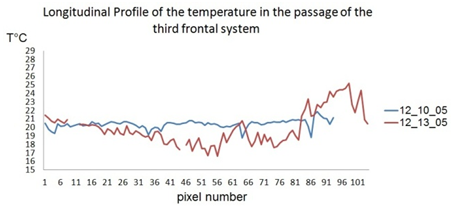 | Figure 9. Longitudinal profile of the third frontal system |
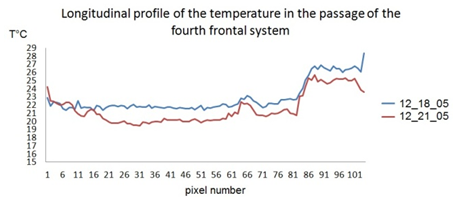 | Figure 10. Longitudinal profile of the fourth frontal system |
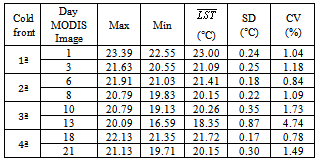
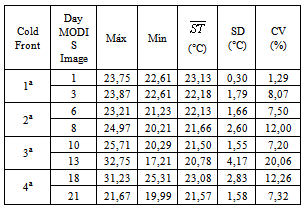
 ), standard deviations (SD) of LST and coefficients of variation (CV) of LST. The magnitudes of the average values of LST, seen in the Table 3, confirm the decrease in greater detail of the temperatures shown in Figures 3a and 3b, 4a and 4b, 5a and 5b, and 6a and 6b. For the central lagoon, an analysis based on specific statistical indices allows knowing the extent of these variations. The standard deviations of surface temperature indicate the magnitude of the fluctuations of this variable in relation to their average values. Therefore, the larger magnitudes of the fluctuations (the highest SD values) occur during passage of the third cold front. These fluctuations have a variation of about 4°C in the surface temperature of the lagoon. This fluctuation is responsible for the high value obtained in CV. The CVs reflect the relative index between SD and
  in terms of percentage. Observed relativity of 4.74% indicates that occurred dispersions (variations) of values of LST around
  in the exit of third cold front. The passages of the first and fourth cold fronts provide, respectively, CV values of approximately 1.18 and 1.49%.
|
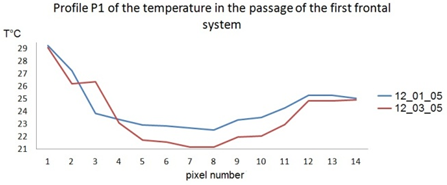 | Figure 11. Profile P1 of the first frontal system |
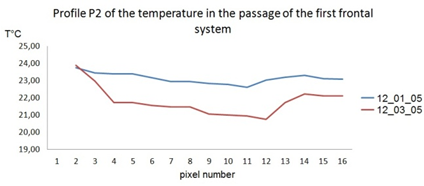 | Figure 12. Profile P2 of the first frontal system |
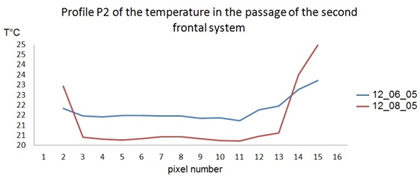 | Figure 13. Profile P2 of the second frontal system |
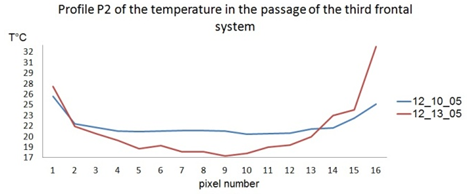 | Figure 14. Profile P2 of the third frontal system |
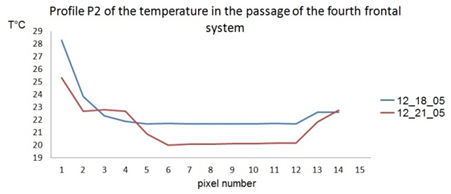 | Figure 15. Profile P2 of the fourth frontal system |
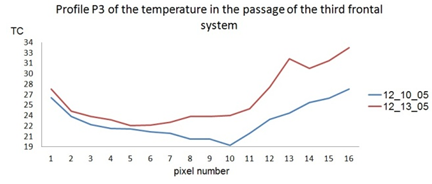 | Figure 16. Profile P3 of the third frontal system |
|
5. Conclusions
- In this study, remote measurements of the surface temperature of the Mangueira lagoon are presented and discussed. The measurements are performed during the passages of frontal systems. The research uses satellite images and wind data at a weather station of surface. The determination of the surface temperatures of coastal lagoons, besides being important for assessing the effects of climatic changes, provides temperature variations that can influence different biological species present in the environment of the lagoon. This analysis shows that in the large part of the lagoon surface, the surface temperature decreases after passage of frontal systems. From a quantitative point of view, in the central region of the lagoon, this decrease in temperature can be up to 4°C, generating an average variation around 2°C along the profile SN. The present analysis shows that there is a relationship between observed surface temperature of the lagoon and the wind velocity (direction and magnitude). The presence of strong winds, with well-defined directions, cause wide fluctuations in measurements of TSL. These robust advections, with magnitudes varying between 7 and 9 m/s are directionally persistent, it means, winds show for hours, preferential consolidated directions. In this case, large temperature fluctuations are caused by atmospheric turbulence. This turbulent flow of air directly above the lagoon, transfers energy to the water surface generating turbulence and waves. Consequently, this turbulence on the surface of the lagoon may be the physical process responsible for causing fluctuations observed in LST. However, when the magnitude of the wind is weak, in short periods of time, its direction has a large variance. This phenomenon is known as the meandering of the horizontal wind. In this case, the low wind velocity (weak advection), do not generate wind turbulence sufficient to generate movements on the water surface of the lagoon. This decoupling of energy between the contour that separates the two fluids (air and water), prevents the generation of waves and turbulence in the lagoon surface. In this case the observed surface temperature fluctuations are reduced. This analysis shows that the method that measures remote surface temperature in lagoons, obtained by MODIS, is a viable and effective tool for establishing relationships between this quantity and wind originated during the passage of frontal systems.
ACKNOWLEDGEMENTS
- This work has been support by Brazilian Research Agencies: Conselho Nacional de Desenvolvimento Científico e Tecnológico (CNPq) and Coordenação de Aperfeiçoamento de Pessoal de Ensino Superior (CAPES).