-
Paper Information
- Next Paper
- Previous Paper
- Paper Submission
-
Journal Information
- About This Journal
- Editorial Board
- Current Issue
- Archive
- Author Guidelines
- Contact Us
American Journal of Environmental Engineering
p-ISSN: 2166-4633 e-ISSN: 2166-465X
2013; 3(1): 24-31
doi:10.5923/j.ajee.20130301.05
The Vertical Structure of Tropical Urban Heat Island with LES
 Abstract
 Reference
 Full-Text PDF
 Full-text HTML
Edson P. Marques Filho 1, Mariana Cassol 2, Hugo A. Karam 1, Umberto Rizza 3
1Department of Meteorology, Federal University of Rio de Janeiro, Rio de Janeiro-RJ, CEP 21941-590, Brazil
2Multidisciplinary Institute, Federal Rural University of Rio de Janeiro, Nova Iguaçu-RJ, CEP 26020-740, Brazil
3Institute of Atmospheric Sciences and Climate, CNR-ISAC, Lecce, 73100, Italy
Correspondence to: Edson P. Marques Filho , Department of Meteorology, Federal University of Rio de Janeiro, Rio de Janeiro-RJ, CEP 21941-590, Brazil.
| Email: |  |
Copyright © 2012 Scientific & Academic Publishing. All Rights Reserved.
The Large-eddy simulation (LES) model is used to investigate the influence of the Tropical Urban Heat Island (UHI) in the vertical structure of the Planetary Boundary Layer (PBL) under adiabatic and non-saturated conditions. An idealized UHI is represented by two-dimensional patches of heat fluxes at the surface defining variable Bowen ratio along the horizontal domain. The results indicated that the heterogeneities are able to induce the formation of intense updraft over the center of warm patch. This buoyant thermal transports the moisture from the lower to the upper part of the PBL and penetrate the entrainment zone. Consequently, the urban-breeze circulation can contribute to the clouds development at the top of the PBL over the UHI.
Keywords: Tropical Urban Heat Island, Large-Eddy Simulation, Heterogeneous Surface
Cite this paper: Edson P. Marques Filho , Mariana Cassol , Hugo A. Karam , Umberto Rizza , The Vertical Structure of Tropical Urban Heat Island with LES, American Journal of Environmental Engineering, Vol. 3 No. 1, 2013, pp. 24-31. doi: 10.5923/j.ajee.20130301.05.
Article Outline
1. Introduction
- The surface-atmosphere interaction processes play an important role in the terrestrial climatic system, due to the Planetary Boundary Layer (PBL) transport of moment, heat and humidity[1]. Particularly, the microclimatic conditions are strongly influenced by the human activities, such as urbanization processes, intensive use of the land surface, deforestation and burn of fossil fuels[2]. These processes contribute to the formation of the Urban Heat Island (UHI)[3]. Factors such as thermal and physical properties of construction materials, geometry, heat sources and decrease of green areas modify the surface energy budget (SEB) components and aerodynamic behavior in the Urban Boundary Layer (UBL)[4]. In response to the urban SEB, the UHI leads to enhanced heating, urban-breeze convergence, stronger vertical motions and increasing of water vapor at the top of the UBL[5-7]. These changes can modify the environmental quality and the inhabitants’ health[8-9].In the last decades, experimental campaigns and modeling efforts have been realized in order to understand the various factors responsible for the UHI development [10-12]. Regarding the modeling, urban SEB has received great attention[13-16]. The main difficulty in coupling the SEB with mesoscale atmospheric models is the fact that there are many parameters which must be defined in order to optimize the numerical simulations ([17],[11]).Many studies were accomplished for mid-latitude cities and only few works have focused in the climate of tropical cities[18-19]. Reference[18] reported UHI differences between the (sub)tropical and the mid-latitude areas, and found that the greater presence of vegetation and water availability has the potential of mitigating UHI intensity during nocturnal periods.Reference[20] showed that the UHI in Mexico City is frequently at night during the driest months, under calm wind and clear conditions. Although less common, the daytime UHI can also happen during the wet season. In the equatorial wet region of Colombo, Sri Lanka,[21] found that the UHI intensity is greater in daytime and that the sea-breeze circulation affects the temperature field in areas open to the sea. Reference[22] verified that the UHI over the Metropolitan Area of Rio de Janeiro (MARJ) has also a diurnal maximum in the morning, for all the seasons. In the afternoon and early evening, the UHI temperature difference is negative. This behavior is attributed to the sea-breeze intensification and thermal capability of vegetation in rural area. The numerical result obtained by[15] with urban and vegetation numerical SEB schemes has supported the observations of the UHI in the MARJ. Reference[23] also indicated that the UHI in the city of São Paulo has a predominant daytime character, with a maximum intensity during afternoon.Despite these great advances in the knowledge of UHI, it is still necessary to realize experimental campaigns to obtain a representative and accurate set of measurements, especially in the tropical cities[18]. However, the high costs and the difficulties associated to the experimental campaigns have motivated a development of numerical schemes, parameterizations and multi-scale models to represent the urban processes[24]. An alternative is the application of the large-eddy simulation (LES) model to obtain details about the turbulent PBL structure[25]. The LES model has been used to investigate the effects of surface heterogeneity in the PBL flows[26-32].In one of the pioneering works approaching heterogeneity with LES,[26] found that the heterogeneity length scale drives the mean circulation intensity. According to[27], the velocity and scalar fields respond differently to variations of heterogeneity scale, and the entrainment rate is not proportional to the total amount of turbulent kinetic energy (TKE). The influence of heterogeneity on potential cloud formation was investigated by[29]. They showed that the relative humidity near the PBL top is larger over the warm patch and can facilitate cloud formation. Reference[30] studied the effects of building representation on the atmospheric flow. Their results suggested that small-scale details of the canopy are also important for the simulation of the flow and pollutant transport at the canopy scale, but do not affect significantly the mean flow and the aerodynamic parameters. The PBL flow and its interactions with wind turbines were studied by[31]. In general, the LES model is capable of simulating average velocity and turbulence intensity distributions of the turbine wakes. Reference[32] investigated the effects of thermal stratification on the urban canyon flow and pollutant dispersion. They found that ground heating generated strong mixing of heat and pollutant in the urban canyon.The main objective of the present work is to investigate the daytime UHI development associated to the surface patch heterogeneity with LES. The influences of this heterogeneity on the turbulent vertical structure of a tropical adiabatic and non-saturated UBL are also studied. This manuscript is organized as follows. In section 2, the LES simulations are briefly discussed, including initial and boundary conditions, and the statistical method of analysis. The results and discussions are presented in section 3. Section 4 summarizes the conclusions.
2. Methodology
2.1. Model Description
- Large-eddy simulation model is a three dimensional model in which the large scale eddies in a turbulent flow are explicitly calculated but motions on a scale smaller than the filter size need to be parameterized[33]. The LES model utilizes the incompressible Boussinesq form of Navier-Stokes equations to predict the wind velocity components
 [34-35]. The thermodynamic energy and scalar conservation equations are integrated by the model to calculate the potential temperature
  and specific humidity
  , respectively. The PBL variables are spatially filtered to define resolved components and subgrid-scale (SGS) components[36]. In the present work a modified version Moeng’s model, including the virtual potential temperature integration
  to represent the buoyancy effects, is used[27]. Heterogeneous surface heat fluxes are also included and prescribed in the model ([26],[37]). The numerical scheme is a pseudospectral method in the horizontal directions and a second-order centered in space finite-difference scheme in the vertical direction. The time derivatives are solved using Adams-Bashforth scheme. The lateral boundary conditions are periodic.
2.2. Experimental Setup and Statistical Method
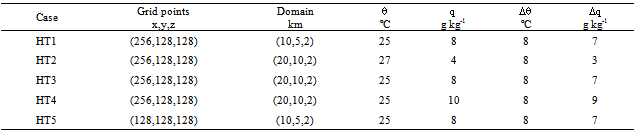
- In Table 1 the initial conditions for LES simulations are presented. For all cases there is no background geostrophic wind
 , therefore the simulations are in the free convection limit. The roughness length
 and the initial PBL height
 were assumed equal to 0.7 m[38] and 850 m, respectively. The initial profiles of the mean potential temperature and specific humidity are constant in the first 850 m. A capping inversion is imposed between 850 m and 950 m, with amplitudes
  constant and
  variable (Table 1). The free atmosphere lapse rate of
  and
and  are
are  and
and  , respectively. To verify if the results are sensitive to the numerical domain, the cases HT1 and HT5 present different grid points in x-direction.
|
 centered on the grid and
  in the lateral patches. The heterogeneity horizontal scale
  is defined as the wavelength of one complete cycle (cold-warm-cold).The variable time steps satisfy the CFL criterion for all cases. After 3000 time steps, the turbulent flow reached a quasi-steady state, and the statistics for the components are calculated over the subsequent 7800 time steps.Table 2 presents the surface conditions for each simulation. The horizontal length scale of the urban area
  is defined as the surface warm patch in the x-direction. The cold patches outside the urban area represent the rural areas. The PBL height
  is based on the maximum vertical potential virtual temperature gradient (Sullivan et al., 1998). The parameter
  is defined as the maximum value of
  averaged along y-direction. The simulated UHI are classified as a low aspect-ratio plume
  [5]. The measurement of the UHI intensity
  is the maximum difference of temperature near the surface between the center of the urban
  and rural areas
  . To perform the statistical analysis of the UBL structure, a method based on phase averaging was used ([27],[39]) and the variables are decomposed as:
  | (1) |
 are the ensemble average, phase correlated or mesoscale component, and background turbulent variables, respectively. The component f represents the PBL variables
  . The averaging over horizontal plane
  are denoted by
  , and the mesoscale component is determined as
  , where
  is defined as an average over y-direction. Thus
  represents the surface heterogeneities contributions to the statistics.The PBL parameters are normalized by convective characteristic scales of velocity
  , length
  , virtual potential temperature
  , and specific humidity
  , that are defined as:
 | (2) |
 | (3) |
 | (4) |
 is a reference temperature,
  and
and  are the kinematic turbulent sensible and latent heat fluxes (resolved plus subgrid scales), respectively.
|


3. Results and Discussion
- The PBL height is a parameter that characterizes the development of the diurnal evolution of PBL and its determination is important in several meteorological applications[40-41]. Experimental evidences show that the land-use influences the local variability of
 under light wind conditions[42].
 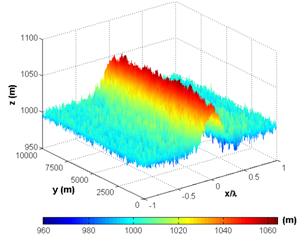 | Figure 1. Temporal average of PBL height  over the horizontal domain for case HT4 over the horizontal domain for case HT4 |
 over the horizontal domain for case HT4 is presented. The spatial variation of zi is in agreement with the horizontal variability of β. It is important to point out that over the urban area (warm patch), zi is maximum
  and 5% larger than the horizontally averaged value[29]. These variations in
  are caused by the presence of a heterogeneity-induced circulation. In all simulated cases,
  presents a similar behavior, i. e., it reaches a maximum value over the urban area. In addition, the authors do not observe significant differences between the results of cases HT1 and HT5. For this reason, the results of HT5 are not presented.
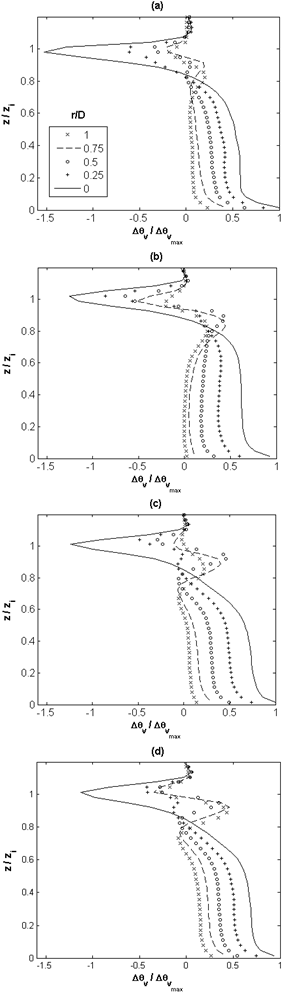 | Figure 2. Nondimensional temperature difference between urban (warm patch) and rural (cold patch) areas for different radial distances  for cases: (a) HT1; (b) HT2; (c) HT3, (d) HT4. The variable for cases: (a) HT1; (b) HT2; (c) HT3, (d) HT4. The variable  is defined as is defined as  . The vertical profiles of . The vertical profiles of  are integrated in y-direction are integrated in y-direction |
 are showed in Fig. 2. The urban-rural temperature difference is maximum over the center of the urban area
  and decreases as a function of the radial distance
  [5]. In the surface layer (SL), the turbulent heat fluxes are maximum and the vertical profiles present a negative gradient. Above the SL, the vertical profiles of temperature remain invariant due to the turbulence convectively driven of the mixed layer (ML). This behavior of the diurnal UHI is different from that observed in the nocturnal UHI. In the nocturnal UHI, the temperature over rural areas exhibits surface inversions ([7],[44]). The negative buoyancy near to the top is the product of intense updraft overshooting at the center of the urban area. All simulations present similar results and the difference between them is the variation in the entrainment zone.The vertical cross-section of the normalized phase- correlated nondimensional potential virtual temperature, vertical and horizontal wind velocity, and specific humidity are shown in Fig. 3.The heterogeneous surface heat fluxes produce a positive anomaly of temperature over the urban area and negative anomaly over the rural areas (Fig. 3a). This warmer of air is rising vertical motions over the urban area and contribute to the development of vigorous updraft in the central area and downdrafts less intense in the rural areas (Fig. 3b)[5]. This updraft penetrates the entrainment zone and the warmer air is horizontally advected to the rural areas.The horizontal length scale of the urban area and the urban-rural difference in the surface sensible heat flux induce mesoscale circulation[45]. As observed in Fig. 3c, the horizontal motions converge at the bottom of the urban area and diverge at the upper half of the PBL with horizontal wind velocity of about
  (urban-breeze)[12]. This circulation transports the moist air upward over the urban area and dry air is advected over the rural area, leading to asymmetrical distribution of temperature and moisture over the domain (Fig. 3d)[28]. Consequently, a strong positive anomaly of moisture in the entrainment zone is generated.These results show that the tropical UHI is found to be favorable for development of convective precipitation, as reported previously by[43-44] for nocturnal UHI.In the convective boundary layer (CBL) over homogeneous surface, the whole layer tends to warm at a uniform rate, implying that the turbulent sensible heat flux decreases linearly with height[34].The vertical profiles of normalized turbulent sensible heat flux
  are linear in the PBL for all simulations (Fig. 4a). These results confirm that the simulations reached a quasi-steady state[46]. On the other hand, the urban-breeze also contributes to the heat transport along the PBL. The mesoscale sensible heat fluxes are null near the surface, gradually increase with height and reach a maximum at
  . In the upper half of PBL, between
  , the mesoscale is greater than the turbulent contribution.The minimum value of total averaged sensible heat flux for all simulations is approximately
  , which has smaller amplitude than the typical value of -0.2[47-48].
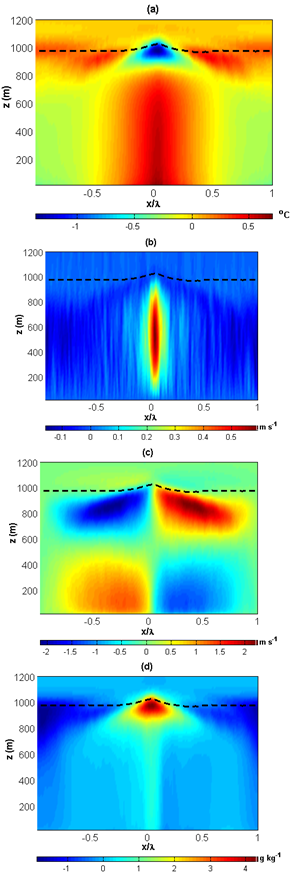 | Figure 3. Normalized phase-correlated of the: (a) potential virtual temperature  ; (b) vertical wind velocity ; (b) vertical wind velocity  ; (c) horizontal wind velocity ; (c) horizontal wind velocity  ; (d) specific humidity ; (d) specific humidity  ; for the case HT4. The horizontal coordinates are normalized by the heterogeneous length scale ; for the case HT4. The horizontal coordinates are normalized by the heterogeneous length scale  . The dashed line represents the PBL height integrated in y-direction . The dashed line represents the PBL height integrated in y-direction |
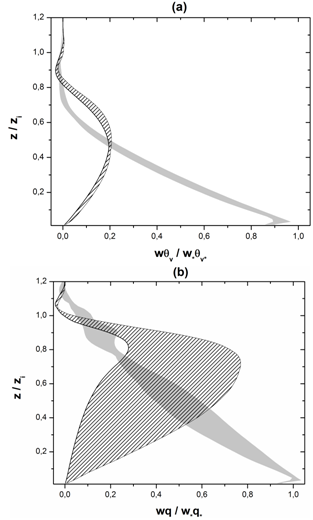 | Figure 4. Vertical profiles of normalized: (a) sensible heat flux  ; (b) latent heat flux ; (b) latent heat flux  for all cases. The gray and dashed areas represent the turbulent (resolved plus subgrid scales) and mesoscale components, respectively for all cases. The gray and dashed areas represent the turbulent (resolved plus subgrid scales) and mesoscale components, respectively |
 compared to the rural area
  . Thus, for heterogeneous cases, the spatial averaging produces a minimum
  smaller than that obtained in homogeneous cases.Due to different initial conditions, the vertical profiles of normalized total latent heat fluxes
  (Fig. 4b) present large variability. This variability occurs because of the different moisture gradients across the entrainment zone[27]. The mesoscale component contributes most of the fluxes in the upper half of the PBL and generates a positive moisture anomaly at the top of the urban area.
4. Conclusions
- In this manuscript, the LES model is used to simulate the vertical structure of the tropical UHI. The heterogeneous surface heat fluxes at the surface produce a positive anomaly of temperature over the urban area.The vertical structure is characterized by a vigorous updraft over the warm patch and downdrafts less intense over the cold patches. This behavior leads to a 5% larger PBL height in the urban area.The horizontal length scale of the urban area and the surface sensible heat flux heterogeneity induce the mesoscale circulation. This circulation transports the moisture air from rural areas upward over the urban area, causing a positive water vapor anomaly in the entrainment zone. Consequently, a convective precipitation may be triggered over heterogeneous surface.
ACKNOWLEDGEMENTS
- The authors are grateful to the Fundação de Amparo a Pesquisa do Estado do Rio de Janeiro (FAPERJ Proc. nº E26/111.620/2011), the Conselho Nacional de Desenvolvimento Científico e Tecnológico (CNPq Proc. nº 473818/2006-0), and the Marie Curie ModObs Network (MRTN-CT_2006-019369) for the financial support.