Clovis Dutra Acosta 1, Viviana Nedel Reckziegel 1, Antônio Cezar Faria Vilela 1, José Luis Duarte Ribeiro 2
1Programa de Pós-Graduação em Engenharia Mineral(PPGEM), Universidade Federal do Rio Grande do Sul(UFRGS)
2Programa de Pós-Graduação em Engenharia de Produção(PPGEP), Universidade Federal do Rio Grande do Sul(UFRGS)
Correspondence to: Clovis Dutra Acosta , Programa de Pós-Graduação em Engenharia Mineral(PPGEM), Universidade Federal do Rio Grande do Sul(UFRGS).
| Email: |  |
Copyright © 2012 Scientific & Academic Publishing. All Rights Reserved.
Abstract
This article presents the methods associated with management EAF baghouse dust and ladle refining furnace (LF) dust. The management methods cover two broad areas: environmental management system practices and technology related factors. The management methods were determined based on professional experience of the authors, review of bibliographies and subject technical literature as well technical visits to eleven steel plants. During these visits, process mapping of the meltshop dust management methods was performed as well as collection of EAF dedusting system quantitative and qualitative data. Collectively the information was used to develop two standard evaluation matrices which provide criteria to assess environmental management system practices and technology associated with meltshop dust management. The matrices have, for each practice, three alternatives: first, the description of best practice; second, the description of intermediate quality; and third, the description that characterizes the early stages of implementing good practices or their absence. The matrices were then used by three steel plants to conduct an assessment of the dust management practices. The primary goal of the assessments was to identify and prioritize areas for potential improvement - be that in environmental management systems area or the technology area. The assessment results showed that steel plants with lower values will require greater investment of resources to achieve measurable improvement. Finally as a result of this project a rigorous and reliable assessment tool was designed to evaluate the meltshop dust generation and management process and provide a quantitative answer to the following question: Which area has achieved a higher level of development as it relates to meltshop dust management: environmental management system practices or control technology?’ The results from using this tool have shown that the performance of management practices is superior to the control technology. Furthermore, experience gained during the assessment indicate this evaluation methodology is adaptable and can be applied to other processes and/or other types of businesses.
Keywords:
Dust From Electric Arc Furnace (EAF) , Ladle Furnace (LF), Environmental Management, Environmental Technology, Dedusting System, Dust Capturing System, Evaluation Matrix
Cite this paper:
Clovis Dutra Acosta , Viviana Nedel Reckziegel , Antônio Cezar Faria Vilela , José Luis Duarte Ribeiro , "Assessment of Environmental Practices and Technologies Associated with Electric Arc Furnace (Eaf) and Ladle Refining Furnace (Lf) Baghouse Dust", American Journal of Environmental Engineering, Vol. 2 No. 6, 2012, pp. 196-211. doi: 10.5923/j.ajee.20120206.08.
1. Introduction
Steel is an important product in the dynamics of human activity, and plays a pivotal a role in the functioning of the economy. As steel is fully recyclable, it moves the economy in all its stages. The steel industry has adhered to the principles and values of sustainable development, always seeking the most rational use of natural resources and inputs, and adopts technologies which minimize the impacts of steel production on the environment[1].The environmental legal and regulatory requirementsaffecting steel production activities have become significantly more complex on a worldwide basis. Authorities now take a much a closer look at industrial production companies than in former times. This is driven in part, by the increasing awareness and sensitivity of politics and the public in terms of environmental pollution, such as dust emission from stacks and buildings. Regulatory limits for emissions are becoming more stringent. With increasing frequency lower emission limits are applied, putting heavy pressure on steel plants to reduce emissions[2]. Currently, it is noticeable that there are steps in industrial processes in which greater value is being given to management practices (ie, policy, procedures, job aids, training) issues to the detriment of technology (typically capex driven). Apparently, this suggests that, in these cases, technological issues are widely known, and that they have stabilized. Given this scenario, the main objective of this study is to construct a methodology for assessing the Steelmaking process that produces Electric Arc Furnace (EAF) and Ladle Furnace (LF) dust focusing on developing a qualitative answer to the following question: "What area has achieved a higher level of development: management system practices or control technology ?" The study will also identify, by using an evaluation matrix, practices with lower priority values which will require effort to improve their performance and to present the primary practices and technologies for the process. To construct the matrices, 70 practices – 35 management ones and 35 technology were ranked from “most desirable” (considered model practices or benchmarks) to those that had fallen out of use or are seldom used.As for the evaluation of environmental performance, the author presents a method that first identifies and prioritizes the factors that affect environmental performance, and then define the indicators to be measured. By doing so, the use of indicators misaligned with the environmental management process is avoided[3].Given this reality of the organizational environment, it is appropriate to understand what environmental management has come to be. It is perceived as a continuous, adaptive process through which organizations define and redefine their goals and objectives related to protecting the environment, the health of their employees, their clients and the community, in addition to which it selects strategies and means to achieve these objectives in a given time, by constantly evaluating its interaction with the external environment[4].It is up to management to optimize the functioning of organizations by taking rational decisions founded on collecting and processing relevant data and information and, thereby, contributing to their development and to satisfying the interests of all its employees and owners, and moreover to satisfying the needs of society in general or a particular group[5].Technology is the organized set of all scientific, empirical or intuitive knowledge, used in producing andcommercializing goods and services. Technology is the most important factor for increasing the global competitiveness of a company. Further, the assessment of technology is an ongoing process, which may be terminated at any time, in the light of additional information. Additionally, the technique of assessing technology is a methodology used by companies to enable it to monitor and use multiple sources so as to obtain the most complete information[6]. EAF/LF dust (see Figure 1), is a solid waste generated in the process of filtering particulate emissions from Electric Arc Furnaces (EAFs) in melt shops, and in smaller amounts in Ladle Furnaces (LF) in steelworks. This process was selected to conduct the assessment considering applicable environmental management system practices and control technology. The generation of dust is associated with one of the main steps within the steelmaking process, in addition dust can adversely affect the environment if mismanaged. In semi-integrated steel mills, the electric melt shop is the area responsible for processing raw materials such as scrap, pig iron (smelted iron ore), metal alloys and other inputs, into steel. The EAF/LF process begins with the arrival of raw materials and other inputs, their preparation and benefiting, the preparation for loading the EAF – which then moves on to charging, melting of the load, the formation and removal of slag, tapping the steel onto the ladle, refining in the ladle furnace, and includes the system for capturing the atmospheric emissions (see flowchart Figure 2) and the recycling of the dust captured in the EAF and LF.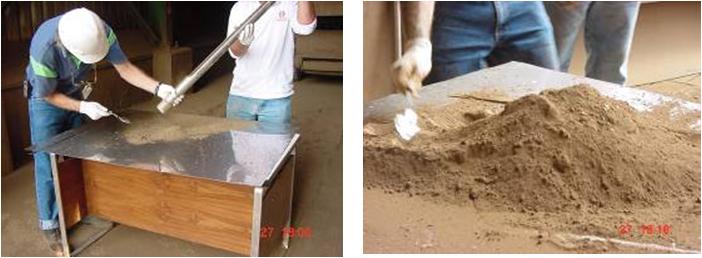 | Figure 1. Sample of EAF/LF dust |
The meltshop dust contains high concentrations of the oxides of zinc, iron, calcium and other metals. Typically, the lead and zinc are of commercial value, while the other metals are not economically recoverable. Currently EAF dusts are treated in high temperature Waelz rotary kiln-type processes, where the lead and zinc oxides are selectively reduced and simultaneously reoxidized and a crude zinc oxide is produced and recovered[7]. The product of filtering emissions from the Electric Arc Furnace of the meltshop is a solid waste called Electric Arc Furnace Dust (EAF) dust. This dust, according to the author, is formed by the volatilization of metals such as zinc and lead, which, due to the operating temperatures in electric furnaces, go into the vapor state, and are oxidized because of the excess of oxygen and, later, cooled by the air cooling system[8].The real problem today is not whether heavy metals are toxic or not, since we know that they are, but identify the concentrations which do not produce harmful effects. The seriousness of heavy metal contamination is further compounded by the fact that they are generally water soluble, non-degradable, vigorously oxidizing and are strongly bonded to many biochemicals inhibiting their functions[9].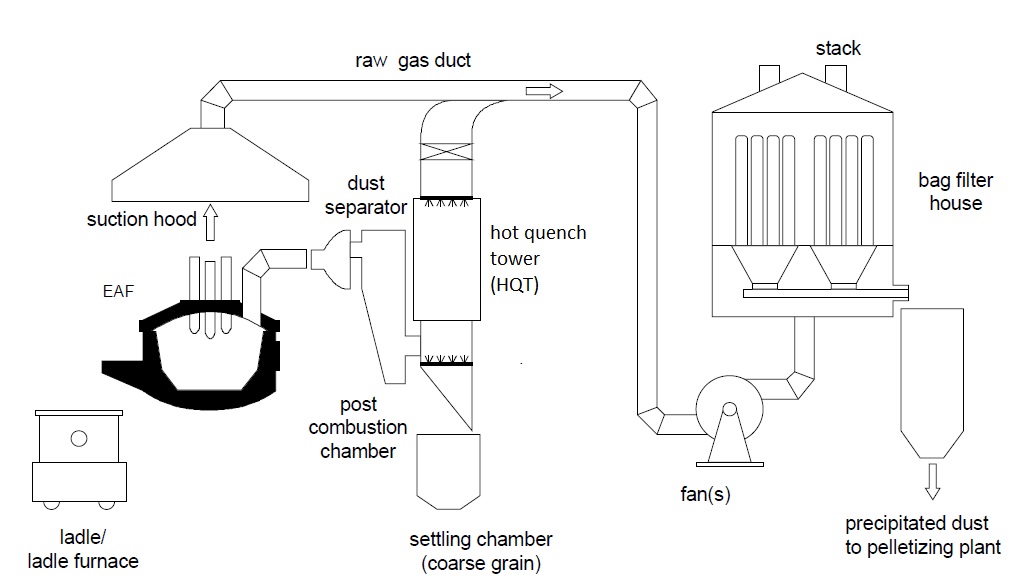 | Figure 2. Main components of an EAF/LF dust collector system[10] |
2. Materials and Methods
2.1. Field Study
The field study focuses on two steel companies producing long carbon steel products, identified as L123 and L45, and a steel company that produces specialty long steels, identified as E12. These companies were chosen because their environmental performance has won recognition, both in management and technology, in addition to which this selection enables two different products made in steelworks – long carbon and long special steels to be assessed.Company L123 has a melt shop with two EAFs and LFs, a rolling mill, wire-drawing and a nail factory. Annually it produces around 400,000 tons of steel, commercialized in the form of billets, wire rods, profiles, round structural steels, wires and nails. Company L45 operates a melt shop with one EAF and one ladle furnace, a rolling mill, wire-drawing and a nail factory. Annually it produces around 1 million tons of steel, commercialized in the form of billets, wire rods, profiles, flat, round structural steels, wires and nails. Company E12 has a melt shop with one EAF, one ladle furnace and one VD (vacuum degassing) furnace, a rolling mill, and mechanical transformation plant. Annually it produces around 400,000 tons of steel commercialized in the form of billets, square, round and flat bars).
2.2. Evaluation Matrix
Development of an evaluation matrix for the meltshop EAF/LF dust process is the main objective of this project. In addition the project seeks to develop and strengthen formal knowledge of bibliographies, as well as informal knowledge, consisting of facts and experiences from professional employment, plant visits and common and established industrial practices.Figure 3 shows a conceptual diagram of the methodology adopted for developing the evaluation matrices, an example of a matrix is presented in Figure 4. The specific practices listed in the matrix as well as their description are based on information obtained from the pillars. These pillars, which support the specific content of the matrices, are designated as step 1 in Figure 3. The pillars consist of information from literature/published studies and relevant technical papers, typical industrial practices associated with the steelmaking operations, reports of technical visits to facilities and key environmental performance indicators associated with the operation of the EAF/LF dust collector systems based on the research, presented in Acosta’s thesis[11]. EAF dedusting systems are complex and have many variables, such as raw materials and inputs, technological solutions to extract gases generated in the EAF, systems to treat and cool gases and the shapes of the facilities and buildings. Given this inherent variability mapping was performed in eleven different EAF dedusting systems of steel companies, which produce long carbon steels and long special steels. The mapping and subsequent data analysis was used to develop simplified view of dedusting facilities and to identify specific performance indicators. After analyzing the data, vis-à-vis the performance of the dedusting facilities surveyed, it was possible to determine the values and operating ranges for the indicators. Further information can be found in Acosta’s thesis[11].Step 2 of Figure 3 represents the evaluation of environmental performance and the environmental impact that were provided by the experts that were consulted for this project. In Figure 3, the image of the eye illustrates in a figurative manner, that the focus is on the practices that have lowest performance and which also have the least positive environmental impacts i.e., conversely they represent high negative environmental impacts. Multiplying these two values (performance x impact) generates the factor called "prioritization".Finally, step 3 of Figure 3 illustrates, figuratively, the practices that showed a low prioritization value, as determined above. These practices require more oversight and follow up actions in order to achieve better performance. On the other hand, the practices that showed a high prioritization value may just require the implementation of routines/standard procedures so as to ensure their high performance is maintained. In summary, the final result obtained from the evaluation matrix will enable the practices that had the lowest levels of priority to be selected and included in the company’s annual action plan.Figure 4 shows the model of the environmental management practices matrix; this is the same form that will be used to evaluate environmental technology. Seventy (70) practices were used in the assessment, 35 in the management practice area and 35 in the environmental control technology area. Both the management and the technology practices are shown with their respective indicators which are considered to be representative and associated directly and indirectly with the EAF/LF dust process. The practices and the respective indicators correspond to each environmental management system or control technology requirement. The performance of each of these requirements will be determined based on the scores assigned for each criteria (ie indicator).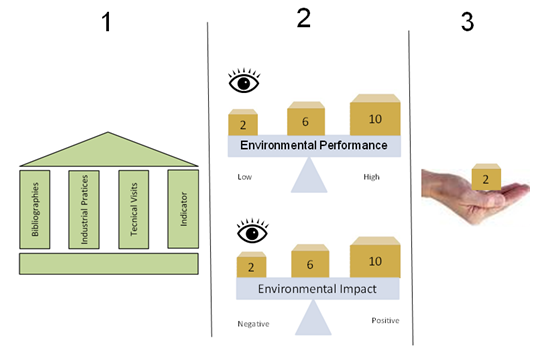 | Figure 3. Diagram associated with the process of constructing evaluation matrices |
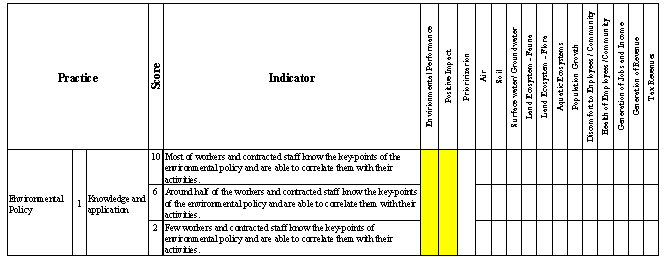 | Figure 4. Matrix evaluating the performance of environmental management |
The evaluation of performance in each practice is made by assigning a score to the criteria. The scores range from 2 to 10: a score of 2 corresponds to a low performance, average performance is a score of 6 and a score of 10 is a high performance. While the evaluation was being conducted, the evaluators adopted intermediate scores to enable the situation of each company to be better reflected. The description of the content of each practice, both of the management process and the control technology, is presented in Tables 1 and 2, respectively. Tables 1 and 2 are discussed in Section 3 below. The positive environmental impact of each practice was also assessed by scoring each practice, with values ranging between 2 and 10, in which a score of 2 is a positive low environmental impact, while a high negative environmental impact may result in serious damage or significant severe impact/consequence to the environment and to people, with the potential for permanent impact or global damage. A score of 6 represents an intermediate condition, while 10, represents a high, positive environmental impact, with attendant minimal, negative impacts of low severity/ consequence/ potential for causing damage. Similar to the evaluation of performance, while the evaluation was being conducted, the evaluators adopted intermediate scores for the impact.To facilitate the identification of the potential environmental impacts of different practices, Figure 2 presents the list of impacts, most likely to occur divided by environmental media: air, soils and water.
2.3. Data Collection
Data collection from the specialists began with site meetings, were the purpose of the study was explained, the project was presented, instructions provided for completing the evaluation matrix, and thereafter, the file with its respective matrices was provided. Throughout the course of the research, several meetings were held between the researcher and the evaluators to provide guidance, answer relevant questions and to learn about the process being assessed. The meetings with the evaluators more one or two other people were held between October 2010 and January 2011.The number of evaluators varied depending on the segment being assessed: long carbon steels segment was represented by two companies (L123 and L45) and that of long special steels (E2) by one company. Three evaluators participated in the assessment of Company E123 while two evaluators each participated in the assessments for L45 and E45. It should be noted that research was not limited to the number of participants above, because, even though an evaluator consolidated the scores, he received a contribution from others who were partially involved within their respective specialties.
3. Results and Discussion
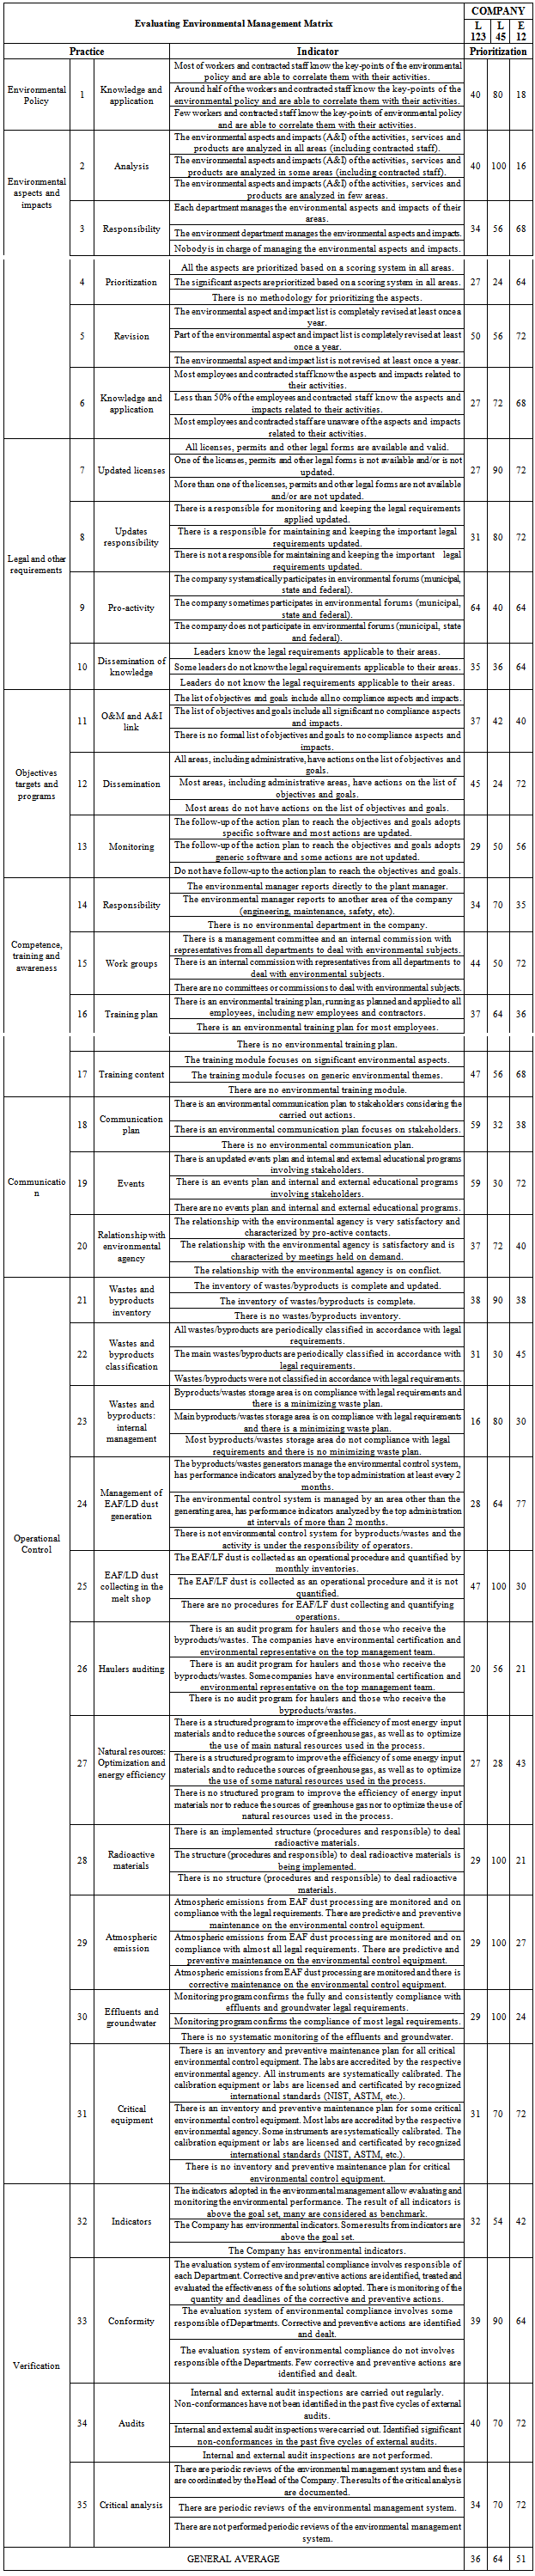
The management practices evaluation matrix is shown in Table 1, and shows the 35 practices with their respective indicators. This table also presents the results obtained from the prioritizing evaluation of companies: L123, L45 and E12. Prioritization is the factor obtained by multiplying the score given to the performance and environmental impact, in which the impact has the function of setting the weight for each practice, thus enabling a weighted average score to be obtained based on the environmental impact.The matrix of technology assessment is represented in Table 2. This matrix shows the 35 practices with their respective indicators as well as the result of the prioritization assessment obtained from the evaluation of the three companies: L123, L45 and E12.Table 1. Practices, indicators and result of prioritizing by company in the evaluating environmental management matrix
 |
| |
|
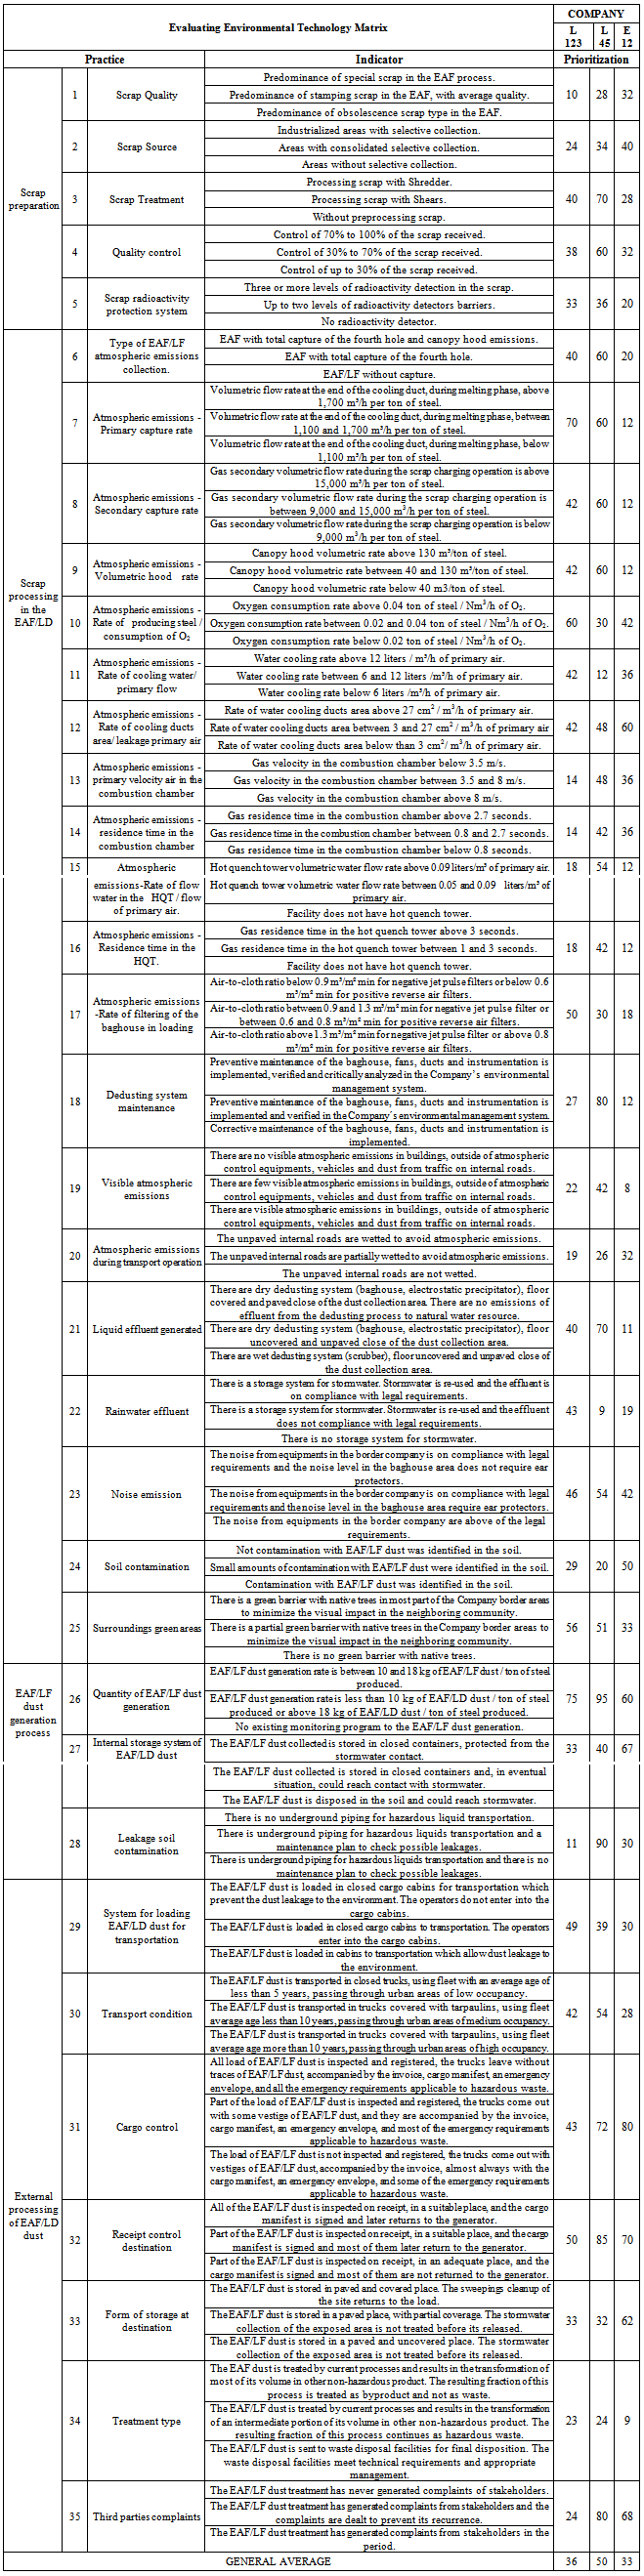
Table 2. Practices, indicators and results of prioritizing by company the evaluating environmental technology matrix
 |
| |
|
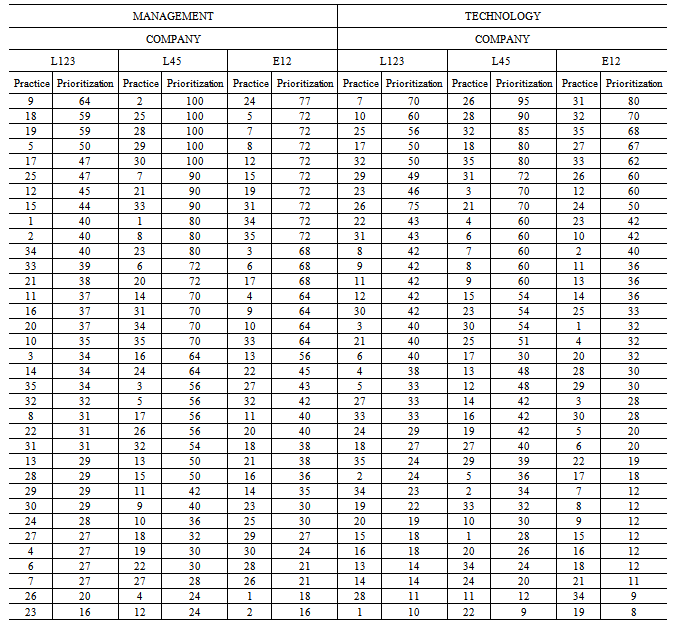
The results of the prioritization are presented for each of the companies in ascending order in Table 3. The scores with the highest values of prioritization are marked in the upper part of Table 3, and scores with the lowest values are marked in the bottom part.Table 3. Ranking of the practices and result of the prioritization by company in the environmental performance matrices
 |
| |
|
In Sections 3.1 to 3.4, an analysis of the results of the scores of prioritizing the practices is presented. To facilitate understanding of the description, the respective numbers of the practices are reported in parentheses.The result of the five largest and five smallest values of prioritization showed a single practice that was common to the three Companies (32) and six practices (4, 5, 16, 26, 34 and 35) were common to two companies. This may indicate that there are common practices, but the most common practices did not give common results, within the range of cut-off bands adopted.
3.1. Highest Prioritization Values for Environmental Management Practices
Practices that showed the highest prioritization values for Company L123 are related to the issue of legal requirements (9) and communication (18 and 19). Company L123 also manifests a high priority score for the practice of environmental training programs focused on significant environmental aspects (17). Company L123 takes a systemic part in local, regional and federal environmental forums, and has contracts with specialized companies that produceperiodic updates on Brazilian and international environmental legislation. The management team acts routinely to disseminate knowledge of legal requirements to its workforce. In the area of communication and training programs, it follows procedures that demonstrate respect for its stakeholders, attempts to maintain everyone informed about its initiatives on sustainability and continually updates its employees through planned training events.For Company L45, the practice that showed the highest value for prioritizing was the operational control practice of its activities. The company has outstanding scores related to its systems for collecting EAF/LF dust (25), radioactive materials (28), atmospheric emissions (29), as well as those that relate wastewater and groundwater management (30). This company has an experienced environmental team on staff. The team has been recognized for its to environmental expertise. The company was one of the early adopters of the ISO 14001certification[12]. The combination of these factors allows the company to differentiate itself in the operational control practice.Company E12, is similarly to Company L123; it showed its highest values for prioritizing in the legal requirements practice area (7 and 8), since they exhibit similar actions strategies to company L123. Company E12 has a high score in managing the generation of EAF/LF dust (24), in which environmental control is managed by the generating area and the company has performance indicators which are reviewed frequently. Another practice area that these two companies share the systematic updating and reviewing environmental aspects and impacts (5), an activity that they perform regularly and often involves a large part of their work force.
3.2. Highest Prioritization Values for Environmental Technology
Company L123 received an outstanding score for the high volumetric flowrate of its exhaust system, available to capture its primary emissions (7), which ensures good capture of EAF/LF dust emissions generated during the melting phase of the furnace. In addition this company also received the second highest score, related to the low rate of oxygen consumption of its operation (10). The low oxygen consumption contributes to this performance, as this ensures steel is produced with a lower consumption of oxygen which results in lower rate of gas emission that need to be collected by the collection system. In addition this company had a high score for surrounding green areas (25), which is a result of projects to plant trees and shrubs over the years. This green barrier makes the landscape blend in harmoniously with the neighboring community.Company L45 showed good levels for the indicator on generating EAF/LF dust (26) in its process, which may reflect the good condition of the Shredder scrap it uses to produce steel. Company L45 had similar practice score to Companies L123 and E12 in the area of disposal facilities that receive their EAF/LF dusts (32), by implementing practices to ensure that such facilities are adequate. It should be noted that this practice (32) was the only one held in common between the three companies. Finally, the quality of its pipeline facilities to transfer dangerous products (28) gave Company L45 a high score in this area with the related safety benefits. Company E12 showed high performance in its practice to control the load sent to recipients (31 and 32) so as to ensure they are appropriate and meet the relevant legal requirements. This care is also reflected in the indoor storage facilities for EAF/LF dust (27). As a result of this care, the practice that deals with complaints from interested parties (35), scored higher, as manifested by the absence of any type of complaint.
3.3. Lowest Prioritization Values for Environmental Management System Practices
The practices that presented the lowest values for prioritization for Company L123, and thus have opportunities for improvement are related to programs for minimizing the generation of solid wastes (23) and to the audit process for transporters of waste disposal facilities (26). The implementation of Company L123’s programs to reduce the generation of waste presents promising improvement opportunities in the future as the process of monitoring the waste disposal facilities is being implemented and is undergoing continuous improvement, in line with the industrial practice presented in Acosta’s thesis[11]. For Company L45, the practices that had the lowest levels of prioritization for the management process were associated with the coverage given to the practice of objectives and goals (12), in which the Company identifies opportunities to enhance this tool. An opportunity to improve management practice on the scoring methodology was identified. This enables environmental aspects and impacts (4) to be prioritized, which will enable Company L45 to obtain a criterion to select those aspects that need to be worked on. It was also this practice (4) which was identified by the low score in Company L123. The Company also indicated that it will require to enhance its program to preserve natural resources, and to optimize its energy efficiency (27).Company E12 has the challenge of adding depth to its activities of disseminating knowledge of and connecting with its Environmental Policy (1) and to the practical analysis of its environmental aspects and impacts (2) together with its workforce. Similar to Company L123, it will invest effort in enhancing the audit process together with haulers and those who receive wastes (26).
3.4. Lowest Prioritization Values Environmental Technology Area
Company L123 identified an opportunity in qualifying the scrap received (1) and acts consistently with its productive chain, by seeking to raise awareness on adopting segregation practices, to avoid the delivery of undesirable materials being mixed with steel scrap. To improve this practice, environmental awareness programs targeting its haulers and suppliers of scrap are being developed up. This Company identified the need to work together with its facilities to improve the transport of hazardous materials (28). It also indicated it needs to invests to upgrade its facilities and equipment to eliminate underground pipes and tanks; Company L45 pointed to the opportunity to improve its stormwater collection system (22) and the development of a reliable indicator to optimize the amount of water required for cooling the primary gases of the EAF/LF dust collector system (11). Company L45 reported that it needs to make constant improvements in this area.Company E12 has the challenge of improving its system for reducing atmospheric emissions (19) and acts systematically as to updating its collector and treatment facilities. Like Company L45, it seeks to identify sustainable treatment technologies to properly recycle/dispose the EAF/LF dust collected (34).
3.5. Summary of the Management and Technology Evaluation Matrix
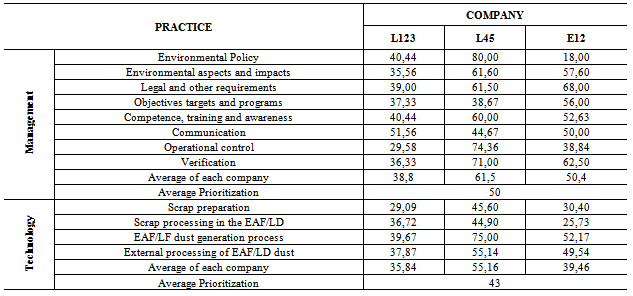
Table 4 presents the summary of the prioritization results obtained in the management and technology evaluation matrix of the three Companies evaluated (L123, L45 and L12). In this Table, the highest prioritization values of each company are highlighted in dark gray and the lowest ones in light gray.Table 4 shows that the management practices were on average 16% higher than those for technology practices. Therefore, to achieve a balance between management and technology, the actions of the process of environmental technology in the three companies evaluated should be strengthened. One possible factor that justifies the difference in favor of the environmental management process may be associated with the work done by companies to obtain environmental certification such as ISO 14.000[12].This difference may suggest that there a higher level of effort and focus is placed on management issues as compared to technology. Apparently, this suggests that everyone is knowledgeable with technological issues and that they have stabilized. Based on this hypothesis, the activity and efforts of companies in search of better results should be focused in their management practices. However, it is important to note that if the technology is not systematically monitored, its stability will deteriorate and the process will begin to present problems, such as reduced quality, increased costs and detrimental environmental impacts. Another possible reason is the greater prominence and recognition given to professionals in management and less time required to academically and professionally prepare a management professional, compared to its technology counterpart.The introduction of management practices in companies, such as that of a management or technical career paths, also known as “Y” career, is a form of action to enable a balance to be achieved between management and technology practices. By adopting this methodology, management and technology professionals will perform their duties with the same level of empowerment and engagement, thus providing decision making that is consistent for the sustainability of organizations.Many experts, for lack of choice, unduly migrated to management positions. But not everyone wanted or had the ability/skills for a management position, and often remained in positions below their potential and expectations, thus creating a state of professional demotivation. It was under this perspective that, twenty years ago, the “Y” career structure was created. Today, this practice enables technology specialists to be greatly valued, recognized and rewarded, thereby increasing retention for this talent[13].The highest average prioritization values of the three companies were in the technology practice area of generating EAF/LF dust. Another practice, in which the smallest average values coincided, was that of processing scrap in the EAF of companies L45 and E12.The technology practice scores for other practices indicate significant differences between companies; this is indicative of the different level of importance/focus/level of effort attributed by the companies. Table 4. Summary of the prioritization scores obtained in the matrix of environmental assessment, classified for each step of the EAF/LF dust
 |
| |
|
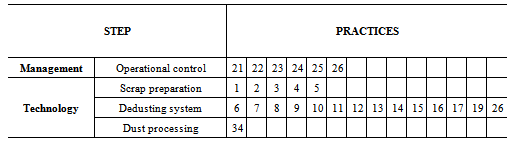
Table 5. List of the practices considered directly related to the process of EAF/LF dust
 |
| |
|
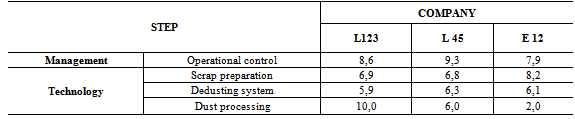
Table 6. Result of the evaluations of performance of the practices in the companies
 |
| |
|
An additional analysis was undertaken, using the results of the management and technology matrices, to identify, among the three companies evaluated, the best performance or strengths in the EAF/LF dust process. For this analysis, practices were excluded, which although important for the environmental process as a whole, do not have a direct relationship with the EAF/LF dust process. The criteria adopted for this analysis as it relates to scrap preparation, are: 1 (quality of the scrap), 2 (origin of the scrap), 3 (processing of the scrap), 4 (quality control when scrap is delivered) and 5 (radio-active protection system for scrap). The same method of selection was used to select the practices for the other processes. Table 5 shows the practices that are directly related to the EAF/LF dust process.Using the practices selected from Table 5, the values reported by the evaluators, for environmental performance, were consolidated per company into the respective stages of the process, as shown in Table 6.The result of Table 6 showed that company L45 had the best performance in the management process, for the practices that are most directly associated with the EAF/LF dust collection system. These practices are all core to the operational control area such as, inventories, classifications, internal management and the audit of wastes/by-products and, managing the EAF/LF dust generation and collection system within the melt shop. This result is probably a reflection of the effort of this company, which pioneered the development of best environmental practices in the Brazilian steel industry.Company E12, however, had the best performance in the technological process involved in preparing scrap. This practice area covers the quality, origin, treatment, radio-active scrap detection/protection system and quality control associated with scrap deliveries. This company is recognized for the high quality of its product - special steels, which in part the result of working together with the scrap supply chain to ensure the that raw materials entering its facility are of, quality that its compatible with its products. In the technology stage, collecting the EAF/LF dust, all companies assessed presented values that were balanced according to the score given by the evaluators. This practice includes the type of system to capture of emissions from the furnaces; the primary and secondary volumetric flow rate of ventilation systems; the volume of the canopy hood; oxygen consumption; rates of cooling water; the size of water cooled area of the ducts; the velocity of gas in the combustion chamber; the residence time in the combustion chamber; the flow rate of water and the residence time in the Hot Quench Tower; the filtration rate of the bag house; frequency of occurrence and opacity of visible emissions into the atmosphere and amount of EAF/LF dust generated.As for Company L123, it performed better in the technology process area associated with management of EAF/LF dust. This result is probably associated with the company’s practice of recycling EAF/LF dust. The dust is recycled at a metallurgical company which produces metallic alloys from zinc. This process has become sustainable due to factors such as the proximity of the recycling plant. It should be noted that the byproduct of the recycling plant is recycled and is not a waste material.The practices that had the lowest scores in the evaluation matrix, as reported in Sections 4.3 and 4.4, should receive priority attention and additional efforts should be dedicated to achieve excellence in the operations of the companies evaluated. These additional efforts should be an integral part of the annual action plan of the respective company’s. Finally, the practices that have a high prioritization values should standardized using routines/standard procedures to ensure their high performance is maintained.
4. Conclusions
The evaluation of the three companies (L123, L45 and E12), using matrices, enabled the identification of key strong and weak points in the EAF/LF process as well as likely justifications for their respective scores and actions for improvement to achieve operational excellence. The assessment results showed that the environmental performance of the management practices is higher, on average, by 16% than the performance of the technology practices; therefore, the question "What has been better developed: management processes or technology? " has been answered.One of the primary results of the research study was to build a robust assessment tool that responded consistently to the EAF/LF dust evaluation process. This was demonstrated by well-defined evaluation results of high and low prioritization obtained for each company evaluated, as can be seen in Table 3. Only a few of the average values of prioritization were held in common by the three Companies for the practices considered in the assessment. The results for most practices showed, that each company in the same general production sector, has its peculiarities which are different from the other two companies. The assessment data shows that the highest and lowest prioritization scores being distributed in different practices.The tool proved to be a simple evaluation method and one that is easy to use, thus making it possible to evaluate different processes used by steel mills and producers of long carbon and long special steels; this leads to the conclusion that the tool can be applied in any other process or company.An important contribution from the evaluation matrix is the generation of priorities between the practices of the EAF/LF dust processes of the companies evaluated, in which the practices with the lowest levels of prioritization, such as programs for minimizing the generation of residues (23) and treating the scrap received appropriately (1), ought to request that greater resources be invested and, thus improve such processes. On the other hand, the practices that have higher priority values, such as those which are related to the question of legal requirements (9) and the volumetric flowrate for ventilation system, available to capture primary emissions (7), may also require routines to be consolidated to ensure high performance is maintained.The indicators obtained when mapping the eleven steel-works, presented in Acosta´s thesis (2012), were used in the evaluation matrix. Based on this indicators methodology, the conclusion can be reached that it is possible to enhance the dedusting facilities of the EAF/LD, by undertaking critical analysis of the result of using these indicators, both for existing facilities as well as for new projects on dedusting system.No published article was found that has presented a similar approach to the objective and contexts of this article. The information presented in this article can serve as a reference to implement and perfect the technological process of EAF/LF dust collection and environmental management.
References
| [1] | IABr - Instituto Aço Brasil. Sustentabilidade. Portal IABr. Available at:http://www.acobrasil.org.br/site/portugues/sustentabilidade/index.asp. Accessed on: 10.08.2011. |
| [2] | KNOT, V.; MORGEMTHALER, R.; PFUNDSTEIN, C. Clean and efficient – Optimization of EAF Dedusting System. Badische Stahl-Engineering GmbH. Kehl, Germany, 2009. |
| [3] | LUZ, S; SELLITO, M; GOMES, L. Medição de desempenho ambiental baseada em método multicriterial de apoio à decisão: Estudo de caso na indústria automotiva. Porto Alegre, 2006. |
| [4] | SEIFFERT, M. E. B. ISO 14001 Sistemas de Gestão Ambiental: Implantação Objetiva e Econômica. São Paulo: Editora Atlas. ed. 3. Revisada e ampliada, p.23-52, 2007. |
| [5] | NUNES, P. Conceito de Gestão e de Gestor. Portal de Nota Positiva: Available at:http://www.notapositiva.com/trab_professores/textos_apoio/gestao/01conc_gestao.htm accessed on: 23.05.2009. |
| [6] | MATTOS, J.R.L.; GUIMARÃES, L.S. Gestão da Tecnologia e Inovação: uma abordagem prática. São Paulo: Editora Saraiva, 2005. |
| [7] | PICKLES, C.A. Portal Science Direct - Thermodynamic Analysis of the Selective Chlorination of electric Arcfurnacedust -: Available at:http://www.sciencedirect.com/science/article/pii/S0304389408018177 Accessed on: 26.05.2012. |
| [8] | BERGMANN, C.P.; GONÇALVES, M. R. F; VICENZI J. Reciclagem do pó de aciaria da planta industrial da Gerdau Aços Especiais Piratini – Charqueadas: Estudo da reciclagem do pó de aciaria como matéria-prima para indústria do cimento. Laboratório De Materiais Cerâmicos. Universidade Federal do Rio Grande do Sul, Porto Alegre, 2008. |
| [9] | SINGARE P. U; TRIVEDI M. P, MISHRA R.M. Portal Scientific & Academic Publishing - Heavy Metals in Vasai Creek, Mumbai: Applied Monitoring and Impact Assessment, Science and Technology. Available at:http://article.sapub.org/10.5923.j.scit.20120204.06.html-Accessed on: 25.08.2012. |
| [10] | SPENGLER T. Report on Best Available Techniques (BAT) in the Electric Steelmaking Industry. Karlsruhe, University of Karlsruhe (TH), 1997. |
| [11] | ACOSTA C.D.: Avaliação da Gestão e Tecnologia Ambiental Aplicada ao Pó de Aciaria Elétrica. Tese de doutorado, Universidade Federal do Rio Grande do Sul, Porto Alegre, 2012. |
| [12] | ASSOCIAÇÃO BRASILEIRA DE NORMAS TÉCNICAS. ABNT NBR 14.001: Sistema de Gestão Ambiental (ISO 14.001). Rio de Janeiro, 2004. |
| [13] | PRATES, A. Portal Dasein - Executive Search. Available at:http://dasein-executive-search.blogspot.com/2010/05/carreira-em-y-desenvolver-competencias.html. Accessed on: 17.11.2011. |
 Abstract
 Reference
 Full-Text PDF
 Full-Text HTML