-
Paper Information
- Next Paper
- Previous Paper
- Paper Submission
-
Journal Information
- About This Journal
- Editorial Board
- Current Issue
- Archive
- Author Guidelines
- Contact Us
American Journal of Environmental Engineering
p-ISSN: 2166-4633 e-ISSN: 2166-465X
2012; 2(6): 182-187
doi: 10.5923/j.ajee.20120206.06
Study on Evaluvation of Benzo (a) Pyrene Soluble Fraction in Respirable Suspended Particulate Matter in Peenya Industrial Area by GCMS
 Abstract
 Reference
 Full-Text PDF
 Full-Text HTML
Nagarajappa D. P. 1, Sateesh. G. Muttagi 1, Lokeshappa B. 1, 2, Anil K Dikshit 3
1Department of Civil Engineering, University BDT College of Engineering, Davangere, 5770 04, India
2Constituent College of Visvesvaraya Technological University, Belgaum
3Centre for Environmental Science and Engineering, IIT Bombay, 4000 76, India
Correspondence to: Lokeshappa B. , Department of Civil Engineering, University BDT College of Engineering, Davangere, 5770 04, India.
| Email: |  |
Copyright © 2012 Scientific & Academic Publishing. All Rights Reserved.
Polycyclic aromatic hydrocarbons (PAHs) were identified to be one of the major toxic air pollutants in urban environment. PAHs are mostly formed during incomplete combustion or pyrolysis of organic material. According to National ambient air quality Indian standard, benzo (a) pyrene (BaP) concentration Particulate matter (PM10) in ambient air in the Peenya industrial area Bangalore metropolitan in India has been determined. Air samples for the analysis of BaP in suspended particles have been collected (as 24 h sample once in a month) at selected monitoring sites within the Peenya industrial monitoring network. In this research work, the results of PM10 were collected between February 2011 and April 2011. The Benzo(a)pyrene concentrations of the eight sampling sites ranged from zero to 0.0490ng/m3. Spatial variations were predominantly due to the different strengths of source emission. The total Benzo(a)pyrene concentrations at Kongovi Monitoring Station site was higher than those at other seven sites during monitoring period, observing the results obtained during the period of a whole year, it was concluded that, the concentrations of BaP were much higher during winter season at almost all measuring sites.
Keywords: Respirable Suspended Particulate Matter (PM10), PAHs, Benzo(a)pyrene (BaP)
Cite this paper: Nagarajappa D. P. , Sateesh. G. Muttagi , Lokeshappa B. , Anil K Dikshit , "Study on Evaluvation of Benzo (a) Pyrene Soluble Fraction in Respirable Suspended Particulate Matter in Peenya Industrial Area by GCMS", American Journal of Environmental Engineering, Vol. 2 No. 6, 2012, pp. 182-187. doi: 10.5923/j.ajee.20120206.06.
Article Outline
1. Introduction
- Polycyclic aromatic hydrocarbons (PAHs) are products of incomplete combustion formed during burning or pyrolysis of organic matter such as coal, oil, biomass, gasoline[1] and diesel[2,3]. Also PAHs in ambient air can be emitted from industrial combustions[3,4], aluminum production, cement manufacture, production of coal tare, coke and asphalt, petroleum catalytic cracking and restaurants[5]. Atmospheric PAHs can exist in both gaseous and particle phases, while a greater fraction of airborne organic particulate matter is present in the respirable size range. Some studies found that PAHs with two or three benzene rings exist in the vapour phase, while PAHs with more than five rings were observed primarily in the particulate phase[6]. This suggests that particulate PAHs are regarded as significant hazardous substances to human health when introduced through the skin or through the lungs or ingestion. Air pollution has adverse effects on respiratory and cardiovascular systems such as acute reduction in lung function, aggravation of asthma, increased risk of pneumonia to the elderly, low birth weight and high death in newborns[7,8]. Particulate matter have been suggested to pose a great risk to human health due to their high number concentration in urban environments and potential to penetrate (ultrafine particulate) from the lung alveoli into the blood circulation[9]. The chemical composition of airborne particulate matter (PM) in polluted atmosphere has become a topic of considerable importance over the recent years in relation to public health[10,11]. Particulate matter forms a highly complex mixture of different-sized solid and liquid particles[12-14]. Mass concentration may not be the most appropriate exposure parameter for the assessment of health risks of atmospheric pollution[15]. Many aromatic compounds, commonly identified in airborne particles, are suspected genotoxic agents and carcinogens, and some of them may also cause acute health effects[16,17]. PAHs with four or more structural rings were concern treated on the fine and ultrafine particles, and various PAH investigations can be performed equally well from both the PM2.5 and the PM10 samples[14]. Thus, inhalation of PAHs in particulate mixture is potentially a serious health risk[18,19]. Benzo(a)pyrene has been regarded as one of the markers of the total and carcinogenic PAHs[7,14]. The European Commission has set an annual target value of 1 ng/m3 for benzo (a) pyrene in ambient air from content in PM10 fraction, while current legislative in India set an annual limit value of 1 ng/m3 for Benzo (a) pyrene in RSPM. On the other hand, the natural background level of BaP may be near zero; in rural areas its concentration ranges from 0.01–1 ng/m3, in urban areas from 1-10 ng/m3.In order to estimate the carcinogenic risks for humans, the benzo(a)pyrene equivalent (BaPE) carcinogenicity was evaluated by multiplying the concentrations of each PAH with their toxic equivalent factors (TEF)[20] which can be used to calculate the relative carcinogenicity of ambient samples with a known distribution of PAHs.In the present research work carried out the concentration of BaP in ambient air of the Peenya industrial area Bangalore, India and recorded at selected number of different types of sampling sites in period February 2011 to April 2011 has been evaluated for the first time. The PM10 samples were collected from February 2011 to April 2011. The annual and seasonal BaP levels in RSPM samples in industrial area Bangalore were compared with BaP concentration National Ambient Air Quality Standards.
2. Experimental Section
- The present research work gives a detail description of the adopted for various experiments.
2.1. Sampling Stations
- Total Eight sampling Stations were selected for monitoring in Peenya Industrial Areas of Bangalore, India and the Table 1 shows the details of sampling stations selected for the study.
2.2. Meteorological Conditions
- The Bangalore, India is endowed with a very salubrious and equable climate and hence classified as seasonally dry tropical savanna climate with four seasons. Dry-season with clear bright weather from December to February. The summer season is from March to May which is followed by south-west monsoon season from June to September. October and November constitute the post monsoon season or retreating monsoon season. The Meteorological data needed was collected from Indian Meteorological Department, Bangalore for the period February 2011 to April 2011.
2.3. Sampling
- PM10 samples were collected by Respirable dust sampler. The Respirable Dust Sampler was introduced by Envirotech with technology from National Environmental Engineering Research Institute (NEERI) Nagpur in 1992. The periods were from February 2011 to April 2011, respectively. All filters were maintained in a condition of 50% RH and 25℃ for over 48 h and weighted before sampling. The Respirable dust samplers were operated at flow rates of 0.9 - 1.2 m3/min. PM10 collected on 20.3 cm×25.4 cm Whatman quartz microfiber filters. The Respirable Dust Sampler has a unique flow measuring system using an orifice plate incorporated into the body of the Filter Adopted Assembly ensures exact measurements of the air passing through the filter, without any leakages or extraneous air flows, affecting the flow readings.. PM10 samples were collected for 24 hours.
2.4. B(a)P Analysis
- RSPM-BaP samples were prepared according to Compendium Method TO-13A[21], determination of PAHs in ambient air using GC/MS. All samples were extracted using a Soxhlet extractor with a solvent solution of 250 mL (a mixture of 125 mL n-hexane and 125 mL acetone) for 18 h. The obtained extracts were then concentrated to 1 mL using a rotary evaporator and cleaned up on the column with 10 g activated silica gel and sodium sulfate on the top of the column. The column was rinsed with 60 mL dichloromethane and 40 mL pentane. The collected extract was rejected and, when the level of the pentane layer was above the sodium sulfate, 1 mL of sample extract was applied to a column. The column was rinsed with 25 mL of pentane, fractioned with pentane containing aliphatic hydrocarbons, and it was rejected. Column rinsing was continued with 25 mL of methylene chloride: pentane (4:6) mixture. The extract was then concentrated using a rotary evaporator with 100 μL toluene as keeper, solvent was exchanged to toluene until 0.5 mL and analyzed on GC/MS.PM10-BaP samples were extracted with solvent solution of 50 mL (a mixture of 12.5 mL hexane and 12.5 mL acetone (1:1) in multiwave 3000 with rotor 8SOLV and cleaned up the same way as PAH-RSPM. The obtained extracts with 100 μL toluene as keeper were concentrated using the rotary evaporator to 0.5 mL and analyzed on GC/MS. Benzo(a) pyrene was determined using an thermo scientific gas chromatograph mass selective detector and capillary column DB-5 MS l, 30m 0.25 mm,25 μm. The oven temperature was programmed to be from 70°C at a rate of 8°C/min to 310°C and held for 5 min with helium as the carrier gas. Semi-internal standard was used (deutered PAHs) for internal calibration. Prior to analysis, a calibration curve for the benzo(a)pyrene was obtained by spiking seven known quantities of substance with an R2 of the calibration curve above 0.95. With each set of samples, both field and laboratory blank samples were prepared and analyzed together with the samples. Benzo(a)pyrene concentrations were corrected with reference to a blank.UltraScientific PAH Mixture PM-831 PAHs mixture with Benzo(a)pyrene concentration of 500.8±2.5 μg/mL was used as the external standard for the calibration curve. Ultra scientific semi-volatiles internal standard mixture ISM-560 with deuterated compounds:acenaphthene-d10;chrysene-d10; 1,4-dichlorobenzene; Naphthalene-d8; perylene-d12; penanthrene-d10 was used as the internal standard.The detection limit (DL) for each species was determined according to US-EPA test methods SW-846(http://www.epa.gov/sw 846/pdfs/chap1.pdf). A known quantity of each standard substance was measured seven times, and the DL for each species was three times the standard deviation from the seven tests. When converted to atmospheric concentration, the detection limit for each of PAH species, including BaP, was 0.001 ng/m3.
3. Results and Discussion
- During study period of 2011, in the months of February to April the Air Quality of peenya was monitored for the parameters PM10, Benzo (a)pyrene. The results are summarized in Table 2 and Table 3 and Figure 1 and Figure 2 represents the graphical variation of the selected parameters for study period February 2011 to April 2011.
| ||||||||||||||||||||||||||||||||||||||||||
| ||||||||||||||||||||||||||||||||||||||||||
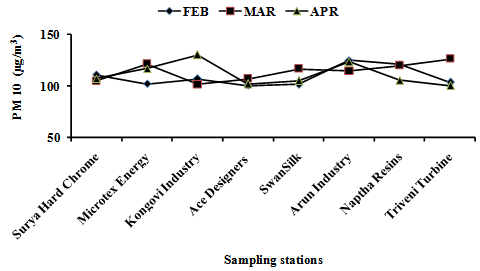 | Figure 1. Variation of PM10 in Ambient Air at Sampling Station during Study Period Feb 2011 To Apr 2011 |
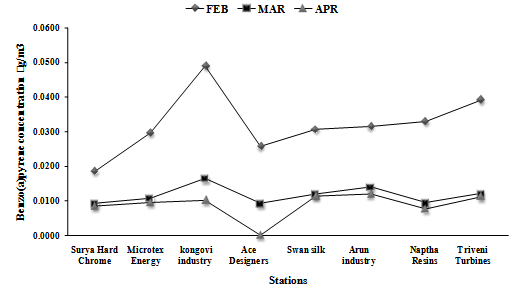 | Figure 2. Variation of Benzo(a)Pyrene in Ambient Air at Sampling Station during Study Period Feb 2011 To Apr 2011 |
- The variation in concentration of Benzo(a)pyrene taken at eight locations at different date over a period of three months at Peenya industrial area. During study period it was observed Benzo(a)pyrene ranged from BDL to 0.0490 ng/m3,in the month of February Kongovi electroplating location has higher concentration compare to the other locations.The concentration of B(a)P reduces from February to April in all locations. B(a)P concentration showed a significant seasonal cycle during the study period with greater concentration in the month of February due to metrological factors, with conditions of low temperature and low irradiation. From March to April concentration decreased due metrological factors which were hot in summer and increase in wind speed leads to increase in dispersion and dilution.In the month of march and April dust storm results in increase of respirable suspended particulate matter but B(a)P adsorbs specially on particle size less than 10µ which may also responsible for low B(a)P concentration from march 2011 to april 2011. B(a)P levels also showed a seasonal dependence on the greater concentration in month of February. The metrological parameters are favourable for the Benzo(a)pyrene higher concentration along with industrial activity and traffic density. The results of air quality monitoring show that the pollution concentrations were variable at different sampling locations depending on the density of mobile and stationary air pollution sources and by meteorological factors. Particulate pollutants concentration exceeded the permissible standards of New Ambient Air Quality Standards (NAAQS) in all eight locations. The concentration of Benzo(a)pyrene pollutants was observed to be within permissible limits in all the eight locations as per NAAQS.The main sources of BaP around the measuring sites were mostly influenced by emission from different sources such as residential heating, industrial facilities and traffic. Generally, BaP concentrations are higher during the winter (heating period, from October to March) than during the summer (non-heating period, from April to September) period. Concentrations of BaP depend on sources strength and weather conditions. In Peenya industrial area, coal and wood combustion for domestic heating were probably major contributors to the higher BaP loading in winter. The lower BaP concentrations in the summer period in Peenya industrial area were likely influenced by higher degrees of atmospheric photo degradation and evaporation. One of the reasons that PAHs are lower during the summer is because semi-volatile PAHs are present in the gas phase in the summer due to higher temperature, while in the winter ambient temperatures are much lower. BaP was found to be a relatively unstable compound and it is questionable if it is a good indicator of total PAHs or carcinogenic PAHs[12].
4. Conclusions
- The concentration of Benzo(a)pyrene varies in the ranges BDL to 0.0490 µg/m3 which is less then permissible limit of 1 µg/m3.The Benzo(a)pyrene concentrations at all the eight sampling locations were below the permissible standards of National Ambient Air Quality Standards (NAAQS). In general, increasing / decreasing / defined trends in the concentration of Benzo(a)pyrene studied from February 2011 to April 2011 has been observed and this trend is attributed to meteorological conditions which might have resulted in dispersion/diffusion Benzo(a)pyrene concentration in the ambient air was found to be within the permissible limit. Particulate matter 10 (PM10) concentrations exceeding the acceptable limit was observed in the ambient air during February 2011 to April 2011 (130.22 µg/m3).The Peenya Industrial Area, in all the eight locations, PM10 pollutant exceeds the permissible standards. The presence of high concentration particulate pollutants has a significant negative impact on the ambient air of study area.
ACKNOWLEDGEMENTs
- The authors would like to thank the Environmental Health Safety Research and Development (EHS R&D) Lab Bangalore, India for funding analysis and evaluation of results and support program of Benzo(a)pyrene monitoring in Peenya industrial area Bangalore,India.
References
| [1] | A.Dvorska, G.Lammel, J. Klanova, I. Holoubek, 2008, Kosetice, Czech Republic Ten Years of Air Pollution Monitoring and Four Years of Evaluating the Origin of Persistent Organic Pollutants, Environmental Pollution, 156, 403–408. |
| [2] | A. Cvetkovic, M. J. Stojanovic, L. A. S. Snezana, M. Besarabic, D. A. Markovic, 2010, Seasonal Trends of Benzo(a)Pyrene in Suspended Particulate Matter in Urban Areas of Belgrade, Serbia, Chemical Industry and Chemical Engineering, 16 (3), 259−268. |
| [3] | G. Lammel , J. Klanova, J. Kohoutek, R. Prokes, L. Ries, A. Stohl, 2009, Observation and Origin of Organochlorine Compounds and Polycyclic Aromatic Hydrocarbons in the Free Troposphere Over Central Europe, Environmental Pollution, 157(12), 3264–3271. |
| [4] | H. Guo, S. C. Lee, K.F Ho, X.M. Wang, 2003, Particle-Associated Polycyclic Aromatic Hydrocarbons in Urban Air of Hong Kong, Atmospheric Environment, 37, 5307–5317. |
| [5] | G. L. Shi, Y.C. Feng, J.H. Wu, X. Li, Y. Q. Wang , Y. H. Xue, T. Zhu, 2009, Source Identification of Polycyclic Aromatic Hydrocarbons in Urban Particulate Matter of Tangshan, China, Aerosol and Air Quality Research, 9, 309-315. |
| [6] | I. M. Madany, Raveendran, 1992, Polycyclic Aromatic Hydrocarbons, Nickel And Vanadium in Air Particulate Matter in Bahrain During the Burning of Oil Fields In Kuwait, The Science of the Total Environment, 116, 281-289. |
| [7] | I. A. L.Granadillo, I. G. J.Alonso, A. S. Medel, 2000, Determination of n-Alkanes and Polycyclic Aromatic Hydrocarbons in Atmospheric Particulate and Vapour Phases in Oviedo, Spain, by GC-MS, Journal of Environmental Monitoring, 2, 218-222. |
| [8] | J. Shi1, Y. Peng, W. Li1, W. Qiu, Z. Bai, S. Kong, T. Jin, 2010, Characterization and Source Identification of PM10-Bound Polycyclic Aromatic Hydrocarbons in Urban Air of Tianjin, China, Aerosol And Air Quality Research, 10, 507–518. 13. |
| [9] | J. Duan , X. Bi , J. Tan, G. Sheng , J. Fu, 2007, Seasonal Variation on Size Distribution and Concentration of PAHs in Guangzhou City, China, Chemosphere, 67, 614–622. |
| [10] | R. Kori, P.K. Shrivastava, N. Upadhyay, 2007, Studies on Presence of PAHs in Ambient Air of Gwalior City, Journal of Applied Science and Environmental Management, 11(4), 101-104. |
| [11] | J.Y.Lee, Y.P. Kim, 2007, Source Apportionment of the Particulate PAHs at Seoul, Korea: Impact of Long Range Transport to a Megacity, Atmos. Chem. Phys, 7, 3587–3596. |
| [12] | Li. J, Zhang. G, Li. X.D, Qi. S.H, Liu. G.Q, Peng. X.Z. 2006, Source Seasonality of Polycyclic Aromatic Hydrocarbons (PAHs) in a Subtropical City, Guangzhou, South China, Science Total Environment, 355, 145– 155. |
| [13] | L.B. Liu,Y. Hashi, M. Liu, Y. Wei, J. M. Lin, 2007, Determination of Particle-Associated Polycyclic Aromatic Hydrocarbons in Urban Air of Beijing by GC/MS Analytical Sciences, 23, 667-671. 18. |
| [14] | L. Peng, Y. You, Z. Bai, T. Zhu, K. Xie, Y. C. Feng, Z. Li, 2006, Stable Carbon Isotope Evidence for Origin Of Atmospheric Polycyclic Aromatic Hydrocarbons in Zhengzhou And Urumchi, China, Geochemical Journal, 40, 219- 226. |
| [15] | L. Liberti, M. Notarnicola, R. Primerano, 2006, Air Pollution from a Large Steel Factory: Polycyclic Aromatic Hydrocarbon Emissions from Coke-Oven Batteries, Journal Air and Waste Management Association, 56, 255-260. |
| [16] | W. Xing, Y. Luo, L. Wu, J. Song, P. Christie, 2006, Accumulation and Phytoavailability of Benzo[A]Pyrene in an Acid Sandy Soil, Environmental Geochemistry and Health, 28,153–158. |
| [17] | Marchand, N., Besombes,J.L., Chevron,N., Masclet,P., Aymoz, G., Jaffrezo,J.L., 2004, Polycyclic Aromatic Hydrocarbons (PAHs) in the Atmospheres of two French Alpine Valleys: Sources and Temporal Patterns, Atmos. Chem. Phys., 4, 1167–1181. |
| [18] | L. C. Marr, K. Dzepina, J. L. Jimenez, F. Reisen, H. L. Bethel, J. Arey, J. S. Gaffney, N. A. Marley, L. T. Molina, M. J. Molin, 2006, Sources and Transformations of Particle-Bound Polycyclic Aromatic Hydrocarbons in Mexico City, Atmos. Chem. Phys., 6, 1733–1745. |
| [19] | M. J. Stojanovic, B. Alena, 2010, Current State of Particulate Matter Research and Management in Serbia, Chemical Industry and Chemical Engineering, 16 (3), 207−212. |
| [20] | P.C. Vasconcellos, D. Zacarias, M.A.F. Pires, C. S. Pool, L. R.F. Carvalho, 2003, Measurements of Polycyclic Aromatic Hydrocarbons in Airborne Particles from the Metropolitan Area of Sao Paulo City, Brazil, Atmospheric Environment, 37, 3009–3018. |
| [21] | V. A. Jouraeva, D. L. Johnson, J. P. Hassett, D. J. Nowak, N. A. Shipunova, D. Barbarossa, 2002, Differences in Accumulation of PAHs and Metals On the Leaves of Tilia_Euchlora and Pyrus Calleryana, Environmental Pollution, 120, 331 338. |