-
Paper Information
- Next Paper
- Previous Paper
- Paper Submission
-
Journal Information
- About This Journal
- Editorial Board
- Current Issue
- Archive
- Author Guidelines
- Contact Us
American Journal of Environmental Engineering
p-ISSN: 2166-4633 e-ISSN: 2166-465X
2012; 2(6): 152-159
doi: 10.5923/j.ajee.20120206.02
Isolation and Screening of Dye Degrading Micro-organisms from the Effluents of Dye and Textile Industries at Surat
 Abstract
 Reference
 Full-Text PDF
 Full-Text HTML
Mukund Chandra Thakur 1, Arif Khan 1, Hiren Doshi 2
1Dept. of Biotechnology, Ashok & Rita Patel Institute of Integrated Study & Research in Biotechnology and Allied Sciences, New Vallabh Vidyanagar, 388121, Gujarat, India
2Dept. of Pharmaceutical Chemistry; Ashok & Rita Patel Institute of Integrated Study & Research in Biotechnology and Allied Sciences, New Vallabh Vidyanagar, 388121, Gujarat, India
Correspondence to: Mukund Chandra Thakur , Dept. of Biotechnology, Ashok & Rita Patel Institute of Integrated Study & Research in Biotechnology and Allied Sciences, New Vallabh Vidyanagar, 388121, Gujarat, India.
| Email: |  |
Copyright © 2012 Scientific & Academic Publishing. All Rights Reserved.
Textile dyes have been used since the Bronze Age. They also constitute a prototype 21st-century speciality chemicals market. Effluent and soil samples were collected from textile industry at Surat. The pH, temperature, BOD, COD, Nitrate and Nitrite values were compared with the values given by the Bureau of Indian Standards. The culture medium was designed and standardized in the laboratory for the isolation and degradation of the dyes. Pure cultures were screened on the basis of colony morphology. Three different types of unique cultures were selected and named as isolates S1, S2 & S3. Out of 12 dyes used, isolate S1 showed degradation on the maximum number of dyes (five) in comparison to other isolates (isolates S2 and S3). Thus, isolate S1 was used for the further studies. The isolate S1 was used for the study of the amount of dye to be degraded. For this study Red BB dye was chosen. Because, isolate S1 showed maximum degradation on Red BB dye within less time of incubation in comparison with other dyes. Almost all isolates showed the positive results in some of the biochemical tests. Thus most of the isolates can have the capacity to produce the enzyme tryptophanase, indole production, citrate permease (citrate as carbon and energy source), catalase enzyme, degradation of glucose oxidatively as well as fermentatively, urease, gelatinase, production of acid and gas (allow to ferment lactose and/or sucrose) and fermentation of sugar, lactose, sucrose, mannitol and glucose. Total cellular fatty acids profiling has been considered to be one of the important and ideal tool for identification of microorganisms. On the basis of fatty acid profiling of isolate S1 the similarity index indicated as Bacillus cereus GC subgroup A (similarity index 0.825), B. thuringiensis sub sp. israelensis (similarity index 0.552) and for B. thuringiensis sub sp. Kurstakii (similarity index 0.511). The isolate S1 was assumed to be B. cereus GC subgroup A. Thus this isolates can be used to degrade harmful azo dyes utilized by the dye, textile, paper, ink industries etc.
Keywords: Azo Dye, Degradation, Effluent, Fatty Acid Profiling, Bacillus Cereus
Cite this paper: Mukund Chandra Thakur , Arif Khan , Hiren Doshi , "Isolation and Screening of Dye Degrading Micro-organisms from the Effluents of Dye and Textile Industries at Surat", American Journal of Environmental Engineering, Vol. 2 No. 6, 2012, pp. 152-159. doi: 10.5923/j.ajee.20120206.02.
Article Outline
1. Introduction
- The colored effluents discharged from textile processing and dye-manufacturing industries contain a significant amount of unreacted dyes. During dyeing processes, upto 15% of the dyestuff does not bind to the fibers and is therefore released into the environment[1]. The world annual production of the dyestuffs amounts to more than 7×10⁵ tonnes[2]. Azo dyes, being the largest group of synthetic dyes, constitute up to 70% of all the known commercial dyes produced[3]. Textile processing wastewaters with dye contents in the range of 10–200 mg l-1 are highly colored.The chemical structure of coloured dyes are characterized by highly substituted aromatic rings joined by one or more azo groups(–N=N–). These substituted ring structures make these molecules recalcitrant and, thus, they are not degraded by conventional wastewater treatment processes[4]. These dyes are therefore released into the environment and lead to the acute toxic effects on the flora and fauna of the ecosystem. In addition to being aesthetically displeasing, the release of colored effluents in water bodies reduces the photosynthesis as it impedes penetration of light in water[5,6]. Moreover, many azo dyes and their metabolites are mutagenic and carcinogenic[7]. A review of the mutagenicity of effluents showed that textile and other dye - related industries produce consistently more potent wastewaters when compared to other industrial discharges [8].Recent studies by Rajaguru et al.[9] and Umbuzeiro et al.[10] have shown that azo dyes contribute to mutagenic activity of ground and surface waters polluted by textile effluents. Thus, the color removal of textile wastewater is a major environmental concern. Therefore, industrial effluents, like textile wastewater containing dyes must be treated before their discharge into the environment. The dye wastewater from the textile is one of the most difficult wastewater to treat[11,12]. Because of their commercial importance, the impact and toxicity of dyes that are released in the environment have been extensively studied[13]. Colour can be removed from wastewater by chemical and physical methods including absorption, coagulation – flocculation, oxidation and electrochemical methods. These methods are quite expensive, have operational problems[14], and generate huge quantities of sludge[15]. Among low cost, viable alternatives, available for effluent treatment and decolourization, the biological systems are recognized, by their capacity to reduce biochemical oxygen demand (BOD) and chemical oxygen demand(COD) by conventional aerobic biodegradation. There is large variability in the quality of industrial effluents which varies with industrial processes. The effluents discharged by different industries contain a high range of physico-chemical parameters like temperature, pH, conductivity, hardness, alkalinity, COD, TSS, nitrates, nitrites, cations (Na+, K+, Ca2+ and Mg2+) and anions (Cl-, CO32-, HCO3- , SO42-). These effluents from different industries also contain heavy metals and trace metals including chromium, cadmium, copper, lead, nickel, zinc, cobalt, magnesium, iron and arsenic[16].The treatment systems based on using microorganisms capable of decolorizing/degrading these recalcitrant compounds are environment-friendly and can lead to mineralization of the target compounds. The effectiveness of these treatment systems depends upon the survival and adaptability of microorganisms during the treatment processes[2,17]. Many microorganisms belonging to different taxonomic groups of bacteria[2], fungi[18], actinomycetes[19] and algae[20] have been reported for their ability to decolorize azo dyes.The use of pure-culture system ensures the reproduction of data and interpretation of the detailed mechanism of dye degradation. However, higher degree of biodegradation and mineralization can be expected when metabolic activities of mixed cultures within a microbial community complement each other. The advantages of mixed cultures are apparent as some microbial consortia can collectively carry out biodegradation that cannot be achieved by pure culture[21, 22]. Azo-dyes are also degraded efficiently under aerobic conditions by wood-rotting fungi (e. g. Phanerochaete chrysosporium, Trametes spp. etc.), which are in nature responsible for the degradation of lignin[23]. While fungal treatment of dye containing effluents is usually time - consuming and difficult to control[24], the potential of enzymes for this purpose has clearly been demonstrated. Thus an effort has been made to isolate the bacteria capable of degrading the azo dyes present in the effluents of textile industries located at Surat.
2. Materials and Methods
- For present study effluent from the dye and textile industries was used. The soil samples were also collected from the same site for study of the microbial flora in the adjourning area.Nutrient media (Introduced by Robert Koch) was used with slight modification for the enrichment of the culture from the effluent and the soil samples.
2.1. Collection of Effluent and Soil Sample
- The effluent sample was collected from GIDC, Pandesara, Surat, India. The pH and the temperature of the sample were (10.3 and 24℃ respectively) measured at the time of collection. The Chemical oxygen demand (COD) was estimated by the titration of the effluent samples and found to be 7507.20 mg l-1. The Biological oxygen demand (BOD) value could not be found for the effluent samples. The value for the nitrates and nitrites was found to be 1893 mgl-1 and 70 mg l-1 respectively. The soil samples were also collected from the near bank about 50 to 100 cm far from the effluent channel by digging the soil up to 5 cm.
2.2. Isolation of Dye Degrading Microorganism
- The effluent and combination of distilled water & effluents (v/v) was inoculated in N-broth medium. To each of the flask containing 100 ml of medium 10 g of soil sample was added and incubated at 28℃ for 72 hours. Serial dilutions from 100 to 10-3 were made from the upper phase of the culture containing microorganisms for each of the medium separately. From each dilution 100 μl was spread over the solid plate medium-1(Peptone 5 g; Yeast extract 2.46 g; NaCl 5 g; Agar 20 g and pH to 7.00), medium – 2 (Glucose 30 g; KH2PO4 6 g; Na2CO3 10 g; MgSO47H2O 0.2 g; Yeast extract 6 g; Agar 20 g and pH 7.00) containing appropriate and all different dyes separately using sterile glass spreader and incubated at 37℃ for up to 100 hours. After incubation the observations for the zone of clearance/decolorization on the respective plates were made and recorded.
2.3. Selection of Dye
- There were twelve different dyes (Purple H3R, Brilliant yellow, Yellow 105, Red BB, Blue 81, Blue 171, Blue 49, G Yellow, Orange 122, Dir Black & Black 5, R 31) used in the present study.
2.4. Optimization of Concentration of Dye Degradation
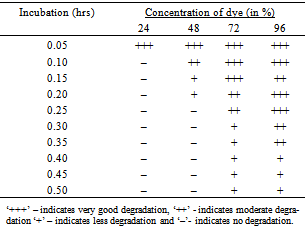
- Concentration of dye degraded by the microorganism was optimized for one dye and by isolate no.S1. The Red BB dye was taken in a concentration of 0.05 %, 0.10 %, 0.15 %, 0.20 %, 0.25 %, 0.30 %, 0.35 %, 0.40 %, 0.45 % & 0.50 % and the result was recorded.
2.5. Biochemical Tests
- Biochemical tests were performed for checking the presence of particular substance or enzyme produced by the bacterial isolate.
2.5.1. Tests for Utilization of Carbohydrates and Organic Acids
- Tests for utilization of carbohydrates and organic acids were carried out by carbohydrate fermentation test, oxidation-fermentation test, methyl red test, voges-proskauer test and citrate utilization test as per the method described by Patel[25].
2.5.2. Tests for Nitrogenous Compounds
- Tests for nitrogenous compounds was studied by performing indole production test, H2S production test, deamination test, urea hydrolysis test, nitrate reduction test and ammonia production test as per the method described by Patel[25].
2.5.3. Tests for Decomposition of Large Molecules
- Tests for decomposition of large molecules was done by starch hydrolysis test, gelatin hydrolysis test, casein hydrolysis test, catalase test and dehydrogenase test as per the method described by Patel[25].
2.5.4. Triple Sugar Iron Test
- Combined test using composite media was performed using triple sugar iron agar test as per the method described by Patel[25].
2.6. Cellular Fatty Acid Profiling Using GC
2.6.1. Sample Processing
- The pure culture was inoculated on to TSBA solid plate and incubated for 48 hours at 28℃. The culture so obtained was harvested for cellular fatty acid profiling in following steps using Gas Chromatography.
2.6.2. Harvesting
- A loop of cultured microorganism (about 40 mg of bacterial cells, cultured on TSBA plate) was taken in 13 x 100 ml culture tube.
2.6.3. Saponification
- In above harvested culture tube1.0 ml of Reagent 1 was added. The tube was tightly sealed with teflon lined caps, vortexed briefly and heated in a boiling water bath for 30 minutes. The tube was vigorously vortexed for 5 – 10 seconds at an interval of 5 minutes of entire incubation period.
2.6.4. Methylation
- After incubation the tube was cooled at room temperature, uncapped and 2 ml of Reagent 2 was added. The tube was capped again and briefly vortexed. After vortexing, the tube ware heated for 10 ± 1 minutes at 800 ± 1℃.
2.6.5. Extraction
- After methylation 1.25 ml of Reagent 3 was added to the cooled tube followed by recapping and gentle tumbling on a clinical rotator for about 10 minutes. The tube was uncapped and the aqueous (lower) phase was pipetted out and discarded.
2.6.6. Base Wash
- About 3ml of Reagent 4 was added to the organic phase remained in the tube. The tube was recapped and tumbled for 5 minutes. Following uncapping, about 2/3 of the organic phase was pipetted into a GC vial, capped and ready for analysis GC analysis.The prepared sample was analyzed by gas chromatography (Model No. GC # 6890N, Make – Agilent Technologies, Germany) at Disha Life Sciences, Ahmedabad. The GC instrument had flow rate of gases – 60 psi, capillary column (length – 25 meter, ID- 0.20) made by Methylepolysiloxane (5% phenyl), flame ionization detector, temperature slope- initial temp. 170 to 310℃, auto injector 100 vial tray.The RTSBA6 6.00 library method was used to found out the similarity index of the isolate on the basis of total cellular fatty acids profiling. The table, graph and result so obtained were recorded.
3. Results & Discussion
- The effluents sample collected had the pH nearer to the permissible range. The average and permissible pH for the effluents of azo dye industries is 9[26]. Hence, the effluents will not have adverse impact on aquatic ecosystem after being discharged. The permissible limit of BOD is 3000 mg l-1 and COD is 15000 mg l-1 as set by the Bureau of Indian Standards[27]. Wastes containing high BOD and COD are responsible for a heavy depletion of oxygen levels in the particular sector of the stream or soil[28]. The value for the nitrates (1893 mgl-1) and nitrites (70 mgl-1) was found to be higher than the permissible limit. The microorganisms present in the sewage reduce the nitrate into nitrite and then to ammonia, sulphates into sulphides and ferric iron into ferrous iron at very low concentrations of oxygen. Therefore, they create great nuisance for the environment[29]. The data for COD (7507.20 mgl-1) revealed that the effluents in present condition are fit for discharge to land/ water bodies, as it would not be hazardous for human and aquatic life due to the lower concentration of toxicants.
3.1. Isolation of Dye Degrading Microorganism
- The result of the dye degradation by the isolate is shown in figure 1(a-f). An analysis of the data reveals that out of four solid media used three did not show the degradation of dye by the growing microorganisms. All the media used differs in the capacity to support the growth of dye degrading microorganisms. The degradation was seen in the Red BB, purple H3R, BHE 81, Dir Black and blue 171 dye.In rest of the 7 dyes used were not degraded by any of the isolates obtained from the enrichment cultures. Out of the above five, Red BB was found to be degraded more by the isolates. The change in color is due to the dye utilized by the isolates. The isolates were named on the basis of colony morphology from dye degradation and were named as S1, S2 and S3. Out of 3 isolates, one isolate (S1) showed degradation on all five dyes used. Thus S1 was subjected for the further study.The growth of the culture on medium-2 could have attributed due to less concentration of glucose in the previous medium (medium-1) used. With the addition and/or substitution of the above factors the bacteria could grow on the medium plate which was conducive for the organisms. Bacterial decolorization of azo dyes under methanogenic conditions is non-specific[30].
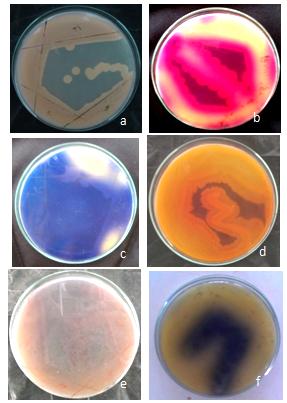 | Figure 1. a. Control; b. showing degradation with Purple H3R; c. showing degradation with Red BB; d. showing degradation with Bhe 81; e. showing degradation with Dir Black; f. showing degradation with Blue 171 |
3.2. Optimization of Concentration of Dye Degradation
- S1 isolate showed degradation of Red BB dye in varying concentration (Table 1). Out of ten different concentrations used, 0.05% concentration was degraded most efficiently within 24 hours. While 0.10% – 0.25 % concentration was degraded in 48 hours. Degradation was found after 72 hours in 0.30 % & 0.35 % concentration. Moderate degradation was seen in 0.40 % and 0.45 % concentration of dye. But the degradation was very less or meagre even after 96 hours of incubation in 0.50 %. All microorganisms have ability to grow on different medium. Hence, different types of media have been introduced for the growth of different types of microorganisms. An analysis of the result obtained for the degradation of dye shows that only five different dyes were degraded. This could have been due to the fact that the microorganisms present in the isolates might have the efficiency to degrade only five dyes but not the rest (i.e. 7 dyes) used. Studies on 4-ABS degrading strains have also shown that the all different dye degrading microorganisms are highly specific, as they can utilize only 4-ABS and not other benzenesulfonates[35]. The 2-ABS degrading Alcaligenes sp. strain O-1 can utilize two other aromatic sulfonates, benzene and toluene sulfonate, for growth. However, cell extracts of this strain can desulfonate at least six substrates[36]. This suggests the presence of highly specific transport systems for the uptake of aromatic sulfonates in these cultures. Thus the isolated bacteria may still have restricted substrate specificity. In order to test the activity for the degradation of dye, all the isolates were tested for the Red BB dye degradation. Lower the concentration higher the degradation efficiency and vice-versa pattern were obtained. The biodegradation capability of the dyes varies from organism to organism[37]. He found that out of 15 isolates 4 had the maximum decolorizing capability after 72 hours of incubation. The similar finding has also been reported by Chen et al.[2].
|
3.3. Biochemical Test
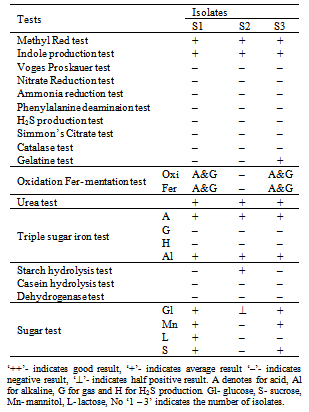
- The biochemical tests for all three isolates are depicted in Table 2. Isolate S1 showed the positive result in indole production test, methyl red test, urease test, triple sugar iron test and sugar test. Isolate number S2 showed the positive result with indole production test, methyl red test, urease test, ammonia, triple sugar iron test and sugar test. Isolate no S3 showed the positive with indole production test, methyl red test, urease test, triple sugar iron test and sugar test.
|
3.4. Cellular Fatty Acid Profiling
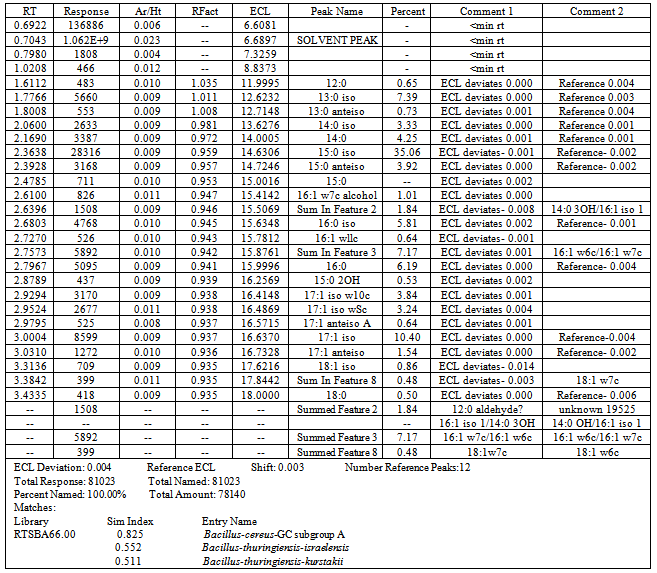
- The result of cellular fatty acid profiling for the partial identification of the isolate S1 was done using Gas Chromatographic technique and the graph is shown as table 3 and figure 7.On the basis of the data obtained the RTSBA66.00 library was used to match the probable name of the isolate. A close look to the graph and data revealed that the isolates shoed the 0.825 similarity with Bacillus cereus GC subgroup A, 0.552 with B. thuringiensis sub sp. israelensis and 0.511 with B. thuringiensis sub sp. Kurstakii.Total cellular fatty acids profiling is a reliable tool for identification of microorganisms. A close look to the similarity index revealed that isolate number S1 belongs to the B. cereus GC subgroup A (similarity index 0.825) in comparison to the rest (0.552 for B. thuringiensis sub sp. israelensis and 0.511 for B. thuringiensis sub sp. Kurstakii). Identification of several microorganisms (Pseudomonas cepacia, Candida dubliniensis, C. albicans, Prevotella intermedia, P. nigrescens, Aeromonads, B. Mycoides, Acidovorax avenae subsp. citrulli, Xanthomonas, Stenotrophomonas maltophilia etc.) have been done by cellular fatty acid profiling by the several workers of various fields like marine science[39,40], medical research[41,42], dental research[43] taxonomy[44], soil science[45], plant pathology[46,47], entomology[48] etc.
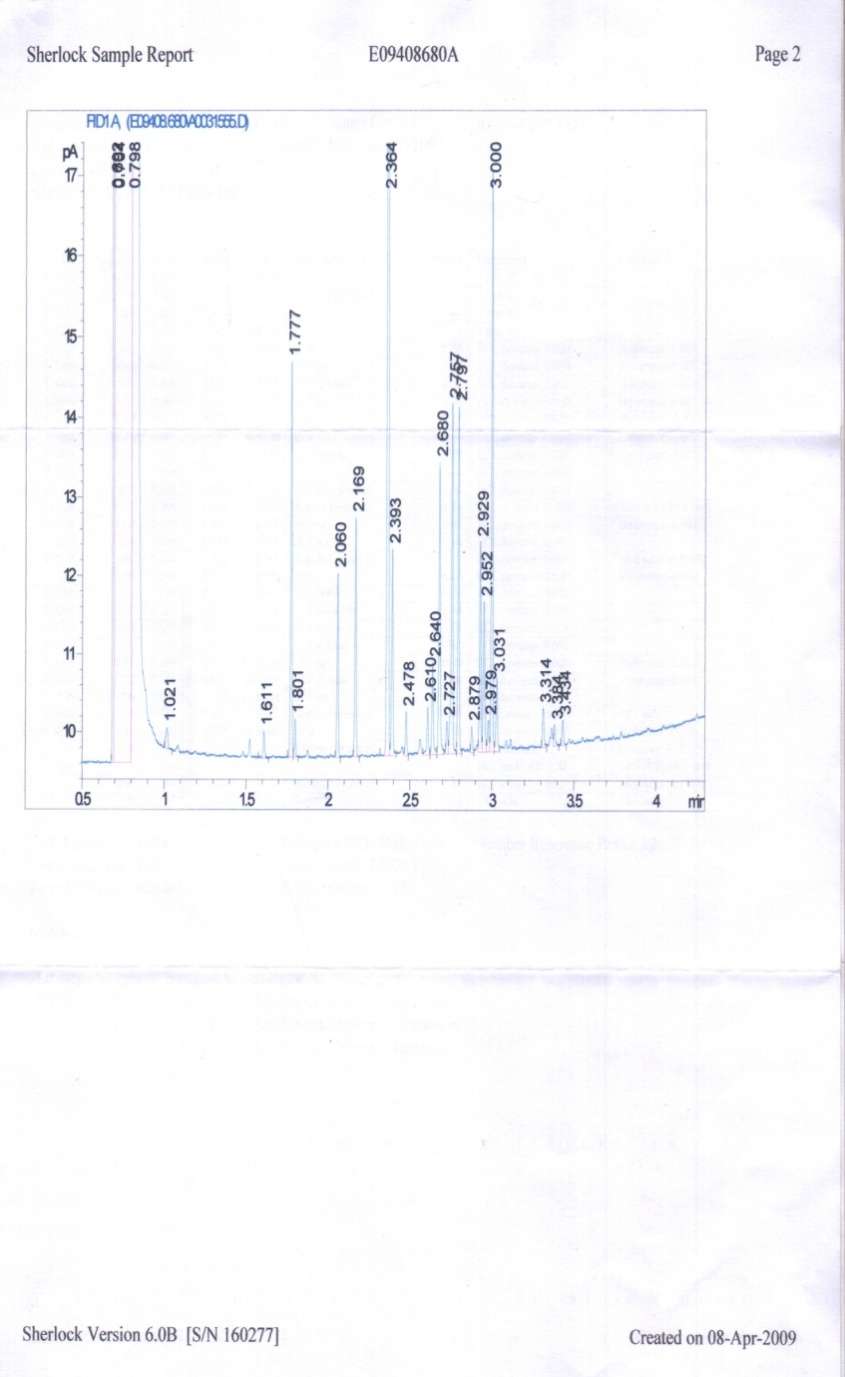 | Figure 2. GC graph showing the total cellular fatty acid profiling |
4. Conclusions
- The textile, dyeing and finishing industry use wide variety of dyestuffs due to the rapid changes in the customer’s demands. Thus by the use of the above isolates sustainable biodegradation of the harmful azo dyes utilized by the dye, textile, paper ink etc. industries can be possible. These methods are not only eco-friendly but also commercially viable even for the small scale industries. A thorough investigation, taking into consideration of certain parameters such as optimization of the dye concentration for the isolates as well as for the dye to be degraded, effect of physicochemical parameters on degradation etc. at large scale is necessary to provide unequivocal evidence for the usefulness of these isolates in sustaining dye degradation capability.
|
Acknowledgments
- We thank Charutar Vidya Mandal, New Vallabh Vidyanagar for providing facility and financial support to undertake the research work.