Cyril Nwankwo 1, Difference Ogagarue 2
1Department of Physics, University of Port Harcourt, P.M.B. 5323, Port Harcourt, Nigeria
2Department of Earth Sciences, Federal University of Petroleum Resources, P.M.B. 1221, Effurun, Nigeria
Correspondence to: Cyril Nwankwo , Department of Physics, University of Port Harcourt, P.M.B. 5323, Port Harcourt, Nigeria.
| Email: |  |
Copyright © 2012 Scientific & Academic Publishing. All Rights Reserved.
Abstract
Variations in soil temperature at depths have been investigated in different parts of Southern Nigeria. Measurements were carried out at different lithologies and at different times with the aid of a soil thermometer over a three-week period. Readings were taken in three major lithologies which include clay, sand and sandy loam. The daily soil temperature for clayey soil ranges from 27.7℃ – 28.9℃ with a simple mean of 28.3℃; 28.2℃– 29.1℃ for sandy soil and 28.3℃ – 29.0℃ for loamy soil. The mean temperature for all soil types is 28.7℃, indicating that these soils are favourable for farming. A feature of the results is that soil temperature varies more randomly in the sandy soil than the other soil types. The results can be valuable in planning and developing soil tillage practices and other agricultural activities in the areas studied.
Keywords:
Temperature Variation, Depths, Soil Types, Niger Delta
1. Introduction
Soil temperatures vary both diurnally and seasonally, the former variation fading out within a few 10s of cm and the latter at greater depths. Temperature is usually transmitted down through the earth at a rate dependent on thermal diffusivity of rocks within the soil. The transfer of heat in the soil at different thermal properties, coupled with radiations and latent heat exchanges at the surface are the primary cause of variations in soil temperature[1],[2]. Consequently, the temperature in the near sub-surface has a progressive phase shift; such that at times of minimum air temperature, ground temperatures are generally slightly higher and at times of maximum air temperatures, ground temperatures are lower[3]. At depths below about 15 m, temperatures are affected by the small amount of heat conducted upwards from the sub-surface. This creates an increase in temperature with depths which varies with the nature of the rocks and their thermal properties. Soil temperature and its variations at different depths are unique parameters useful in understanding both surface energy process and regional environmental conditions[1]. Different authors have devised different models that can be used to estimate the variation of daily average temperature at different soil depths[4],[5]. Some of such models consistently underestimate soil temperatures by about 2 degrees Celsius, and for soils that are not bare, such corrections may not be adequate since those soil temperatures are somewhat less due to shading from plants. In tropical regions like where this study is carried out, soil temperature is seldom considered a serious limitation factor.[4], remarked that temperature at the earth’s surface fluctuates constantly with season and depth, with high values being recorded during the day and low values at night. These meteorological temperature changes mainly depend on the heat from the sun. However, other factors like latitude, exposure, distribution of land and water, and vegetation can affect radiation distribution over soil surface which greatly determine the soil temperature[6],[7].If the energy absorbed by the soil causes the temperature at the surface to rise above that in the soil below; this will result to a spontaneous downward flow of heat through the subsoil. The rate of downward flow depends in part on how large a temperature difference is established between the surface and the soil below and in part on the capacity of the soil to transmit heat which also is dependent upon the composition and condition of the soil. The conduction of heat through soils results from the exchange of thermal energy between adjacent atoms or molecules in matter, principally mineral grains and the pore spaces between the grains.[8],[9] observed that such factors as air temperature, solar radiation, precipitation, soil temperature and wind effect on the environment sensed by the plant, and thus may influence the rate of the development.Since pore spaces place the greatest limitation on heat transfer through soils, anything that increases porosity tends to reduce thermal conductivity. Thus, heat conductions tend to be greater in fine texture soils of higher average porosity. Similarly, soils in which the size of pores has been reduced by compaction are better conductors of heat than when they are in a loose, highly porous state.
1.1. Geologic Setting of the Study Area
The study was carried out in Bayelsa and Rivers states of the Niger Delta, south-south Nigeria (Fig. 1). The late Tertiary-early Quaternary Benin Formation is the most predominant stratigraphic units at the locations studied[10],[11],[12]; and completely overlies the Agbada Formation. The overlying sediments are predominantly marine unconsolidated fine-medium-coarse grained cross bedded sands, occasionally pebbly with localised clay and shale. The materials range in colour from white to light brown and from yellowish, grey and dark brown to black. The study areas enjoy an equatorial climate consisting of rainy season (March – October) and dry season (November – February) each year. Rainfall in this coastal belt is heavy varying from 2400 to 4000 mm annually[13]. The only definitive border for these states is the 185 km of coastline through which its main rivers issue into the Atlantic Ocean[14]. About 6% of the rivers, creeks and estuaries in the Niger Delta are in Bayelsa State[5].
2. Objective of the Study
This study investigates how the heat radiated by the sun is distributed at different local soil depths. Knowledge of this soil temperature variation would offer advantage to farmers in the study area in selecting the particular period and depths at which farming is best efficient in different soil samples throughout the seasons. The results would also provide additional data which will aid understanding of the processes affecting regional weather and climatic conditions in the areas studied.
3. Methods
A soil mercury-in-glass thermometer was used to measure the base soil temperature profile at 15cm, 30cm, 45cm, 60cm, 75cm and 90cm depth points. Six readings were taken at three time intervals between 8 am and 11 pm (8-11 am, 1-4 pm and 9-11 pm), and the daily mean soil temperatures were calculated for each soil depth. The soil sample at each location was also carefully collected for laboratory examination. The period of study lasted for three weeks between 31st October and 17th November 2008, covering three locations in Yenegoa, Woji and Alakahia. Three different soil types – Clay, Sand and loam were tested respectively. 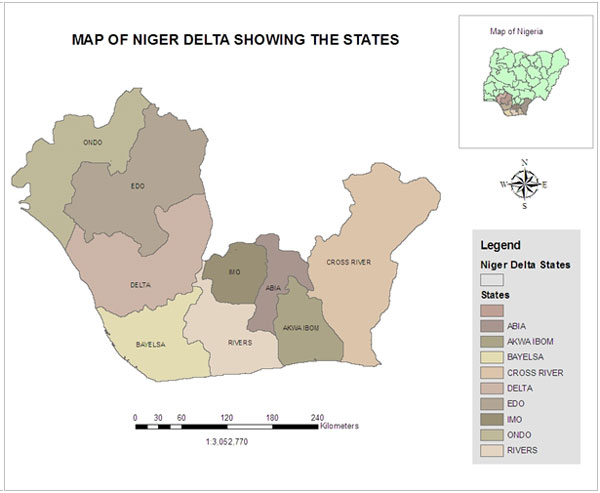 | Figure 1. Map of Niger Delta showing the component states |
The soil thermometer was calibrated prior to the measurements. To calibrate the soil thermometer, we in the first instance submerged a calibration thermometer in an ice bath, and stirred constantly for ten minutes. The calibration thermometer is then read to check if it gives readings between -0.50C and +0.5℃. Any reading within this range of temperature is acceptable. If the thermometer reads a value greater than +0.5℃, more ice is added and the process repeated. If the thermometer reads less than -0.5℃, caution is taken to ensure that there is no salt in the ice bath. Once acceptable reading is obtained, the soil thermometer is added to the ice bath. After a few minutes, both thermometers are read and of they agree to within +/- 2℃, the soil thermometer is ready for use, otherwise, the soil thermometer is adjusted to within +/- 2℃ of the calibration reading.
4. Results
The variation of soil temperature with depth at the various locations are shown in figures 2-4 while the average of the mean data for the various sediments are represented on Tables 1 -3. The variation curves generated from the recorded average mean data are shown in figures 5 – 7. 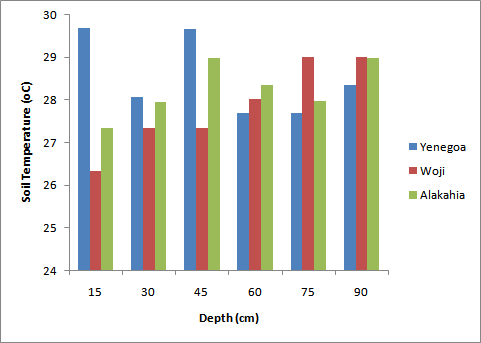 | Figure 2. Soil temperature vs Depth for measurements between 8-11 am |
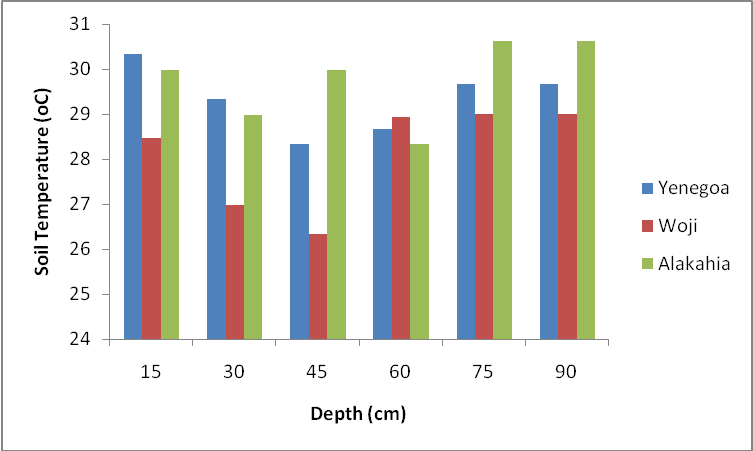 | Figure 3. Soil temperature vs Depth for measurements between 1-4 pm |
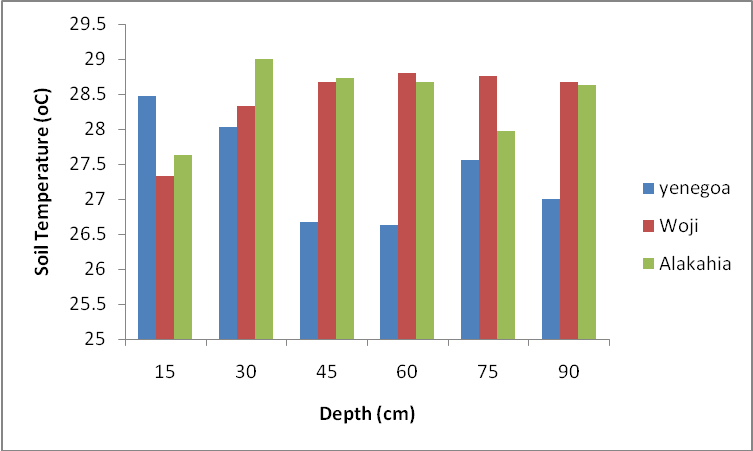 | Figure 4. Soil temperature vs Depth for measurements between 9-11 pm |
| Table 1. Average of Mean Temperature Measurement at Yenegoa (Clayey Soil) |
| | Depth (cm) | 1st Reading ℃ | 2nd Reading ℃ | 3rd Reading℃ | Average ℃ | | 15 | 29.67 | 28.47 | 28.47 | 28.87 | | 30 | 28.06 | 26.97 | 28.03 | 27.68 | | 45 | 29.66 | 26.33 | 26.67 | 27.55 | | 60 | 27.67 | 28.93 | 26.63 | 27.74 | | 75 | 27.67 | 29.00 | 27.56 | 27.89 | | 90 | 28.33 | 29.00 | 27.00 | 28.11 |
|
|
| Table 2. Average of Mean Temperature Measurement at Woji (Sandy Soil) |
| | Depth (cm) | 1st Reading℃ | 2nd Reading℃ | 3rd Reading℃ | Average ℃ | | 15 | 26.33 | 30.33 | 27.33 | 27.99 | | 30 | 27.33 | 29.00 | 28.33 | 28.22 | | 45 | 27.87 | 28.33 | 28.67 | 28.29 | | 60 | 28.22 | 28.67 | 28.31 | 28.40 | | 75 | 29.00 | 29.67 | 28.00 | 28.89 | | 90 | 29.00 | 29.67 | 28.67 | 29.11 |
|
|
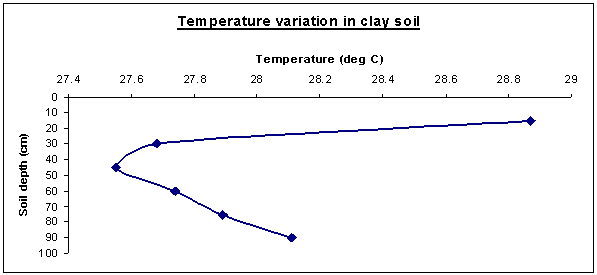 | Figure 5. Temperature variation in Clay Soil |
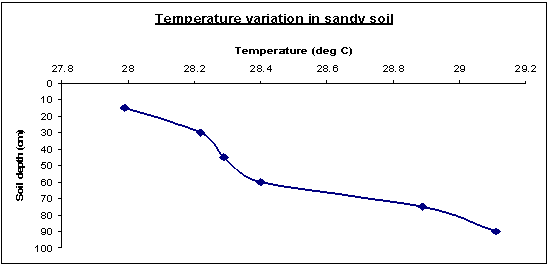 | Figure 6. Temperature variation in Sandy Soil |
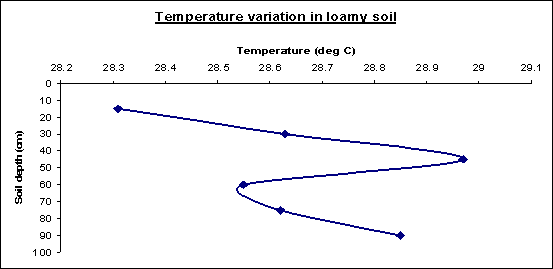 | Figure 7. Temperature variation in Loamy Soil |
| Table 3. Average of the Mean Temperature Measurement at Alakahia (Loamy Soil) |
| | Depth (cm) | 1st Reading℃ | 2nd Reading℃ | 3rd Reading℃ | Average℃ | | 15 | 27.33 | 29.97 | 27.63 | 28.31 | | 30 | 27.93 | 28.97 | 29.00 | 28.63 | | 45 | 28.97 | 29.27 | 28.67 | 28.97 | | 60 | 28.33 | 28.33 | 29.00 | 28.55 | | 75 | 28.12 | 28.28 | 29.46 | 28.62 | | 90 | 28.97 | 28.95 | 28.63 | 28.85 |
|
|
5. Discussion of Results
The Clay soil, where measurements were taken in Yenegoa is light in colour, wet and very sticky. It was observed that the clay soil temperature decreased with increasing depth and thereafter started to increase with increasing depth (Fig. 2). This can be attributed to the fact that temperature functions are greatest at the surface than at the deeper subsoil. Clay soil does not have much pores and holes in them and so penetration of air through clay is impeded. As a result, there would be more heat loss near the soil surface than the deeper subsoil. Also, some of the heat energy received from the sun is radiated back at the near surface because of the light coloured nature of the formation. The inner layers therefore retain more heat than the outer layer.The sampled sandy soil group include all soils of which the sand separates make up 70 percent or more of the materials by weight. The colour of the investigated sand is dark brown. The temperature measurements in this formation tend to increase with increasing depth (Fig. 4). This is stemmed from the fact that with pores and holes that are common with sandy formation, there is an easy permeation of radiant heat absorbed from sunlight and air at the soil surface to the bottom. The investigated loamy soil is dark in colour with about equal proportions of clay and sand but less proportion of silt. The measured temperature is seen to increase with depth from the surface up to about 45 cm depth, then decrease and increase again with depth in the measured sample (Fig. 4). One can easily assert from this behaviour that the surface layers vary more or less according to air temperature and therefore exhibits a greater fluctuation than the subsoil. Downward penetration of heat in a highly compacted soil like loamy soil is gradual, while upward movement of heat is hindered. Hence the heat received from the surface soil is held within the soil for a long time thereby increasing the temperature of the surface. The variation of soil temperature with depth in loamy soil is therefore not continuous; it varies at different depths due to variations of different soil materials making up this soil lithology. Soil temperature has an effect on the environment sensed by the plant, and may influence the rate of the development. Generally, crop yield rises with soil temperature increase to a point and decreases with further increase in soil temperature.
6. Conclusions
It has been observed that the soil temperature varies randomly as a result of considerable different characteristics possessed by different soil types. The more pores are present in the soil materials, the higher the variation in temperature. The mean soil temperature for the different soil types range from 27.7℃ to 28.9℃ for clay soil, 28.2℃ to 29.1℃ for sandy soil and 28.3℃ – 29.0℃ for the loamy soil.[15] has reported that the optimal soil temperature range for maize growth in the tropics lies between 25℃ and 34℃. The temperature values obtained for the individual soil types thus indicate that the areas studied are favourable to agricultural activities. However, farmers in Woji (Sandy soil), should device good farming practices by protecting their soils from direct heat of sun in order to reduce radiation from the surface soil. The results obtained from this study would enhance soil temperature prediction and improve on the planning and execution of agricultural projects.
ACKNOWLEDGEMENTS
The authors are grateful to Mr Prezi Samuel for his immense effort and contribution in the acquisition of the data and to an anonymous reviewer whose contribution and criticism helped in improving the quality of this paper.
References
| [1] | Hu, Q.S. and Feng, S., 2002. A daily soil temperature dataset and soil temperature climatology of the contiguous United States, submitted to Journal of Applied Meteorology, Sept., 2002. |
| [2] | Hugh, D.Y. and A.F. Roger. 2004. University Physics. 11th edition. Pearson Education. |
| [3] | Natural Environmental Research Council (NERC), 2011. Temperature and Thermal Properties (Detailed). British Geological Survey report No: GR_999999/1, 1-7. |
| [4] | Chiemeka, I.U. 2010. Soil temperature profile at Uturu, Nigeria. Pacific jour. Of science and Tech. 11(1):478-482. |
| [5] | Alfa, J.T and Anaele, C.M. 2010. Seasonal variation of resistivity and soil temperature in Bayelsa State. American journ of Engineering and Applied Sciences, 3(4): 704-709. |
| [6] | Barer, L.D. 1972. Soil Physics. Freeman Copper and Co. 253-280. |
| [7] | Banton, O., Seguin, M.K. and Cimon, M.A., 1997. Mapping field scale physical properties of soil with electrical resistivity. Soil Sci. Soc. Am. J. 61, 1010-1017. |
| [8] | Hickin, R.P. and M.T. Vittum. 2009. Department of Seed and Vegetable Sciences. New York State Agricultural Experiment Station, Cornell University: Geneva, New York, NY. |
| [9] | Abdullahi, M.M., N.B. Ali and K.B.H. Ahmed, 2010. Elapse time factor on induced vegetative moisture uptake in an unsaturated soil. Am. J. Eng. Applied Sci., 3: 597-603. http://www.scipub.org/fulltext/ajeas/ajeas34597-603.pdf. |
| [10] | Nwankwo, C.N. and Igboekwe, M.U. 2011. The Mineral Effects of Sedimentary Layers on Groundwater in Choba, Rivers State, Nigeria. The IUP Jour. of Environ. Sciences, V(2):20-27. |
| [11] | Ehirim, C.N. and Nwankwo, C.N, 2010. Evaluation of aquifer characteristics and groundwater quality using geoelectric method in Choba, Port HarcourtArchives of Applied Science Research, 2010, 2 (2):396-403. (http://scholarsresearchlibrary.com/archive.html). |
| [12] | Nwankwo, C.N and Ogagarue, D. O., 2011. Effects of gas flaring on surface and groundwaters in Delta State Nigeria. Jour. Geol. and Mining res. 3(5): 131-136. |
| [13] | Oteri, A.U. 1984. Electric logs for groundwater exploration in the Niger Delta. Challenges in African Hydrology and Water Resources (Proceedings of the Harare Symposium. IAHS 144, 87-94. |
| [14] | Alagoa, E.J. 1999. The land and people of Bayelsa State:Central Niger Delta. 1st edn. Onyoma research publication, Port Harcourt. 411. |
| [15] | Lal, R. 1974. “Soil Temperature, Soil Moisture, and Maize Yield from Mulched and Unmulched Tropical Soil”. Plant and Soil. 40(1):129-143. |
 Abstract
 Reference
 Full-Text PDF
 Full-Text HTML