-
Paper Information
- Next Paper
- Paper Submission
-
Journal Information
- About This Journal
- Editorial Board
- Current Issue
- Archive
- Author Guidelines
- Contact Us
American Journal of Environmental Engineering
p-ISSN: 2166-4633 e-ISSN: 2166-465X
2012; 2(4): 69-79
doi: 10.5923/j.ajee.20120204.01
Application of Geographic Information System (GIS) in Accuracy Assessment of Existing Land Use Map a Case Study of Enugu Area, South-Eastern Nigeria
 Abstract
 Reference
 Full-Text PDF
 Full-Text HTML
Onunkwo-A A 1, Nwankwo G. IUzoije A. P 1, 2, Okereke C. N 1
1Department of Geosciences, Federal University of Technology, Owerri , Nigeria
2Department of Environmental Engineering, School of Engineering Technology. Federal university of technology, Owerri Nigeria
Correspondence to: Onunkwo-A A , Department of Geosciences, Federal University of Technology, Owerri , Nigeria.
| Email: |  |
Copyright © 2012 Scientific & Academic Publishing. All Rights Reserved.
It is suspected that continuous building collapses within Enugu area is due to faulty landuse map. This work aims at employing geographic information system principles to assess the validity of the existing landuse map of Enugu area. Three landuse options were considered (Industrial, residential and waste). The study was undertaken using Arc view 3.2a academic, Excel Statistical Software and autocard software of GIS. A total of 12 landuse determinants were selected as thematic data layers and basic factors influencing the choice of industrial, residential and waste disposal landuses. Soil characteristics and geology were integrated into the thematic maps to facilitate the weighting of the basic determinants. The thematic layers were weighted on a scale of 0% - 100% and 0-2 inclusive, using the criteria obtained from field work and laboratory investigation. The thematic layers for each landuse were subjected to overlay using arc view software overlay model builder. The operation yielded three (3) different landuse maps (Industrial, residential and wasted disposal,) which were further superimposed to produce a composite landuse map useful for regional and urban planning. Correlation with existing landuse map, exposed a lot of limitations of the existing landuse map. All the residential and industrial areas of the existing landuse map fall within the low capacity areas of the present study. Areas selected as open space by the existing landuse map correspond to the areas of industrial and residential land uses of the present study. Areas limited for use by the present study due to hazards of flooding, landslide, fault and gully erosion were not considered by the existing landuse map, rather they were mapped out for industrial, residential and partly as open space. The existing landuse map has no provision for waste disposal. The present study shows that areas to the West, Southwest and Southeast are highly suitable for industrial and residential landuses. The limitations of the existing landuse map exposed by the present study must have accounted for the cases of building collapses in the area.
Keywords: Landuse, Assessment, Comparism, Accuracy, Geographic Information System
Article Outline
1. Introduction
- Most collapsed buildings and other civil engineering structures can be attributed to faulty existing landuse map (Chapin, 1965). According to Hord and Brooner (2000), Igue, 2005, landuse data forms the basis of environmental planning. From the work of Rose Field et al (2005), error in landuse map can originate in several ways such as error in thematic classification both by omission and commission. Further error can be introduced by improper sampling and interpretation of statistical findings (Van Genderen et al 1978) Fitz and link (2008). According to Rose Field et al (2005), Hord and Brooner (2000), landuse map accuracy assessment can be handicapped by limitations in field veryfication procedures, due to assess to sample points. There is a chance that interpretation of landuse map will not be equivalent between the map producer and those performing the map accuracy assessment. (Richards 2005). Congalton (1991), observed that global positioning system units (GPS) could help in assessing variability encountered in assessing sample points. Foody (2002), Holland (2003) Foody and Boyed (2003), noted that error in landuse maps may occur due to differences in time when the images were captured in the case of satellite data. Cloud cover may affect precision of image, especially in the tropics. Jensen, 2006, Lile Sand and Keifer 2000, Congalton 1991, Foody 2002, proposed validation method of map accuracy assessment. Validation requires information on the true condition of landuse throughout the study area. Information can come from two sources, namely: ground thruthing and reference data(Davis and Roggers, 1975). According to Pontius, (2000), field work is an essential ingredient of landuse map accuracy assessment. During the process, on the ground information can be used directly for validation. The validation data is digitized into map with its accompanying attribute table, then the validation sample map is overlaid on top of the landuse map (Kang 2002, Story and Cochram 2007). The existing landuse map of area was produced by Eco International consultants Limited. It is the reference landuse map of Enugu area today Onunkwo-Akunne and Uzoije (2011). The authors further noted that colpasing of building structures within Enugu area is likely due to the present landuse map of the area, which may be faulty.
2. Objective
- This work therefore aims at assessing the accuracy of existing landuse map of Enugu area by overlaying the existing landuse map with the landuse map resulting from this study and noting the deviations. This would offer a sustainable solution to this environmental problem(Stroke 1985).
3. Materials and Methods
3.1. Description of Study Area
- The study area is located between latitudes 6° 16' N and 6° 31' N and Longititude 7° 20' E and 7° 41' E covering an areal extent of about 630km2 (Fig 1)The study area is also located within the rain forest-belt of Nigeria and has annual rainfall of about 1100mm a year, (Iloeje 1981). The most stricking feature within the study area is Enugu –Awgu , cuesta formed by the resistant sandstones of Mamu Formation. Drainage system is controlled by the escarpment as the Enugu-Awgu escarpment forms the most important water shed separating the cross river drainage system to the east from a net work of streams flowing west wards towards the Anambra drainage basin (Ofomata, 1985). Egboka, (1993), described the drainage system as dendritic. Geologically, the study area lies in the Anambra basin of South-eastern Nigeria. The basin is of cretaceous to tertiary age (Reyment, 1965, Murat, 1972). Five formations underlie the area namely Ezeaku Formation ( Turonian) Awgu Ndiabo shale (Santonian), Nkporo Formation (Campanian-Maastrichtian), Mamu Formation (middle Maastrichtian) and Ajali Sandstone (late Maastrichtian). While Ezeaku Formation is the oldest in the area, Ajali Formation is the youngest(Amojor 1987). The stratigraphic succession and geology of the area is shown in table I and fig. 2.
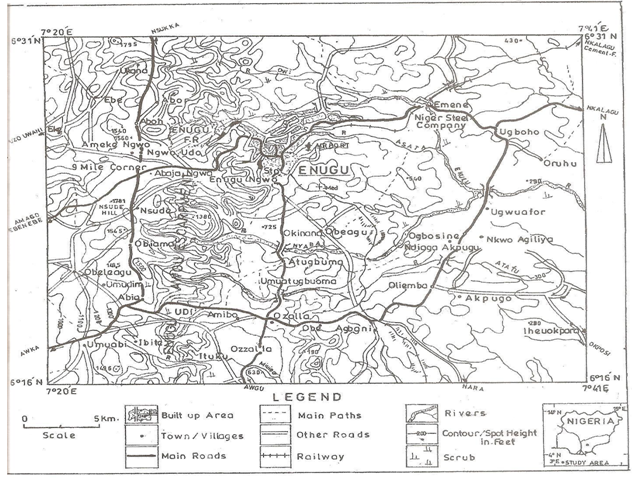 | Figure 1. Topographic Map of the Study Area |
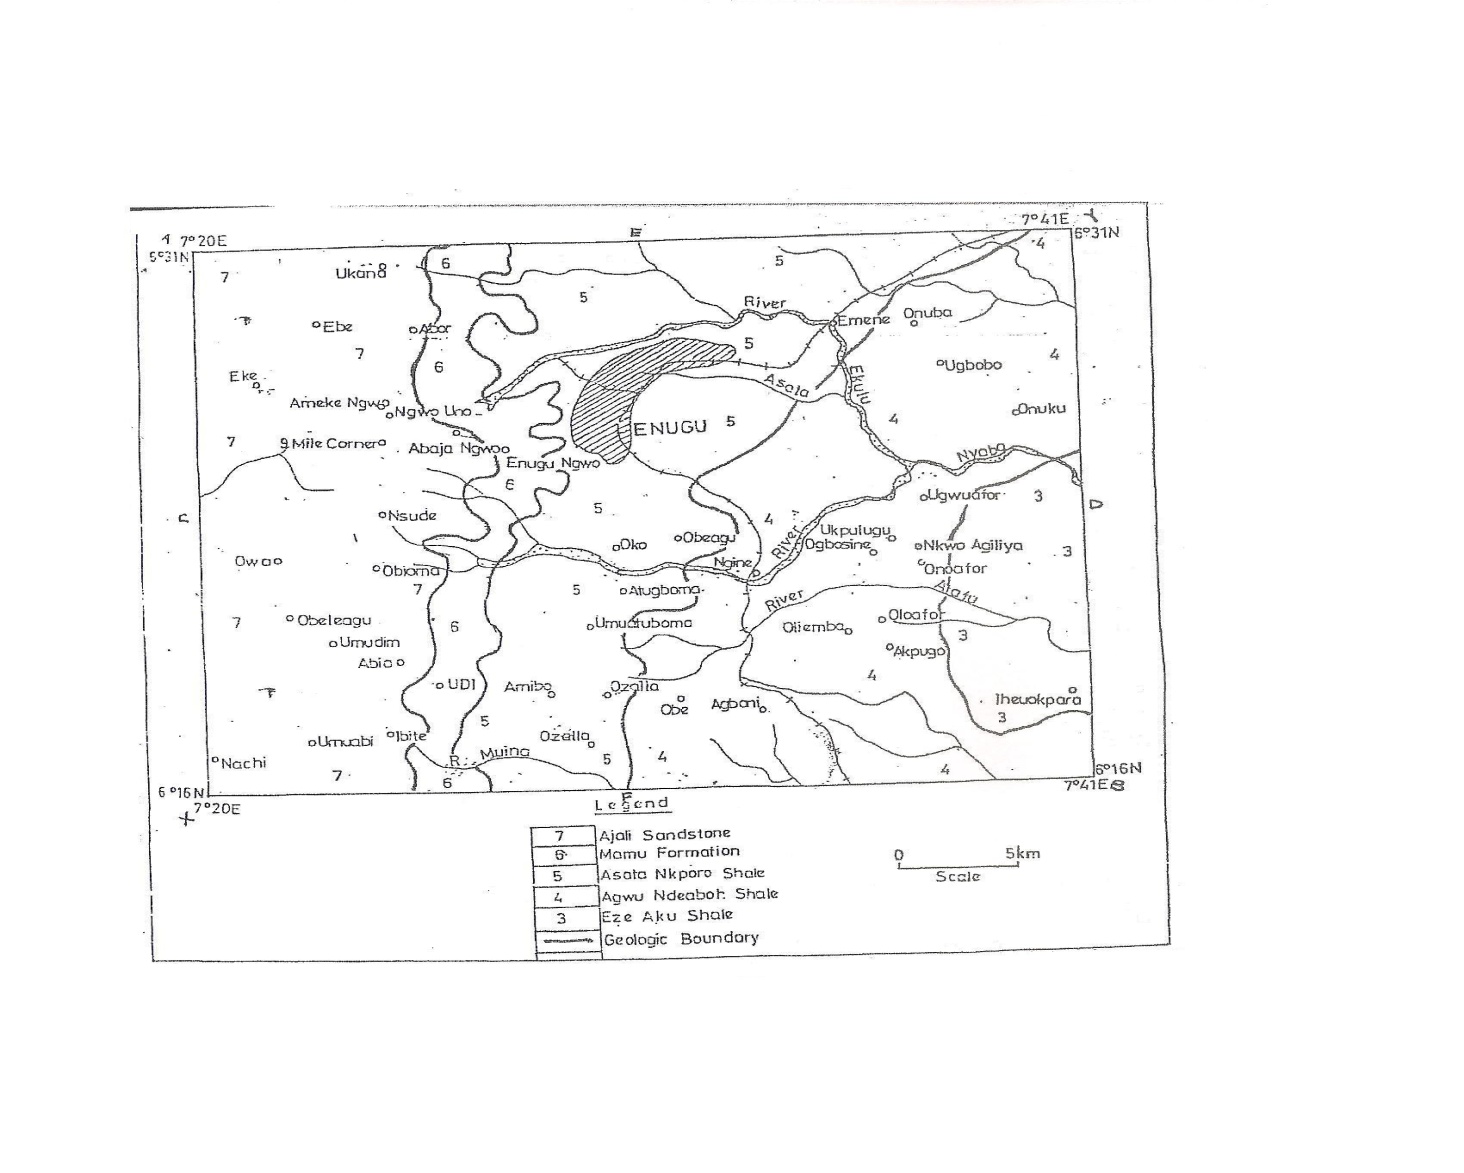 | Figure 2. Geological Map of the Study Area |
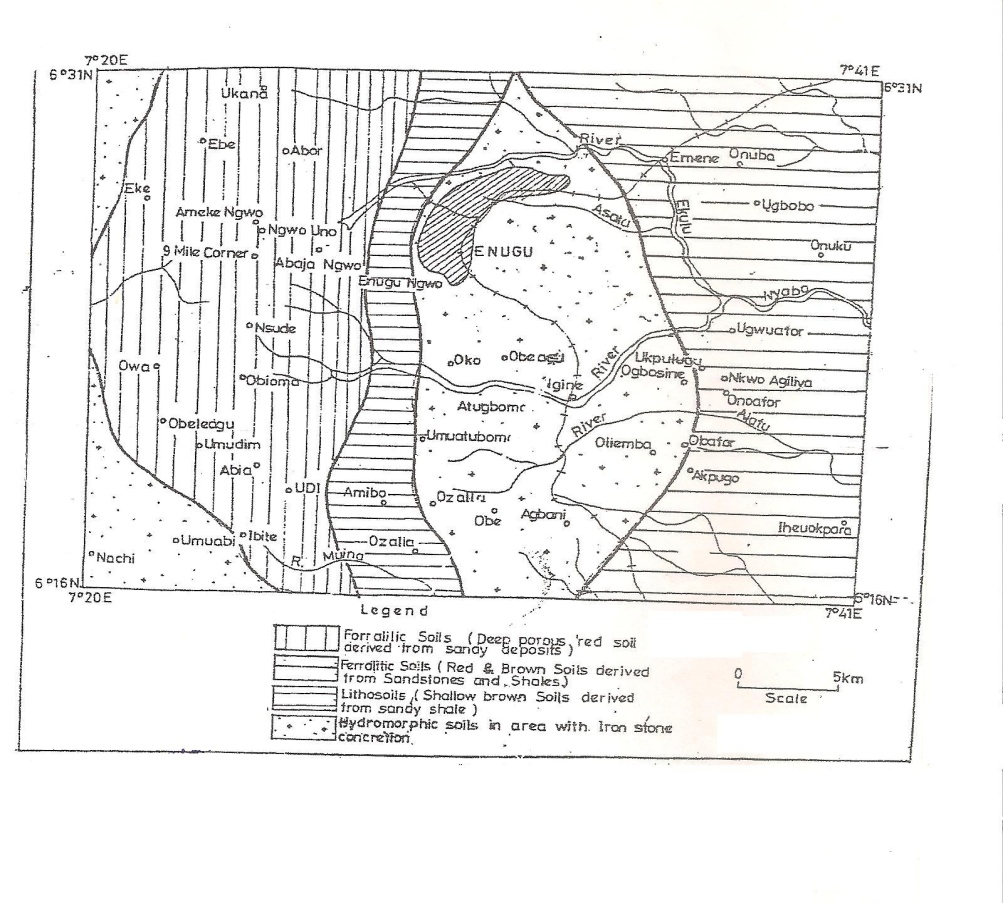 | Figure 3. Soil Map of the Study Area |
3.2. Sampling Techniques and analytical Methods
- These soil samples were collected at Owa, Ngwo, Ugwuafor, Agbani and Enugu Township from pits dug at a depth of 5 meters using auger. They were placed in polythene bags, and transported to laboratory for analysis. Method of random sampling was adopted in which 6 (six) soil samples covering the entire soil types of the area were collected. The collected soil samples were subjected to the following analysis using specified equipments. Atterberg limits, using Cassagrande apparatus), particle size distribution, using British electric shaker machine, porosity and permeability using permeameter, consolidation settlement using consolidometer, shear strength, using triaxial shear box and finally compressive strength. Analysis were done using ASTM D, 4318-98(2000) and ASTM, 1988 standard specifications. All analytical procedures are shown in (Robert et al 2001). 12 (Twelve) thematic maps of the landuse determinants within Enugu area obtained from different sources were employed in the work. These include, slope map, elevation map, soil depth map, soil class map, geologic map, drainage map, surface water map, depth to water table map, soil erosion map, flooded / landslide map, fault map and escarpment map. These maps are the thematic data layers for GIS operation. The equipments used for GIS analysis include integrated land and water information system (ILWIS), arcview 3.2a academic, Geographic Positioning System (GPS, eterex 76), excel statistical software, autocard software and geocal. The thematic maps were converted to GIS compatible format by scanning, digitization, georeferencing, projection, polygonization and conversion to common scale of 1:10,000; They were then saved in different layers for GIS analysis. Field and laboratory studies were further carried out to complement and update the details in the thematic maps and also helped in taking decision during the rating processes.
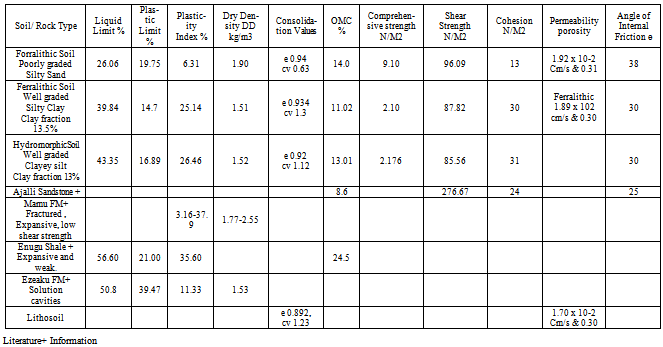
4. Results and Discussion
- The average results of laboratory, filed and literature studies are shown in table 2. The table is a reference guide in the rating of the basic determinants of landuse factors. From the table, while the forralithic soil is poorly graded the hydromorphic and ferralithic soil are well graded. Forralithic soil and lithosoil tilt towards Sandyclay that of ferralithic and hydromorphic soils tilt towards silty clay. Soils that tilt towards sand have high shear and compressive strength , while those tilting towards silt have high attenuative power in handling waste effluents , ( Gauley and Krone (1966) Krynine and Jude, (1957). The result shows that while the clay fraction of hydromorphic soil is 13%, that of ferralithic soil is 13.5%. From these, the activity indices of ferralithic and hydromorphic soils were calculated to be 1.86 and 2.04, while their liquidity indices, were calculated as -0.23 and -0.40. this was obtained using the relation according to Robert et al(2001):
 | …………(1) |
 | ………(2) |
4.1. Overlay Procedure: The Themes were Overlaid Starting from Theme I To 12 For Each Landuse Option As Shown in Figs 4, 6 and 8 Using a Model Builder of Arch View
|
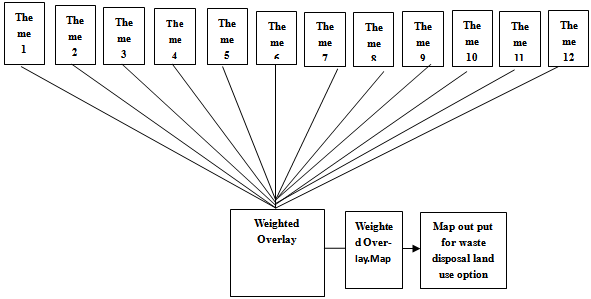 | Figure 4. Overlay Suitability procedure for waste disposal land use option |
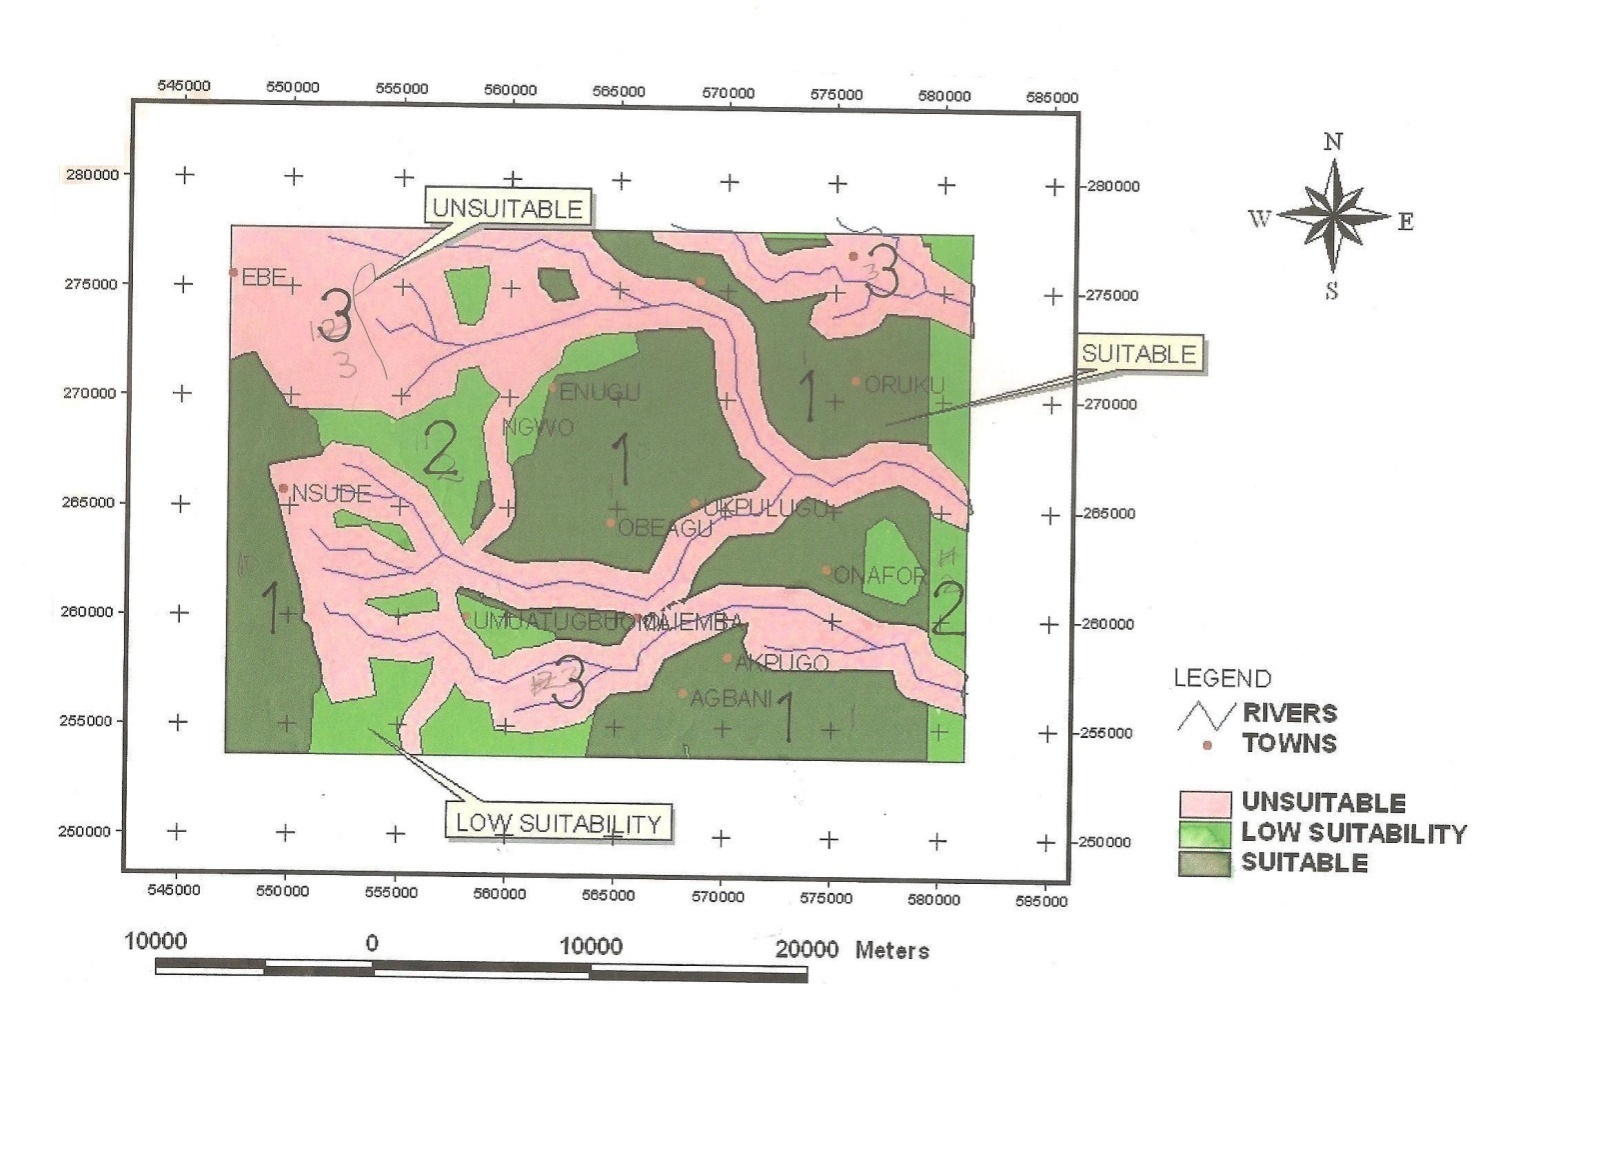 | Figure 5. Suitability Map for Waste disposal landuse |
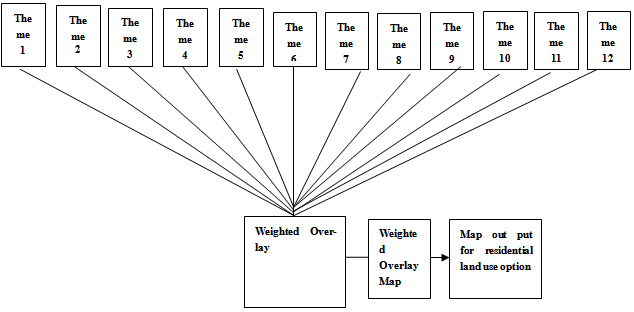 | Figure 6. Overlay Procedure for Residential landuse option |
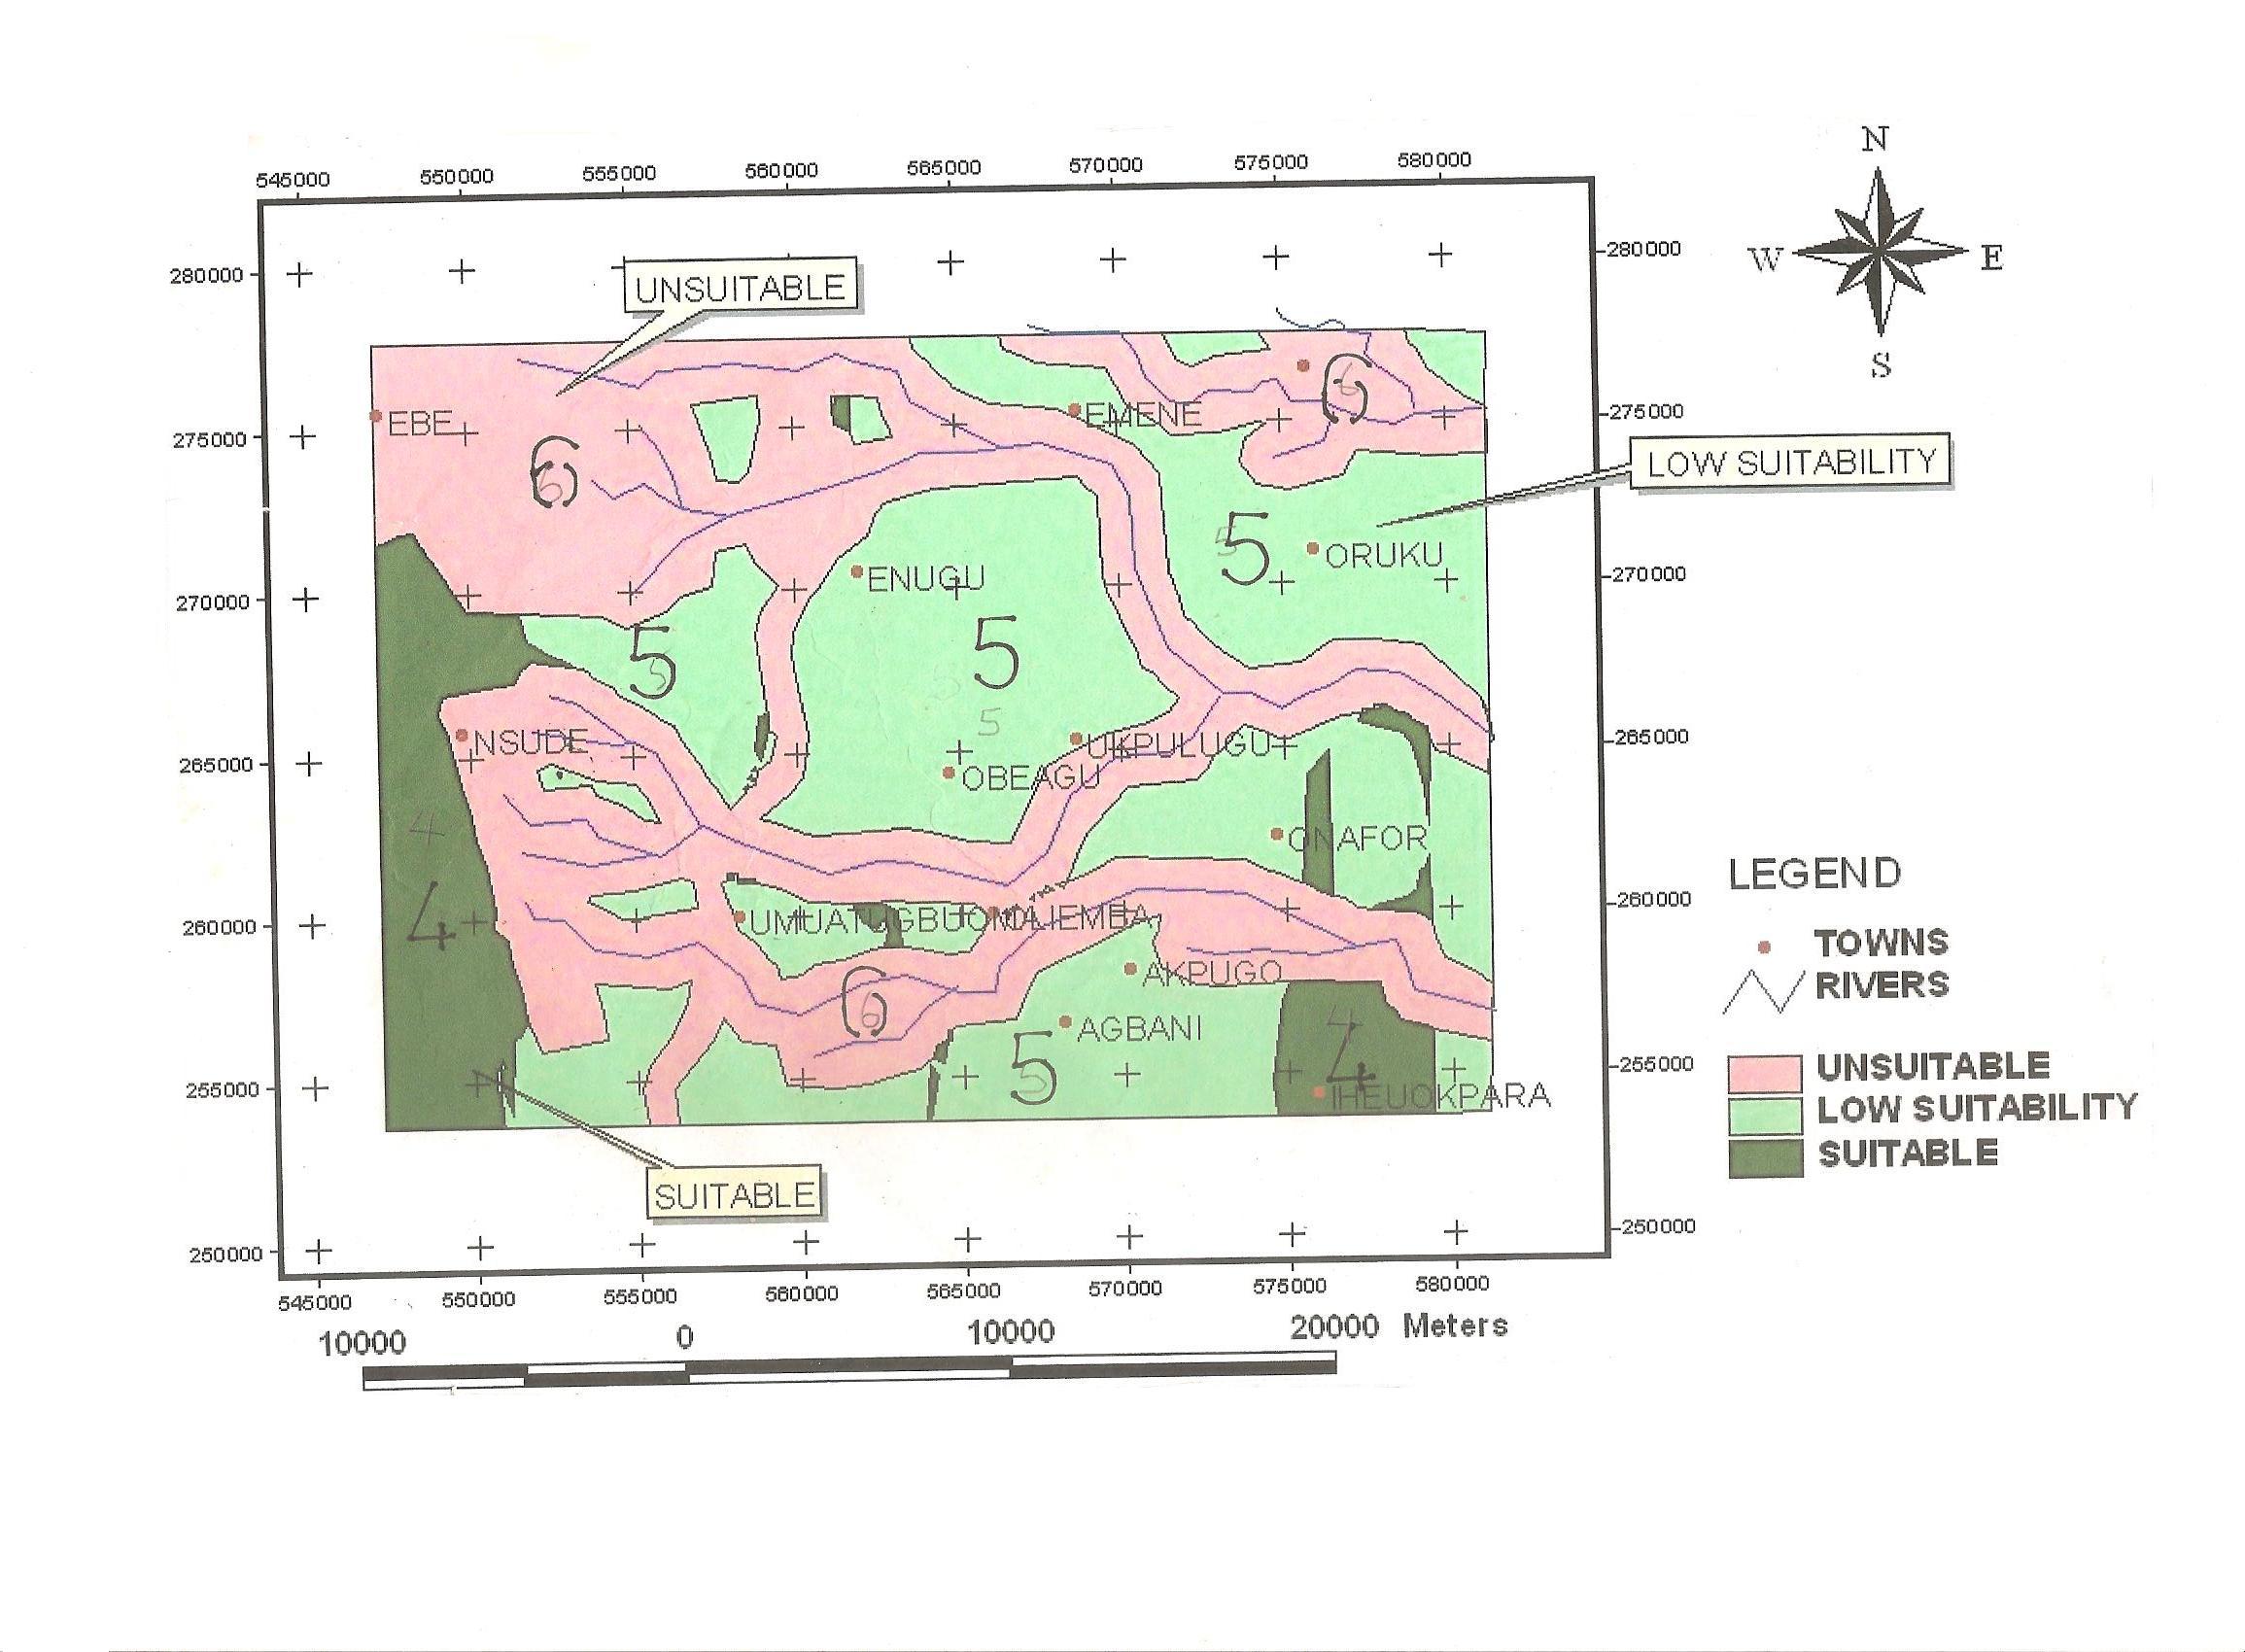 | Figure 7. Suitability Map for Residential Landuse |
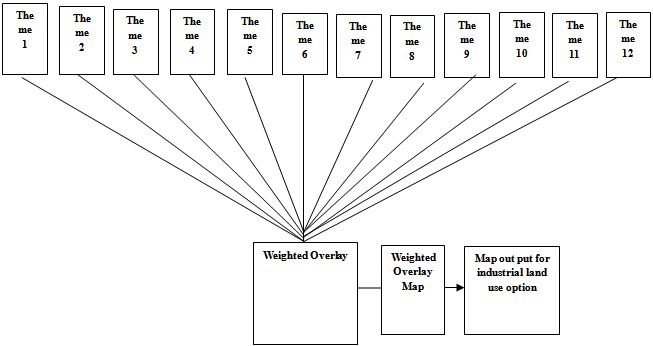 | Figure 8. Overlay procedure for industrial landuse option |
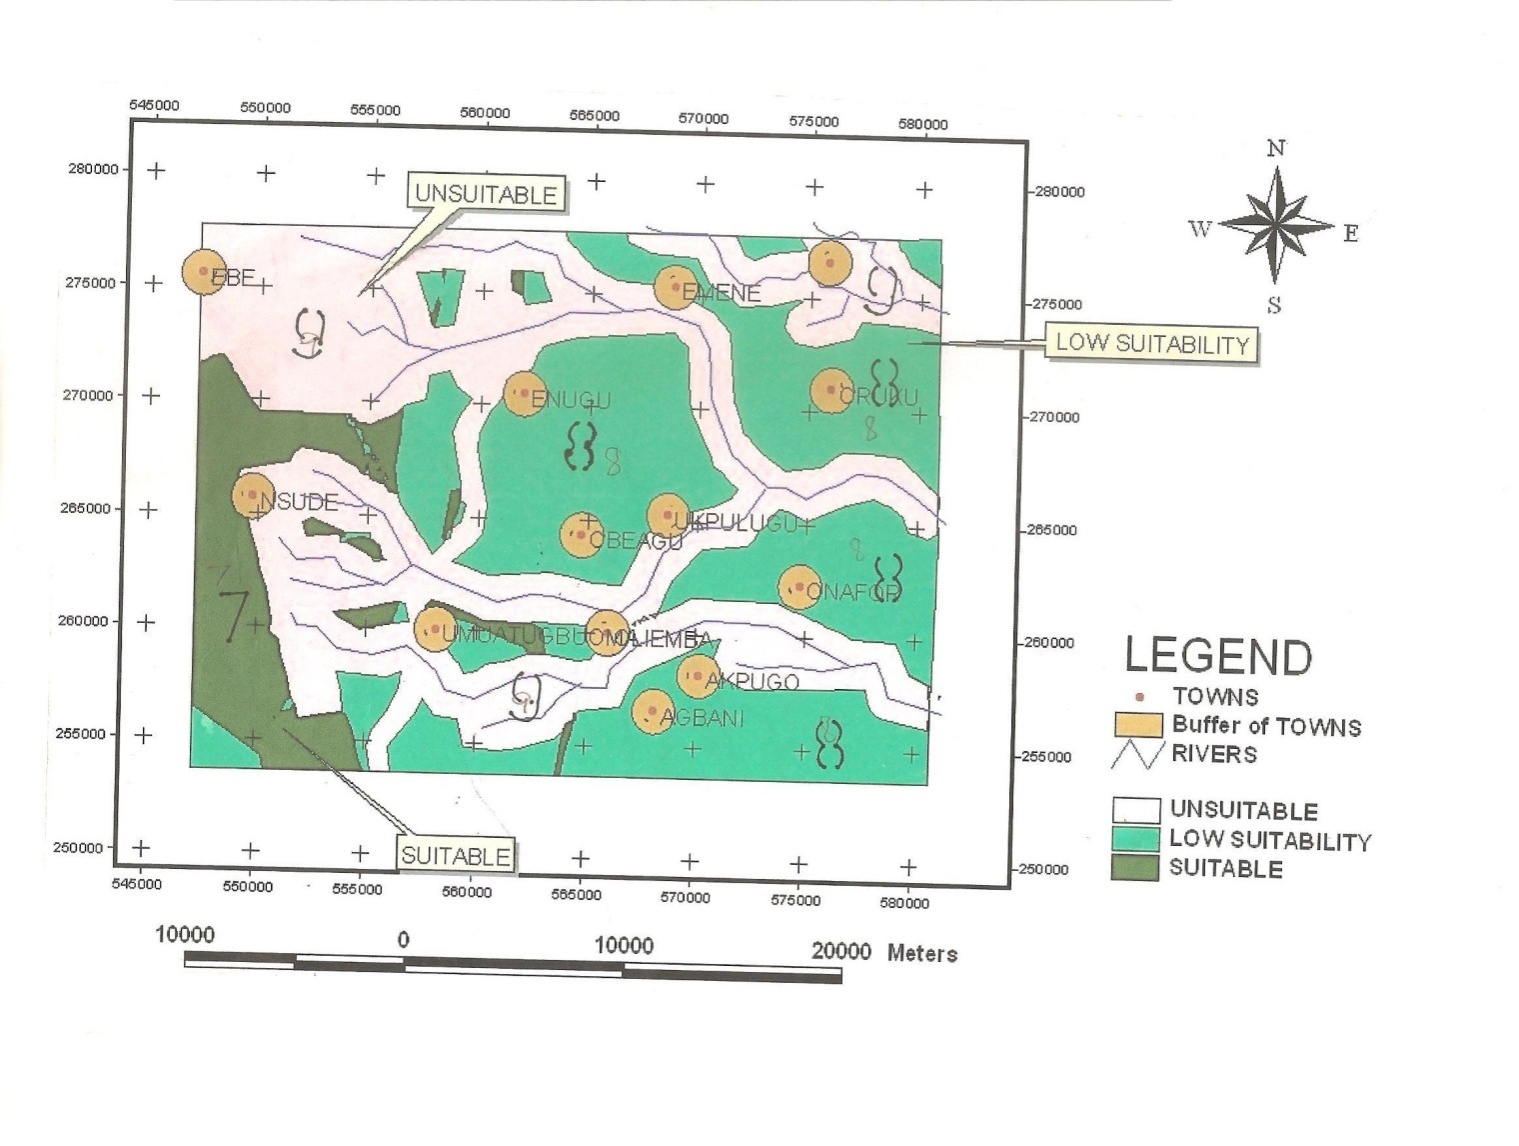 | Figure 9. Suitability Map for Industrial Landuse |
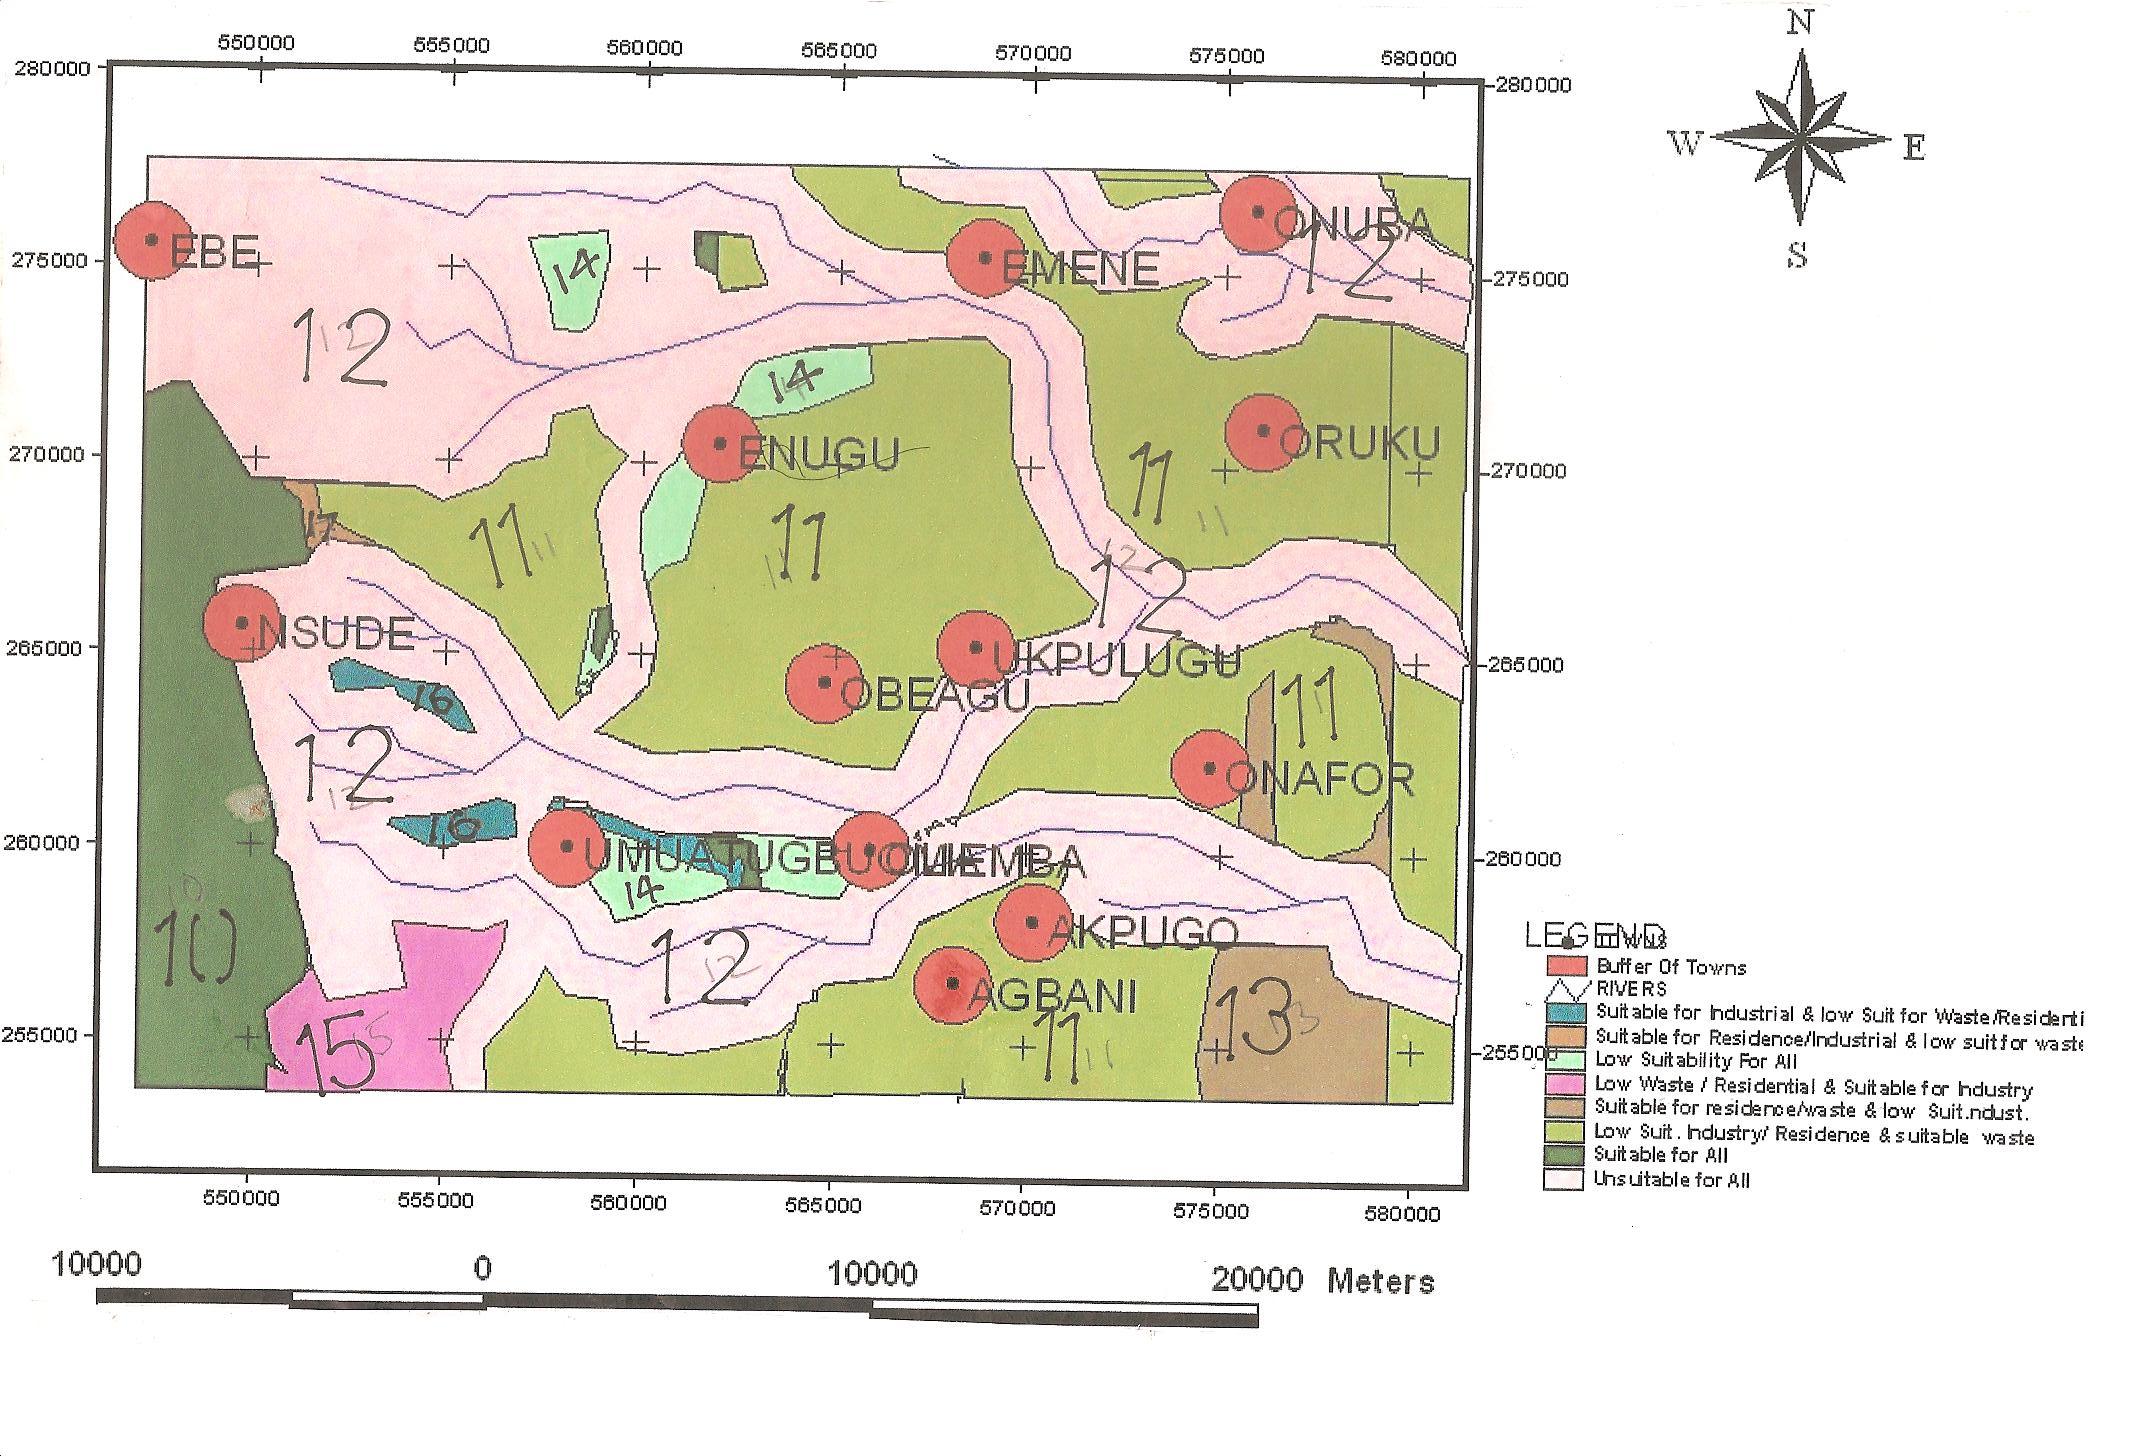 | Figure 10. Composite Landuse map ( Waste, Residence and Industry) |
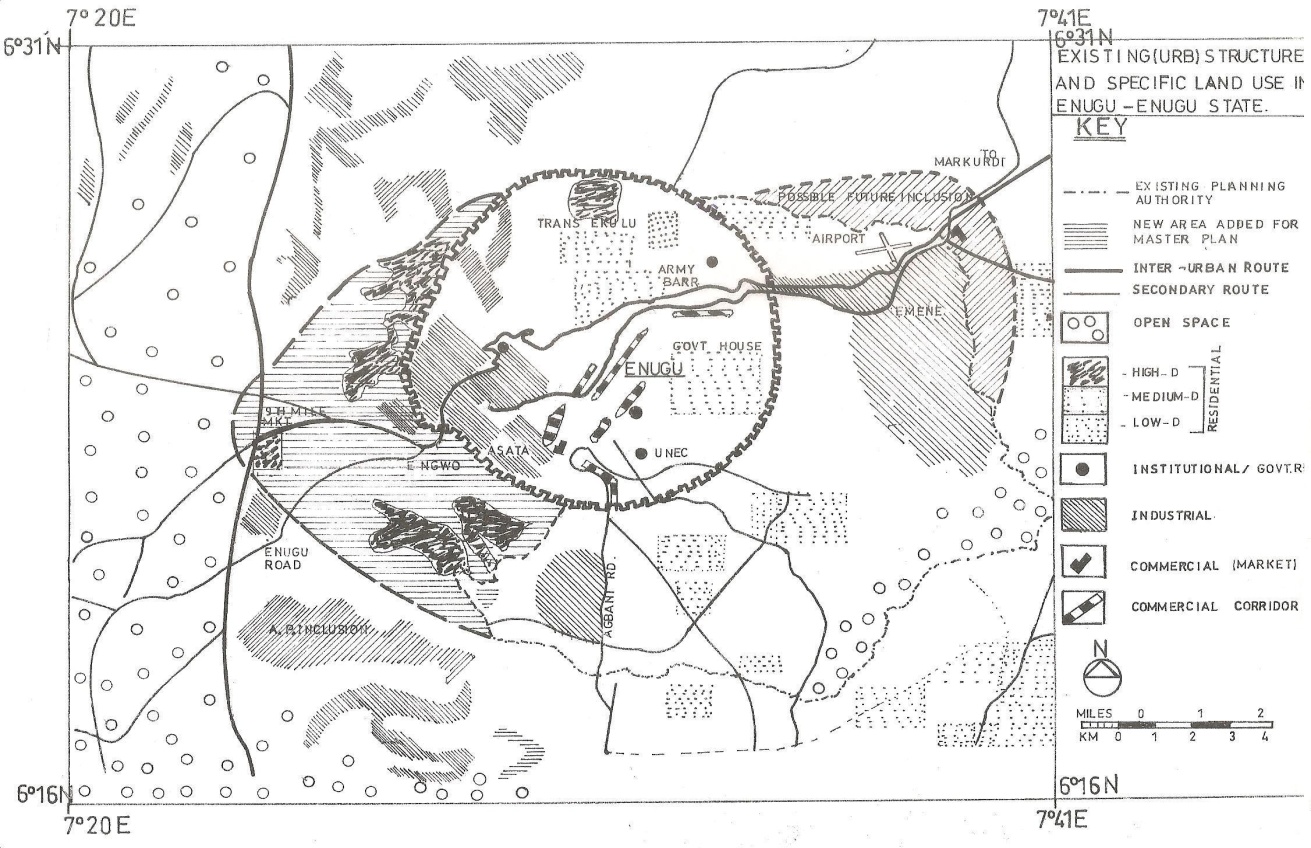 | Figure 11. Extisng landuse map of Enugu area and Environs |
4.2. Existing Landuse Map of Enugu Area and Environs (Description)
- The present landuse map of Enugu area is shown in figure 11 . The map drawn on a scale of 1:125000 shows areas mapped out for industrial and residential landuses without provision for waste disposal. The residential zones comprise areas within the northern, central, western and to some extent southern and south eastern segments of the landuse map. The areas include township, Ngwo axis, and nineth mile corner in the west. Areas reserved as open space are found in the west and southeast. The western section comprises Owa, Nachi and environs, while the south eastern position covers Iheuokpara and environs. Areas mapped out for industrial landuse are located within the northeast and northest comprising Emene and Eke areas. Other areas within the eastern segment of township comprising Asata and environs were also considered ideal site for industrial landuse. Large percentage of land unit bordering Onuba area in the northwest, and Udi area in the southwest were carved out for possible future inclusion in the landuse map. A new area was later added for master plan, it occupies a large sector starting from west of Trans Ekulu through nineth mile corner to Ngwo.
4.3. Comparism of the Present Work with the Existing Landuse Map
- The produced composite landuse map of area of this work clearly exposes the limitations of the existing landuse map of area. It should be observed that all the residential and industrial areas of the existing landuse map including the popular Emene industrial estate fall within the low capability zones as shown by the result of the present study. However, the present waste disposal site used by Enugu Environmental sanitation authority (ESESA) located at Ugwuaji though not included in the existing landuse map falls within the high suitability area for waste disposal of the present study. This means that its present location is ideal. The new areas added to master plan of the existing landuse map fall partly within the high suitability zone for industry and residential use of the present study, but to a large extent conforms to the areas of low suitability for the three landuse options. It should be noted that the western and south eastern segments of the existing landuse map were selected as open space, but in essence these areas are best suitable for industrial and residential land use options as indicated by the result of the present study. Areas limited for use due to hazards of flooding, landslide, fault and gulley erosion of the present study were not considered by the existing landuse map, rather the areas were mapped out for industrial and residential landuse by the existing landuse map. The present study buffered all the major towns a distance of 1000 meters (1km) within which no industry can be set up as to avoid pollution of residential areas, by dangerous industrial gases and effluents (Pontius, 2000). This factor was not considered by the existing landuse map. The integration of residential industrial and waste disposal maps into a composite form is an added advantage since for example areas suitable for residence, industry or both may not be suitable for waste disposal; in this case it shows areas where special engineering work can be done as to limit environmental pollution and possible collapse of structures. The present work however shows that about sixty (60) percent of the landunit within the area are suitable for waste disposal while the remaining fourty (40) percentage is for residential and industrial land use areas (Onunkwo-Akunne and Uzoije 2011). Scarp face of the escarpment is limited for use by its high slope angle of approximately 60-80% (Ofomata, 1985), this information which was neglected by the existing landuse map was considered by the preset study as an area which may be reserved as open space. Other areas considered ideal for open space by the present study included areas of land slide and flooding, fault and gully erosion areas, these were neglected by the existing landuse map of the area.It should be noted that in all cases, appropriate environmental impact assessment should be conducted prior to the implementation of landuse project. However the development of all the suitable areas will depend upon the available land, as well as on basic needs. For example where an area is suitable for the three landuse options, its actual use for waste disposal, reseince or industry will be influenced by the size of the land available. Areas of high suitability for industry and residence of this study are relatively limited and in many cases occur in isolated patches.
5. Conclusion and Recommendations
- This work indicates that about 40% of Enugu landunit has low suitability for industrial and residential landuses. Areas suitable for waste disposal cover about 60% of the landunit. Some of the available lands are unsuitable for any landuse due to fault, erosion, landslide, flooding and to some extent the scarp face of the escarpment. Areas to the west, south-west and south-east are highly favoured for industrial and residential options. Comparism of the results of he study against the existing land use, clearly exposed the limitations of the current landuse of the area, this must have accounted for the reasons of environmental hazards of building collapses within the area.
References
| [1] | Aria, W.R. 2003. Principles of Geotechnics, environmental protection Service, Canada. Harwood academic publishers, New York pp 85 – 124 |
| [2] | Arthur, D.H. and Irwin, R 1982. Geology in Environmental planning, Graw-Hill Inc. New York pp 20 – 35 |
| [3] | ASTMD 421 – 98 (2000). Annual book of ASTM standard vol 04, soil and rock standard practice for particle size analysis and determination of soil constants West conshokockem PA pp 8 – 9 |
| [4] | A major L.C. 1984. Sedimentary facies analysis of the Campano-Maestritchtian Ajali Sandstone Okigwe area Nigeria 20th annual conference of Nigeria Mining and geosciences Society, Nsuka vol 13, p 11 |
| [5] | Crynine, p.1977. Land disposal of solid wastes cbs publishers and distributors, Darya Garji New Deihi pp 850 – 930 |
| [6] | Chapin, F.J. 1965. Urban land use planning, Illnois, University press pp 34 -48 |
| [7] | Chengliu, and Evett, (2000). Soil properties 2nd Ed, Prentice Hall inc, A Div of Simon and Schuster Englewood Cliffs, New Jersey 06232, pp 28 |
| [8] | Davis, R and Rogers, 1975. Land fill evaluation and Siting study New Jersey. John Wiley and Sons publishers pp 240 – 285 |
| [9] | Egboka, B.C.E 1993. Water resources problem in the Enugu area of Enugu State. Nigerian journal of Mining Geology vol 20 pp 1 – 6 |
| [10] | Egboka, B.C.E. and Onyebueke, F.O 1999. NAH Journal on acute Hydro-geological problems, VIS a VIS planning and management of developing economy. A case study of Enugu area, Nigeria |
| [11] | Ezeanyim, E.C 1988. Hydro-geology of Enugu and evirons, unpublished Msc thesis . university of Nigeria Nsukka |
| [12] | Griffiths, S.A. 1981. Land treatment of leachate for Municipal land fills Nayea publications pp 210 – 216 |
| [13] | Gauley P.N. and korne R.B. 1966. Soil mantle as a waste treatment system. University of California Berkely California, Serial report no 6607, pp 120 – 131 |
| [14] | Hunt, C.B. 2002. Geology of soils, their evolution classification and uses, Sanfrancisco W.H. freeman pp 130 – 172 |
| [15] | Hammer M.J. 2003. Water and waste water Technology, 2nd Ed. New York: Wiley publisher’s pp 230 – 238 |
| [16] | Holland, DA. And Smith S.L. 2003. The effect of changin | Pagegrid in the creation of Laser Scanner, Digital Surface Models in geo-computation. Oxford University press pp 230 – 240 |
| [17] | Iloeje, N.P. 1981. A new geography of Nigeria (A new revised edition, published in Great Britain by B. Williams Colwes Ltd, London pp 85 – 120 |
| [18] | Kang V.C. 2002. Introduction to geographic information system Tata M.C. Graw – Hill publishing company Ltd, New Deihi pp 20 – 25 |
| [19] | Murat, R.C. 1972. Stratigraphy and paleogeography of cretaceous and lower Tertiany in Southern – Nigeria, African geology, Ibadan University press pp 251 – 266 |
| [20] | Nwankwor, G.I., Okeke P.C and Ariarakwem, C.A 2004 land capability index Mapping of Enugu area and Environs for residentiallanduseoption.advancesingeosciencesvol2no1pp4-64 |
| [21] | Onunkwo-Akunne and Uzoije A. P (2010). Application of geographic information system in industrial landuse study of a developing country. Acase of Enugu area. Global journal of applied science. U.S.A pp 8-12 |
| [22] | Ofomata, G.E.K. 1985. Technical report on feasibility study of erosion vulnerability areas in the eastern part of Nigeria Ethiope publishing house, Britain pp 35 – 37 |
| [23] | Reyment, R.A 1965. Aspect of the geology of Nigeria, Ibadan University press pp 22 – 38 |
| [24] | Krabs, D and Robert, W.D (2004).highway materials Grew hill publishers netnwork new yourk |
| [25] | Raymond, C.C. 1979. Land application of wastes vol I, John Wiley and sons publishers pp 150 – 160 |
| [26] | Side, A.C. 1985. Relative importance of factors influencing land sliding in coastal Alaska in proceedings of annual engineering geology and soil engineering symposium Juneau, Alaska pp 34 – 38 |
| [27] | Simpson, 1954. Sedimentary facies analysis of the Campa nomaostritchian Ajali sandstone, Okigwe area, Nig 20th annual |
| [28] | Chapin F.J, 1965. Urban Landuse Planning. Illnois Univ. Press, Illnois USA pp 34-48 |
| [29] | Congalton R.G. 2009. Assessing the accuracy of remotely sensed data. Principles and practices, 2nd ed. CRC Press. Boca ratonFL |
| [30] | Congalton, R.G. 1991.A review of assessing the accuracy of classification of remotely sensed data. Remote sensing of environment 37: 35-46 |
| [31] | Foody G.M. (2002). Status of land cover accuracy assessment remote sensing of environment 80:185-201 |
| [32] | Foody G.M and Boyd M.C. 2003. Predictive relations of tropical forest biomass from landsat. TM data and their transferability between regions. Remote sensing environment 85: 463-474 |
| [33] | Fitz P, Link K, 2008. Comparism of sampling procedures and data analysis for a landuse and land cover map Photogrammetric Engineering and Remote Sensing 47(3): 343 – 355 |
| [34] | Hord M.R. and Brooner W. 2000 Landuse map accuracy criteria Photogrammetric Engineering and Remote Sensing 42 ( 5): 671 – 677 |
| [35] | Igue A.M. (2005). Soil information system for the Queme Basin http://www.rivertwin.delassets/publications/D15 - SLISYS - Queme Basin .z. pdf Jassen L.F. 2006. Accuracy assessment of datellite derived landcover data: a review photogrammetric Engineering and Remote Sensing 60(4): 419 – 426 |
| [36] | Pontius R.J. (2000): Quantification error versus location error in comparism of categorical maps. Potogrammetric Engineering and Remote Sensing 66 (8): 1011 – 1160 |
| [37] | Lilesand, T.M, Keifer R.W, 2000. Remote Sensing and Image Interpretation, 4th ed Wiley, New York, USA |
| [38] | Richard J.A. (2005). Classifier performance and map accuracy remote sensing of Environment. 57:161-166 |
| [39] | Rose Field G.H, Fitz P, Linsk and Ling H.S. 2005. Sampling for thematic map accuracy testing photogrammetric Engineering and remote sensing 48(1):131 – 137 |
| [40] | Story M and Cochran W.F. 2007. Accuracy Assessment of users perspective. Photogrammetric Engineering and Remote Sensing 52(3): 397-399. |
| [41] | Van Gender J.L, Lock, B.F and Vass P.A; 1978. Remote Sensing Environment 7:3-4 |