-
Paper Information
- Previous Paper
- Paper Submission
-
Journal Information
- About This Journal
- Editorial Board
- Current Issue
- Archive
- Author Guidelines
- Contact Us
American Journal of Environmental Engineering
p-ISSN: 2166-4633 e-ISSN: 2166-465X
2012; 2(3): 58-68
doi: 10.5923/j.ajee.20120203.04
Characterization of Odorants in an Air Wet Scrubber Using Direct Aqueous Injection-Gas Chromatography-Mass Spectrometry (DAI-GC-MS) and Solid Phase Extraction (SPE-GC)
 Abstract
 Reference
 Full-Text PDF
 Full-Text HTML
Nawaf Abu-Khalaf 1, 2, Kim F. Haselmann 3, 4
1Technical and Applied Research Center (TARC), Palestine Technical University – Kadoorie (PTUK), Tulkarm, P. O. Box: 7, Palestine
2Institute of Chemical Engineering, Biotechnology and Environmental Technology, University of Southern Denmark, Campusvej-55, DK-5230 Odense M, Denmark
3Novo Nordisk A/S, Novo Nordisk Park, DK-2760 Maaloev, Denmark
4Department of Physics and Chemistry, University of Southern Denmark, Campusvej-55, DK-5230 Odense M, Denmark
Correspondence to: Nawaf Abu-Khalaf , Technical and Applied Research Center (TARC), Palestine Technical University – Kadoorie (PTUK), Tulkarm, P. O. Box: 7, Palestine.
| Email: |  |
Copyright © 2012 Scientific & Academic Publishing. All Rights Reserved.
One of the biological methods to reduce odours emission from livestock buildings is bioscrubber. Characterization (identification and quantification) of key odorants from an air wet scrubber in livestock buildings is presented. The key odorants represent five chemical groups, i.e. sulphides, alcohols, volatile fatty acids (VFAs), phenols and indoles. Direct aqueous injection (DAI) and solid phase extraction (SPE) methods were used for sample preparation before injecting the samples into the gas chromatography. Gas chromatography-flame ionization detection (GC-FID) was used for identification and quantification of samples prepared by DAI and SPE. The SPE method had a high recovery (i.e. 89-100%). However, DAI showed a better linearity, a lower limit of detection (LOD) and a lower limit of quantification (LOQ) than the SPE method. The DAI method was preferred for identification and quantification as it is cheaper, easier to handle, without sample preparation and highly applicable. For at least two odorants, i.e. phenol and 1-butanol, LOD and LOQ were below literature values for odorants detection limits in livestock buildings. Gas chromatography-mass spectrometry (GC-MS) was used to verify the identification of odorants, prepared by DAI, according to their m/z values.
Keywords: Air Wet Scrubber, Odorants, Direct Aqueous Injection (DAI), Gas Chromatography (GC), Mass Spectrometry (MS), Solid Phase Extraction (SPE)
Article Outline
1. Introduction
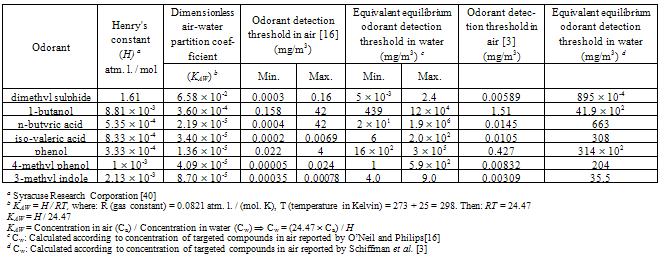
- Odour is an important environmental pollution issue[1]. An odour is defined as a sensation resulting from the reception of a stimulus by the olfactory sensory system[2, 3], whereas an odorant is the compound imparting an odour[4]. Odorant molecules emanating from different sources must be sufficiently volatile to arrive at the olfactory receptors in the nose. The molecular structures of odorants are very diverse, with a mass range from 30 to 300 Daltons[5].The main sources of odours from animal production are livestock buildings, waste storage and land spreading of manure[6]. The emission of odours from livestock buildings contributes significantly to odour problems. This leads to environmental and health problems. It was found that neighbours of livestock buildings suffer from greater mood disturbance, negative emotions, an overall feeling of less vigour, more tension, depression, anger, fatigue and confusion compared with people living away from livestock buildings[7]. In addition, it was found that odours can also potentially affect memory[8].There have been many attempts to reduce odours emission from livestock buildings, i.e. by physical, chemical and biological methods. One of the biological methods is bioscrubbing, which is considered as environmental friendly, and were used for air treatment in different industrial and agricultural activities[9, 10]. Bioscrubbers consist of two main parts: an air wet scrubber (an absorption column) and a bioreactor (a water purification module). The air wet scrubber washes the polluted air stream and the bioreactor cleans the washing water coming from the air wet scrubber[11]. Therefore, the process of bioscrubbing is divided into two steps: the water soluble components in the gas (exhaust air) are transferred to the liquid phase in the air wet scrubber, and microorganisms metabolize different substances in the bioreactor. This results in the production of biomass, CO2 and water[12].Despite extensive information about bioscrubbers, they have not been successfully implemented in livestock buildings, mainly due to their high capital and operating costs, and due to the large volumes of air that must pass through the air scrubbers, i.e. high energy requirement[10]. A new type of livestock bioscrubber for treatment of larger volumes of air, without risk of high pressure loss over the scrubber column, was introduced in Denmark[13, 14]. This bioscrubber consists of two separate units: an air wet scrubber and a bioreactor. The air wet scrubber is placed inside the ventilation chimney, where odour substances (odorants), ammonia and dust particles are absorbed by water droplets. Water droplets are introduced to the absorption column through water nozzles, who receive water recycled from the bioreactor, where the water is purified. The bioreactor is placed at floor level, and can supply cleaned water to several absorption columns[13]. In the bioscrubber, it is necessary to characterize the mixture of odorants present in water, before and after the bioreactor for determination of the cleaning efficiency of the bioreactor.Odours are measured analytically or sensorally. Analytical methods measure odorants, and sensory methods measure odours. The analytical methods characterize odorants in terms of their chemical or physical composition, with the most common measurement being odorant concentration. Analytical measurements have the advantages of objectivity, repeatability and accuracy. They are directly related to theoretical models with regard to odorant formation or emission and are more suited for formation, emission and dispersion models. However, a link between analytical and sensory measurements is needed[4]. The main barrier to that link is the effect of mixtures. It is often observed that a mixture of odorants will have a stronger odour than any of the odorants alone, so that the effect of mixing will be additivity. However, the degree of additivity varies[15]. An analytical quantification of a mixture of odorants in water will be the first step in an effort to establish a comparison between the sensory and the analytical methods.The full characterization of all the odorants present in a sample is an impossible task, as a large number of odorants is likely to be present in very low concentrations. Schiffman et al.[3] used gas chromatography-mass spectrometry (GC-MS) to identify a total of 331 different odorants from livestock buildings. These compounds belong to different groups, e.g. alcohols, carbonyls, nitrogen-containing compounds, sulphur-containing compounds, ketones and aromatic organics among others. O’Neil and Philip[16] found 168 different compounds in livestock waste and in the air in livestock buildings, that contribute to odour, and thirty of them have detection thresholds of 1 μg/m3 or less. Separation techniques followed by different identification methods are used. Purge and trap (P&T), solid phase micro extraction (SPME) and solvent extraction were used as a separation techniques for GC, multidimensional GC, or GC-MS analysis[17-21].Due to the huge numbers of odorants, seven key odorants, representing five chemical groups, i.e. dimethyl sulphide represents sulphides, 1-butanol represents alcohols, n- butyric acid and iso-valeric acid represent volatile fatty acids (VFAs), phenol and 4-methyl phenol represent phenols and 3-methyl indole represents indoles (Table 1), were chosen as key odorants in this study. They have an offensive odour, despite their presence in low concentrations in various livestock buildings[3, 16]. The compounds investigated are polar or moderately polar. The mixture of these compounds is complex since they have different properties, i.e. seven compounds representing five chemical groups. The concentrations of these compounds in air were investigated by many researches. O’Neil and Philip[16] and Schiffman et al.[3] reviewed the odorant detection thresholds in livestock buildings. The odorant detection thresholds of key odorants in air listed by these two reviewers[3, 16] will be used in this study.In the air wet scrubber, these compounds are present in the liquid phase rather than in the gas phase, and their concentrations are calculated using Henry’s constant (H), assuming an equilibrium between gas and liquid. Henry’s constant (H) is the ratio of the partial pressure of the analyte in the gas phase to the equilibrium concentration in the water (expressed in: atmosphere liter / mol). The dimensionless air-water partition coefficient (KAW) is H/RT, and is the air to water concentration ratio at equilibrium[22]. The dimensionless air-water partition coefficient represents volatility of the compound. A compound with KAW of 0.05 or larger is volatile, whereas those with a KAW lower than 0.05 tend to occur in the water phase[23]. However, Revah and Morgan-Sagastume[12] stated that a compound is volatile when its KAW is larger than 0.01. Almost all of the targeted compounds, except dimethyl sulphide, have a lower KAW than 0.05 and they tend to occur in water. The detection thresholds of the targeted compounds in air and the equivalent equilibrium odorant detection threshold in water are shown in Table 1. The equivalent equilibrium odorant detection threshold in water is equal to[22]:(concentration of odorant in air gas constant temperature in Kelvin) / Henry’s constant.In this work, the characterizations of key odorants were carried out using two methods, i.e. DAI-GC-FID and SPE-GC-FID. Moreover, identification of odorants samples prepared by DAI, was carried out by GC-MS, i.e. odorants were identified according to their retention times and masses using GC-FID and GC-MS, respectively.DAI was used both in the laboratory and in the field for the detection of fuel oxygenates, benzene, toluene, ethylbenzene and xylenes (BTEX) with very high accuracy[24], in the quantification of major volatile compounds and polyols in wine[25] and for quality control of water[26].SPE could be regarded as a specific type of column chromatography, switching between full retention using e.g. water as mobile phase, and no retention using e.g. 100% organic solvent as mobile phase[27]. Different sorbents are available for different applications. Successful applications of SPE include the analysis of flavour compounds in milk, preservatives and sweeteners in soft drinks, colourants in alcoholic beverages, pesticides in water[28] and several medical examples[29-32].The objective of this study is to characterize the key odorants in an air wet scrubber, according to their odorants detection threshold cited by O’Neil and Philip[16] and Schiffman et al. [3], by using DAI-GC-FID and SPE- GC-FID and to compare the two methods with respect to the air wet scrubber application.
2. Experimental Section
2.1. Sample Preparation
2.1.1. Materials
- All compounds were purchased from Sigma-Aldrich (Schnelldorf, Germany). Phenol and 3-methyl indole were obtained as solids with purities of 99.5% and 98%, respectively. Dimethyl sulphide, 1-butanol, n-butyric acid, iso-valeric acid and 4-methyl phenol had purities of 99%. Compounds were used without any further purification. Ten mixtures of standard solutions (i.e. model solutions) were prepared in Millipore water with a concentration range between 10-5000 mg/m3 for VFAs and 4-methyl phenol, between 5-2490 mg/m3 for 3-methyl indole, between 15-7500 mg/m3 for 1-butanol and phenol, and between 15-7537 mg/m3 for dimethyl sulphide. However, 3-methyl indole was firstly dissolved in hot Millipore water[33] before the addition of other compounds to the mixture. The same standard solutions were used for the DAI and the SPE methods.Methanol and deionised water were used for conditioning and equilibrating the SPE column, respectively. A mixture of acetone and methylene chloride (1:1 v/v) was prepared, and used for eluting the compounds from SPE column[34].Formic acid and hydrochloric acid were used for acidifying water samples prepared by DAI and SPE, respectively. Millipore water and acetone (HPLC quality) were used as a solvent for cleaning the GC syringe between injections of DAI and SPE samples, respectively.
2.1.2. Direct Aqueous Injection (DAI)
- Samples for DAI were acidified to approximately pH 2, by adding 0.2% (v/v) formic acid, since it was impossible to identify the VFAs in the chromatogram without acidifying the samples. Injection volumes of 0.5 and 1.0 µl were used in duplicates.
2.1.3. Solid Phase Extraction (SPE)
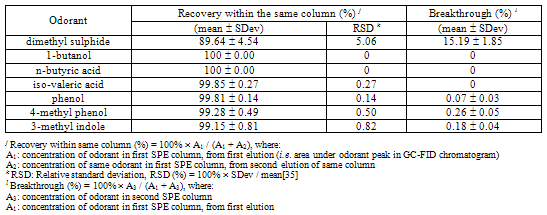
- The analytes were extracted from the solution of odorants mixture using Strata-X polymeric SPE cartridges (Phenomenex, CA, USA), with 500 mg adsorbent and 3 ml reservoir volume. Strata-X is a modified styrene- divinylbenzene polymer suitable for a wide range of basic, neutral and acidic compounds[29, 30], and can separate trace amounts of chemical compounds from a complex solution[28].A 10 ml aliquot was taken from each standard solution. The pH was adjusted to 2 by addition of concentrated hydrochloric acid (HCl). An inorganic acid (i.e. HCl) was used, since inorganic compounds are insoluble in the adsorbent. Before sample loading, the SPE columns were conditioned by washing with 5 ml methanol, and equilibrated with 5 ml of deionised water. Before the column dried, the samples were loaded onto the conditioned column with the aid of a vacuum manifold. The mean flow rate was about 2.5 ml/minute. The analytes were eluted with 2 ml of a mixture of acetone and methylene chloride (1:1 v/v)[34]. A pipette (Gilson International, France) was used to determine the volume of eluting mixture. The eluted solvents were collected for analysis in standard vials of 2 ml and 12 32 mm, with Silicon/PTFE caps (Brown chromatography supplies, Wertheim, Germany). Duplicates of SPE samples were carried out.The recovery and breakthrough of SPE columns were investigated before using the Strata-X columns to make calibration curves. The solutions that were eluted to investigate recovery and breakthrough, had at least threefold higher concentration than the maximum concentration of each compound, that was used for the calibration curves in the SPE-GC-FID experiment. Recovery of the SPE columns was evaluated through double elutions, i.e. after finishing elution from the SPE column, another elution was done within the same column, and injected into the GC-FID in duplicate. Breakthrough of the column is the point, where the SPE sorbent becomes saturated and unable to retain additional analytes. Breakthrough was evaluated by using two SPE columns, i.e. collecting the aqueous solution from the first SPE column, load it once more on another SPE column and then elute the collected samples from both columns into the GC-FID. Same procedure of elution was followed for both columns.
2.2. Gas Chromatography (GC)
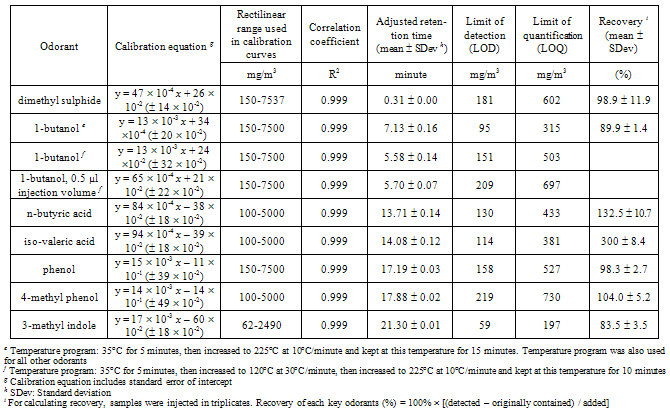
- An Agilent gas chromatograph (HP 6890), containing a capillary column (Zebron ZB-Wax, Phenomenex, CA, USA) 30 m long 320 µm inner diameter 0.25 µm nominal film thickness, with a cool-on-column injector (COC) and FID detector, and with a maximum temperature of 300oC, was used. A 5 m deactivated precolumn of the same diameter was placed before the capillary column. Hydrogen was carrier gas with a constant flow rate of 2.5 ml/minute, corresponding to an initial head pressure of 43.7 kPa. The hydrogen and the air flow in the detector were 25 ml/minute and 400 ml/minute, respectively. Nitrogen with flow rate of 25 ml/minute was used as a make-up gas for FID. Samples were injected using an auto sampler (HP 6890 injector) with a slow plunger speed. Manual integrations were done for small peaks in the chromatogram.The temperature program was: 35oC for 5 minutes, then increased to 225oC at 10oC/minute and kept at this temperature for 15 minutes. The total run time was 39 minutes. According to our preliminary experiments with DAI, a modified temperature program was required for improving the peak shape of 1-butanol in odorants mixture: 35oC for 5 minutes, then increased to 120oC at 30oC/minute, then increased to 225oC at 10oC/minute and kept at this temperature for 10 minutes. The total run time was 28.33 minutes.The injection volume was 1 µl in the case of DAI-GC-FID and SPE-GC-FID. For 1-butanol using DAI-GC-FID, two injection volumes (1.0 µl and 0.5 µl) of odorants samples were tested.The limit of detection (LOD) and limit of quantification (LOQ) of each odorant were determined from the calibration curves, according to Miller and Miller[35], i.e. LOD is the concentration corresponding the area of: intercept + three times standard error of the calibration curve, and LOQ is the concentration corresponding the area of: intercept + ten times standard error of the calibration curve.
2.3. Gas Chromatography-Mass Spectrometry (GC-MS)
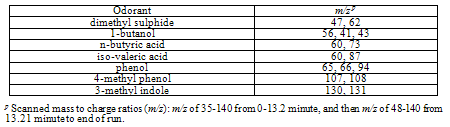
- Samples prepared by DAI injections were also analysed by GC-MS, i.e. DAI-GC-MS, to verify the identification of odorants. A Finnigan-MAT SSQ 710 B (Finnigan-Mat, San Jose, CA, USA) single-stage quadrupole mass spectrometer coupled with Varian 3400 GC (Technical Lab Services, Ajax, ON, Canada) was used. MS had one 160 mm hyperbolic quadrupole mass analyzer, energy of ionising electrons equal to 70 eV, current of 400 µA, 150oC for source temperature, mass range 10-2600 m/z, differentially pumped vacuum system with two turbomolecular pumps and 15 KV conversion dynode detector for detection of positive and negative ions.Same column and temperature program (i.e. 35oC for 5 minutes, then increased to 225oC at 10oC/minute and kept at this temperature for 15 minutes) that were used in the DAI-GC-FID experiment, were also used in this experiment. GC has splitless mode injection and Helium (2.7 ml/minute) as the carrier gas. An initial head pressure was 41.4 kPa. Volume of 1 µl was injected manually using a syringe.During experiments of DAI-GC-MS, we scanned mass to charge ratios (m/z) in the range of: m/z of 35-140 from 0-13.2 minute, and then m/z of 48-140 from 13.21 minute to the end of the run. This was done to eliminate the appearance of formic acid (i.e. molecular weight 46.03 g/mol) peak in the spectra when we tested the real sample from the farm (see: application and perspectives section). However, this scan method was used for all samples. The operation system in MS had Ultrix 2.0 (Digital Equipment Corporation, Maynard, MA, USA). ICIS 7.0 software (Finnigan-Mat, San Jose, CA, USA) including the mass-spectra library NIST (National Technical Information Services, Springfield Virg., USA) was used to control the instrument and for data analysis. Spectra interpretations and library matches revealed candidate compounds. The identified compounds had purity that is greater than 800.
3. Results and Discussion
3.1. Direct Aqueous Injection (DAI)
- Injection of samples containing large quantities of water into a chromatographic column will affect the efficiency of the column, lead to degradation of the stationary phase, and create active sites resulting in low peak resolution, poor reproducibility and shortened column life[25]. However, DAI was successfully used in many applications[24-26], since the structure of the stationary phase in capillary columns has been improved[36]. The Wax stationary phase is thermally stable, inert and has high endurance with repeated injection of aqueous samples[37]. The Wax columns are recommended for many separations, including alcohols and aroma compounds[25]. However, there is still a need for frequent system maintenance to avoid troublesome effects, e.g. peak tailing, reduced recovery and sensitivity, caused by water. The precolumn is used in the GC to reduce these troublesome effects. It is frequently shortened, and is recommended to replace it after about 1000 injections[24].The key odorants dissolved in water, were injected into the Wax column in the GC. Samples were acidified to approximately pH 2 by adding 0.2% (v/v) formic acid.
3.1.1. Identification and Quantification of Compounds by DAI
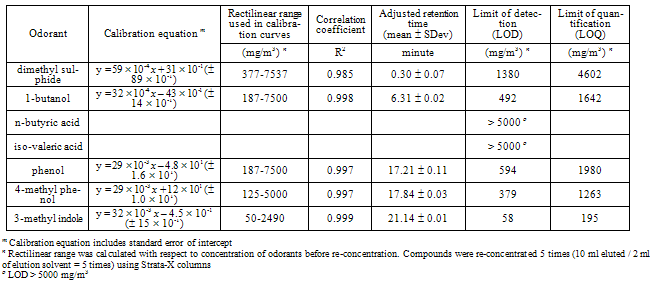
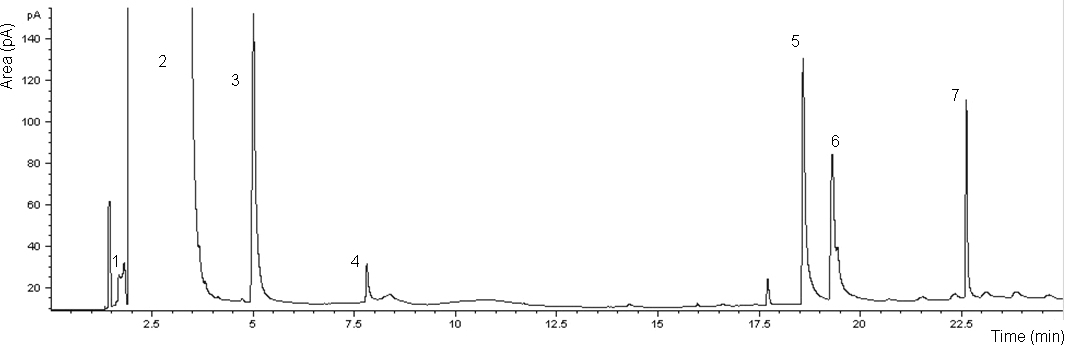
- The chromatogram and the performance of the DAI-GC-FID are shown in Figure 1 and Table 2, respectively. The adjusted retention time was used to identify the odorants. However, before making the mixture of odorants, individual odorants were injected separately into the GC to identify their retention time. The adjusted retention time is the difference between the dead time and the retention time for a compound. The dead time is the time required for the mobile phase to reach the detector[38]. The range of the standard deviation in the adjusted retention time was between 0.00-0.16 minute. 1-butanol had the highest standard deviation that reflects the difficulty in assigning the peak position of broad peaks.The injection volume has an effect on the peak shape, especially for alcohols[24]. Therefore two injection volumes, i.e. 1.0 µl and 0.5 µl, of odorants mixture were tested. The goal was to find the volume that produces the best peak shape for 1-butanol. The characterization of 1-butanol mentioned in Table 2 was determined based on two temperature programs, and two injection volumes. A volume of 1.0 µl, using the temperature program that was used for all the other compounds and two injection volumes of 1.0 µl and 0.5 µl, using the temperature program only used for 1-butanol, to investigate the possibility of improving its peak shape. Generally, the peak shape of the 0.5 µl injection volume (Figure 2, bottom) was only slightly better than that of the 1.0 µl sample (Figure 2, top).It is noticed from the performance data related to 1-butanol, with different temperature programs and different injection volumes (see Table 2), that all combinations give reasonable results. The peak shape of the 0.5 µl injection volume was only slightly better than that of the 1.0 µl sample (Figure 2). However, the LOD of 1-butanol when injecting 0.5 µl is higher than in other cases related to 1-butanol. This means that for 1-butanl, we can use the temperature program which is used for all the other compounds and the injection volume of 1.0 µl in further experiments, e.g. the sample from the farm (see: application and perspectives section). Injecting 1.0 µl of 1-butanol is in agreement with Zwank et al. [24] who recommended an injection volume of 1.0 µl for alcohols.The calibration curves show linearity with good correlation coefficients (R2 = 0.999) for the range specified. The LOD was used to assess the possibility of identifying odorants in low concentrations. Four compounds: 1-butanol, n-butyric acid, iso-valeric acid and phenol, had LODs which were below the equivalent equilibrium odorant detection threshold reported by Schiffman et al.[3]. Two compounds: 1-butanol and phenol, had LODs which were below the minimum equivalent equilibrium odorant detection threshold reported by O’Neil and Philips[16], (e.g. for phenol, the minimum equivalent equilibrium odorant detection threshold according to O’Neil and Philips[16] is 16 102 mg/m3 (Table 1), and the LOD is 158 mg/m3 (Table 2). The LOD of phenol is less than its minimum equivalent equilibrium odorant detection threshold). Three of the compounds, i.e. n-butyric acid, iso-valeric acid and 4-methyl phenol, had LODs which were between the minimum and maximum equivalent equilibrium odorant detection threshold reported by O’Neil and Philips[16].Phenol and 1-butanol had LOQs that were below the equivalent equilibrium odorant detection thresholds reported by both reviewers. While the n-butyric’s LOQ was below the equivalent equilibrium odorant detection threshold reported by Schiffman et al.[3], and was between the equivalent equilibrium odorant detection thresholds reported by O’Neil and Philips[16].These results suggest that at least two compounds, i.e. 1-butanol and phenol, had LOD and LOQ that were below the equivalent equilibrium odorant detection threshold reported by both reviewers, and they were successfully identified and quantified. These two compounds can therefore be used as representatives of the key odorants to give an idea about the efficiency of the air wet scrubber and the bioreactor. Datta and Allen[22] stated that the removal efficiency of the bioreactor is the fraction of the odorant removed by bioreactor, and it can be expressed in percentage as:Removal efficiency = 100 (the inlet concentration – the outlet concentration) / the inlet concentration. Most existing bioscrubber designs focus on the removal of one chemical group of compounds[11], or even removal of one compound only[39]. Therefore our method, which identifies and quantifies successfully at least two compounds, will improve the characterization of the bioscrubber.DAI is a fast and simple technique that only requires small volumes and no pre-concentration. Moreover, it requires no derivatisation of the compounds before injection into the GC. DAI has acceptable sensitivity and is comparable with other analytical methods[24]. In addition, compounds are quantified regardless of their boiling points, which is a limitation in some analytical methods[21]. The results of this study show that DAI is a convenient method for identification and quantification of odorants in the air wet scrubber.
3.2. Solid Phase Extraction (SPE)
3.2.1. Recovery and Breakthrough
- Recovery and breakthrough results of the Strata-X columns are shown in Table 3.A high recovery was obtained, with a mean > 99% and a relative standard deviation (RSD) < 1%. The breakthrough was almost absent, with a mean of < 1%. These results were calculated excluding dimethyl sulphide. If dimethyl sulphide was included, the recovery and the breakthrough became > 89% and < 15%, respectively. Dimethyl sulphide has a low boiling point (i.e. 37.3oC) and is unstable[41, 42] and therefore it was excluded in the analyses by some researchers[43]. However, the recovery and breakthrough results showed a high performance in comparison with other studies[29], and they are in agreement with Coulibaly and Jeon[28] and Zhang et al. [32] who stated that SPE provided high recovery and clean extracts. Our results indicate that Strata-X columns have a good separation capacity for the compounds of interest, even though they have different chemical properties.
3.2.2. Identification and Quantification of Compounds by SPE
- Figure 3 shows the chromatogram of odorants extracted by Strata-X column. It appears that the SPE-GC-FID was unable to identify and quantify the VFAs. However, GC-FID could identify them in the recovery and breakthrough experiment (Table 3). This is most likely explained by the concentration, which was used in the recovery and breakthrough experiment. This concentration was at least threefold higher than the concentration used for making the calibration curves. This higher concentration allowed the VFAs to be available in sufficient amount in free acid forms, so they appeared in the chromatograms in the recovery and breakthrough experiment. This could lead us to conclude that the LOD for the VFAs in the case of SPE is greater than the highest concentration of VFAs in the solutions, i.e. 5000 mg/m3.The performance of the SPE-GC-FID is shown in Table 4. The range of the standard deviation in the adjusted retention time was between 0.01–0.11 minute. The highest standard deviation was for phenol. Nevertheless, the absolute retention time showed an acceptable identification of odorants. Calibration curves showed linearity with correlation coefficients of > 0.997, when excluding dimethyl sulphide.It was noticed that the LOD and LOQ of two compounds, i.e. 1-butanol and phenol, were below the equivalent equilibrium odorant detection threshold reported by Schiffman et al. [3]. One compound, phenol, had a LOD that was below the minimum equivalent equilibrium odorant detection threshold reported by O’Neil and Philips[16]. Two of the compounds, i.e. 1-butanol and 4-methyl phenol, had LODs and LOQs that were between the minimum and maximum equivalent equilibrium odorant detection threshold reported by O’Neil and Philips[16]. Phenol was the only compound which had both LOD and LOQ that were below the equivalent equilibrium odorant detection threshold reported by the two reviewers[3, 16].The LOD and LOQ of odorants were higher when using SPE in comparison to DAI. This may be due to the complexity of the compounds, which have different prosperities, i.e. seven compounds representing five chemical groups. Moreover, SPE is a sensitive sample preparation technique[28] and has more extraction steps than in the DAI. However, the LOD and LOQ of 3-methyl indole were almost the same in both methods. This indicates 3-methyl indole was the best compound to be quantified using SPE in odorants mixture.
3.3. Gas Chromatography-Mass Spectrometry (GC-MS)
- DAI appears as the method of choice to identify and quantify odorants, due to its advantages over SPE method. For this reason, GC-MS was carried out to verify the identification of odorants prepared by DAI. Online NIST Chemistry Webbook[44] was used to determine the most dominant m/z values of odorants, as shown in Table 5, and then a comparison between these values and spectra was carried out. All odorants were successfully identified. The identification was in accordance with retention times of odorants.
|
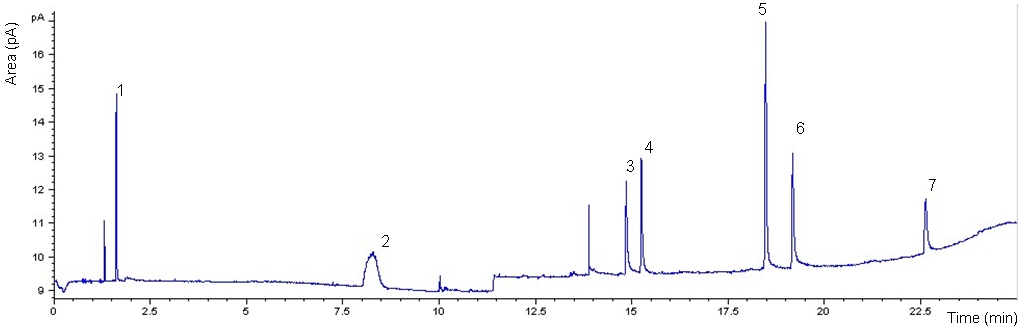 | Figure 1. DAI-GC-FID chromatogram of aqueous solution containing 1000 mg/m3 volatile fatty acids (VFAs) and 4-methyl phenol, 498 mg/m3 3-methyl indole, 1500 mg/m3 1–butanol and phenol, and 1507 mg/m3 dimethyl sulphide (DMS) (1: DMS, 2: 1-butanol, 3: n-butyric acid, 4: iso-valeric acid, 5: phenol, 6: 4-methyl phenol, 7: 3-methyl indole). Injection volume: 1.0 µl. Temperature program: 35oC for 5 minutes, then increased to 225oC at 10oC/minute and kept at this temperature for 15 minutes |
|
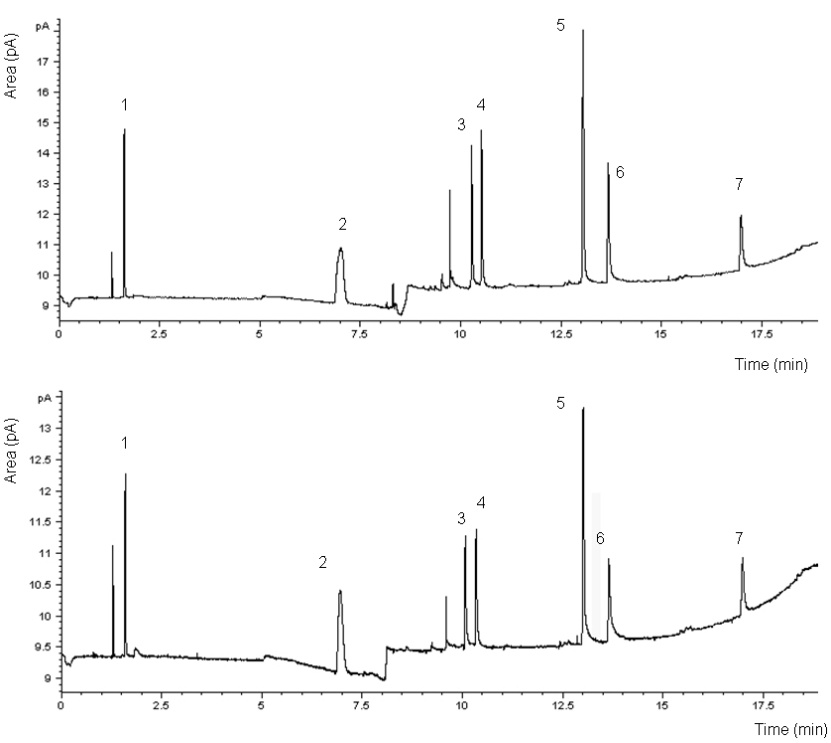 | Figure 2. DAI-GC-FID chromatogram of aqueous solution containing 1000 mg/m3 volatile fatty acids (VFAs) and 4-methyl phenol, 498 mg/m3 3-methyl indole, 1500 mg/m3 1–butanol and phenol and 1507 mg/m3 dimethyl sulphide (DMS), using the temperature program for the 1-butanol: 35oC for 5 minutes, then increased to 120oC at 30oC/minute, then increased to 225oC at 10oC/minute and kept at this temperature for 10 minutes. Two injection volume were used, top: 1.0 µl and bottom: 0.5 µl (1: DMS, 2: 1-butanol, 3: n-butyric acid, 4: iso-valeric acid, 5: phenol, 6: 4-methyl phenol, 7: 3-methyl indole) |
|
|
|
 | Figure 3. SPE-GC-FID chromatogram of aqueous solution containing 3750 mg/m3 volatile fatty acids (VFAs) and 4-methyl phenol, 1867 mg/m3 3-methyl indole, 5625 mg/m3 1–butanol and phenol and 5653 mg/m3 dimethyl sulphide (DMS) (1: DMS, 2: methylene chloride (solvent), 3: acetone (solvent), 4: 1-butanol, 5: phenol, 6: 4-methyl phenol, 7: 3-methyl indole). Injection volume: 1.0 µl. Temperature program: 35oC for 5 minutes, then increased to 225oC at 10oC/minute and kept at this temperature for 15 minutes |
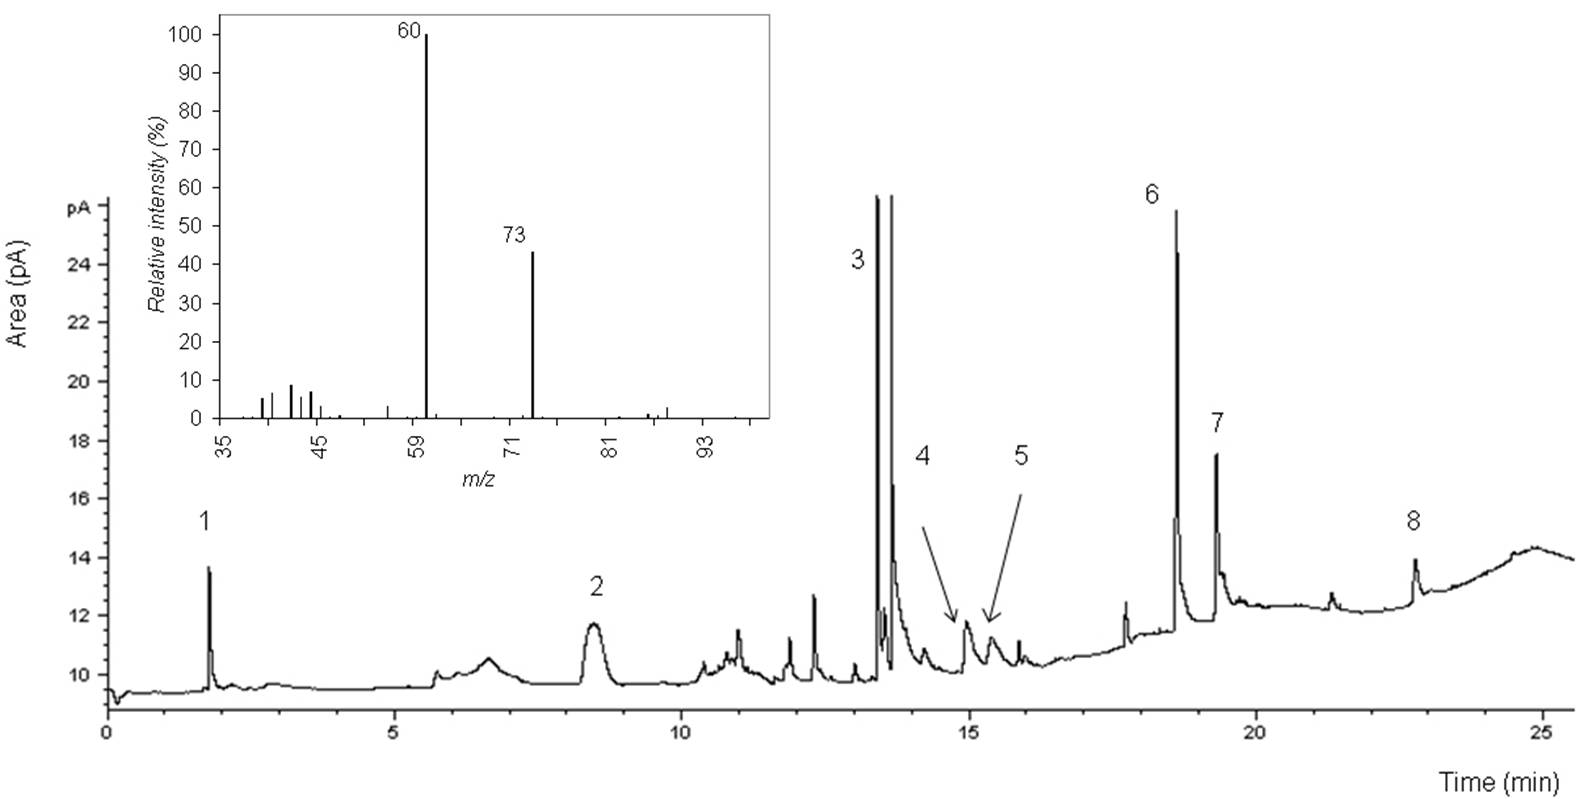 | Figure 4. DAI-GC-FID chromatogram of water sample from air wet scrubber in Danish farm, spiked with target compounds (1: dimethyl sulphide (DMS), 2: 1-butanol, 3: formic acid, 4: n-butyric acid, 5: iso-valeric acid, 6: phenol, 7: 4-methyl phenol, 8: 3-methyl indole). Injection volume: 1.0 µl. Temperature program: 35oC for 5 minutes, then increased to 225oC at 10oC/minute and kept at this temperature for 15 minutes. Inset: relative intensity of n-butyric acid (peak number 4) using DAI-GC-MS |
4. Application and Perspectives
- A water sample was provided to our laboratory by a company, running an experimental bioscrubber in a Danish farm. The water sample was taken from the air wet scrubber, before the inlet to the bioreactor. DAI-GC-FID was chosen as the method for characterization of the sample, since we found that DAI has a better accuracy in terms of LOD and LOQ of odorants. The pH of the investigated sample was 7. It was noticed that in order to acidify the samples to approximately pH 2, more formic acid than used for the samples creating the calibration curves was needed. This may be due to the presence of compounds having buffer capacity in the aqueous sample. The chromatogram of the spiked samples is shown in Figure 4. The spike recoveries are listed in Table 2 (last column). It is seen that the recoveries are near 100% for most of the compounds, and this proves that that DAI method is suitable for quantifying the key odorants. The highest recoveries values are for VFAs, this could be due to the presence of many acids in the sample, which affects the peak shape and consequently the peaks area.GC-MS was used to verify the identification of odorants in the real sample from the farm. Identification was successful, however, 1-butanol was unclear in spectra. Inset-Figure 4 shows the relative intensity of n-butyric acid, using DAI-GC-MS.It is noteworthy that in order to have as many compounds as possible dissolved in water, the ratio between the water flow and gas flow should be at least equivalent to the dimensionless air-water partition coefficient (KAW)[11].There are large variations in literature values of concentration ranges and detection thresholds for odorants from livestock buildings[3, 16]. This is because the odorant concentration is related to many factors, e.g. dietary feed quality, environmental factors, sampling and measuring methods[45]. Therefore we conclude that although the LOD and LOQ of some odorants in this study were higher than the minimum equivalent equilibrium detection threshold, there is still a possibility that DAI-GC-FID method can identify or quantify these compounds. Moreover, the DAI-GC-FID method might be used for quantification of targeted aqueous compounds. It can also be used as a reference measurement method (i.e. validation), for any other analytical method, e.g. electronic tongue to quantify odorant concentrations in an air wet scrubber[46, 47].In conclusion we find that DAI-GC-FID is a suitable method for identification and quantification of odorants with a good precision in the air wet scrubber. Two compounds: 1-butanol and phenol, have LOD and LOQ that are below the equivalent equilibrium odorant detection threshold. DAI-GC-FID is the method of choice for quantification of odorants in air wet scrubbers, where it can quantify their efficiency for odour reduction. This method is fast, simple, requires small volumes only and no pre-concentration or derivatisation of the compounds are needed before injection into GC. DAI-GC-FID can be used as a quality control method for the air wet scrubber design. Verification of odorants identification was carried out by GC-MS.
Acknowledgments
- We acknowledge the Danish Research Agency and the Danish Ministry of Food, Agriculture and Fisheries for their financial support under the research programme ‘Sustainable Technology in Agriculture’. We acknowledge Jens Jorgen Lonsmann Iversen for his support. We also acknowledge Erling Lund Knudsen and Kenneth Bendix Jensen for their valuable help in the laboratories. The authors also would like to thank the Palestine Technical University-Kadoorie for providing financial support to publish this work.