-
Paper Information
- Next Paper
- Previous Paper
- Paper Submission
-
Journal Information
- About This Journal
- Editorial Board
- Current Issue
- Archive
- Author Guidelines
- Contact Us
American Journal of Environmental Engineering
p-ISSN: 2166-4633 e-ISSN: 2166-465X
2012; 2(3): 49-53
doi: 10.5923/j.ajee.20120203.02
Geophysical Method of Investigating Groundwater and Sub-Soil Contamination – A Case Study
 Abstract
 Reference
 Full-Text PDF
 Full-Text HTML
C. N. Nwankwo , G. O. Emujakporue
Department of Physics, University of Port Harcourt, P.M.B 5323 Port Harcourt, Nigeria
Correspondence to: C. N. Nwankwo , Department of Physics, University of Port Harcourt, P.M.B 5323 Port Harcourt, Nigeria.
| Email: |  |
Copyright © 2012 Scientific & Academic Publishing. All Rights Reserved.
Geophysical methods can be helpful in mapping areas of contaminated soil and groundwater. Electrical resistivity surveys were carried out at a site of shallow hydrocarbon contamination in Ahoada, South-South Nigeria. This was aimed at evaluating the subsoil conditions and groundwater quality of the area three years after the post-spill clean-up exercise. The geophysical investigation involved the Vertical Electrical Sounding (VES) technique using the Schlumberger configuration and the horizontal profiling method. The data from the two different approaches correlate well, and the generated profiles of the acquired data helped to map the contaminant plume, which was delineated as an area of high interpreted resistivities. The VES result shows that the subsurface layers up to a depth of 49 m is of moderate to high resistivity values (>200 Ώm) that may affect crops and groundwater development in the study area. However good aquifer can still be obtained from the depth of 30 m and above.
Keywords: Geophysical Investigation, Oil Spillage, Contamination, Groundwater
Article Outline
1. Introduction
- Oil spillage in recent time has been a threat to human life, marine life, wildlife and micro organisms in the soil. It has seriously threatened human existence especially those in the Niger Delta region. Statistics has shown that more than 2.4 million barrels of oil have spilled into the creeks and soil of southern Nigeria in the past 30 years. Some 70 percent of the oil has not been recovered while many spill sites have been abandoned (The Daily Independent, 2010).Oil spillage occurs due to a number of causes, including corrosion of pipelines and tanks, sabotage and production operation. The oil spill has a major impact on the ecosystem into which it is released. The spill and entrapped non- aqueous liquid phase pollutants constitute one of the biggest current problems in the bioradiation effects of contaminated soil and aquifer worldwide.About three years ago, the people of Oshika in Ahoada, south-south Nigeria, suffered devastating oil spill arising from ruptured pipeline. The people whose occupation is predominantly fishing and peasant farming are yet to recover from the damage that accompanied the oil spill which devastated the environment and endangered the biodiversity. Electrical resistivity is sensitive to groundwater quality and hydrocarbons in a porous medium (McNeill, 1990; Benson, 1991; Benson et al., 1991; Burger, 1992). Benson (1991) observed that hydrocarbon plumes may be delineated as resistivity highs since hydrocarbons typically have high resistivities relative to water, or as resistivity lows if inorganic compounds are added to contaminated water to stimulate bioremediation, thus increasing the total dissolved solids (TDS) in the water. Benson et al., (1997), also pointed out that where the hydrocarbons are being biograded, resistivity values may be lower, because biodegradation tends to increase the amount of TDS in groundwater. The resistivity value in sedimentary rocks are also controlled by parameters such as water contents, salinity, texture, matrix conductivity and the presence of clay materials.
1.1. Description of the Study Area
- A geophysical survey was carried out in Oshika community located within Latitudes 05o04І to 05o31 І N and Longitudes 06o33 І E Southern Nigeria (Fig. 1). The rainy season in the area is April to November and dry season is in December to March. The area has a mean annual rainfall of 2400 mm and average annual temperature of 27℃ (Ehirim and Nwankwo, 2009). It is characterized by broadly flat topography with gentle undulations, and is largely drained by River Niger. Mangrove and rain forests characterize the vegetation of the study area. The spill site lies within the coastal plain of the Niger Delta Basin to the south, which consists mainly of Cretaceous sediments deposited in a high-energy deltaic environment. The hydrogeological aspect of the Niger Delta has been studied by many authors (Etu-Efeotor (1981), Etu-Efeotor and Odigi (1983), and Udom et al., (1998). The aquifer of the basin is within the Benin Formation which is the upper most unit of the Niger Delta complex. Its subsurface geology consists of over 90% sandstone with shale intercalations. It is coarse grained, gravely and locally fine grained, poorly sorted, sub angular to well rounded, contains lignite streak and wood fragment. The formation has a thickness of about 2100 m (Ehirim and Nwankwo, 2009, Uko et al., 1992). These characteristics result in good porosity and effective permeability for effective retention and mobility of groundwater and other liquid substance within the subsurface.
2. Objective of the Study
- This study is designed to estimate the extent of contamination and the adverse effects of the oil spill on soil conditions in the study area, using interpreted resistivities obtained by iterative computer modeling of the apparent resistivity data. This information will be helpful to the rural dwellers of the community in planning for their groundwater and agricultural development. It will also assist the Nigerian Government in improving her environmental protection policies.
3. Methods
- Two-dimentional (2-D) and VES geoelectrical surveys were conducted 20 m away from the edge of two separate oil pipelines (which are about 1200 m apart), combining Wenner and Schlumberger methods, and utilizing ABEM Tarrameter SAS 1000C. The location of each sounding station was recorded in Universal Traverse Mercator (UTM) coordinates with the aid of a GERMIN 12 channel personal navigator (GPS) unit. The survey was carried out during the rainy season to allow good contact resistance of the electrodes in the ground for high conductivity of the subsurface. A total of 4 profile lines were occupied covering a maximum spread of 200 m at each location. Four VES stations were also occupied, and by employing Schlumberger configuration with maximum electrode separation of 500 m, the soundings were performed parallel to the profile traverse lines. Each profile location was marked 20 m away from the pipeline and first reading of resistance values against the current and potential difference were taken after necessary connections. Subsequent measurements were taken by expanding current and potential electrode distance to 10m, 20m, 40m, 50m and 60m in the traverse which was oriented in the East-West direction.The apparent resistivity data were processed using an interactive smoothness constrained least-square inversion method (RES 2DINV) software to produce a 2-D model of the subsurface. The computer program automatically subdivided the subsurface into a number of blocks and then used a least square inversion scheme to determine the appropriate resistivity value for each block. The inversion results of thickness and resistivity were used to characterize the subsurface. Similarly, the apparent resisistivity measurements at each VES station were plotted against half electrode spacing (AB/2) on bi-logarithmic graph sheets. The curves were inspected to determine the number and nature of the layering. Quantitative interpretation of the curves was carried out using partial curve matching. The results of the curve matching (layer resistivities and thickness) were fed into the computer as a starting model in an iterative forward modeling technique using IPI2WIN resistivity sounding interpretation software version 3.0 (2003). The interpretation results (layer resistivities and thickness) were also used to characterize the subsurface layers.
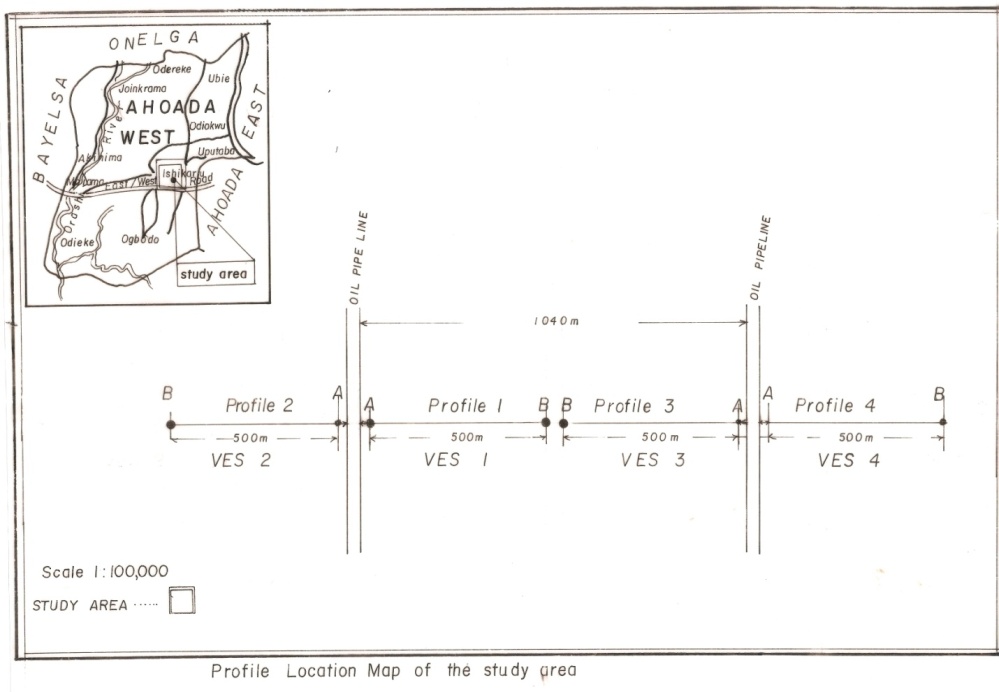 | Figure 1. Location map of Study Area showing the Sounding Points |
4. Results
- The results of the inversion model show large variations in the apparent resistivity (ρa) of the subsurface. Due to these large variations in the resistivity, a 2.50 m cells width model was adopted to produce very resolute images of the subsurface resistivity structure. The individual interpreted output was displayed in three sections of profiles.
4.1. Profile 1
- Three resistivity zones were delineated in the profile representing three conductive zones in the subsurface at different surface points. The low resistivity zone (Deep blue), with resistivity <171 Ώm is isolated in one pointer at the lower section of the profile at surface points 77.5 m to 115.0 m at depth of 23.3 to 32.9 m. This zone is overlain by more resistive layers ranging from 400 Ώm to 800 Ώm (light green to yellow). The high resistivity zone (yellow to purple) increases from 800 Ώm to over 1715 Ώm at three different shallow surface points. The highest resistive zone (purple) was isolated between a depth of 10.8 and 15.6 m at 27.5 to 42.5 m surface points.
4.2. Profile 2
- Three main resistivity zones were clearly isolated. The very high resistivity zone, 1864 Ώm to 545 Ώm (purple to orange) spanning throughout the top section is an indication of oil contamination. This migrates through the permeable sandy formation to the bottom of the investigated depths (32.9 m), between 66.5 to 83.5 surface points. This zone divides the entire area into two, and overlies the less resistive zone at surface points 30 m to 66.5 m to the West and 83.5 m to 140 m to the East at depth ranging from 4.9 m to 32.9 m. The low resistive zones (Deep blue) were isolated at depth range of 10.8 m to 22.5 m in the West and at 25.0 to 32.9 in the East.
4.3. Profie 3
- Only two distinct zones were delineated here. The higher resistivity zone (purple to orange) with values ranging from 1426 Ώm to 360 Ώm covers the entire area from surface to a depth of about 26.8 m. The high resistive zone is underlain by series of less resistive layers with resistivity ranging from 360 Ώm to 98 Ώm (yellow to green). This was isolated at a depth range of 26.8 m to 32.9 m and spread from 80.0 m to 115.0 m surface points. All the high resistive zones are migrating to the bottom of the profile.
4.4. Profile 4
- There are three main resistive zones clearly delineated in this profile. At the top section is a high resistive zone of range 1449 Ώm to 312 Ώm located between 18m and 177 m surface points at depths 2.26 m to 25.1 m. There is a gradual decrease in resistivity from 312 Ώm to 67 Ώm (yellow to light green) with a depth of up to 31.5 m deep. This is underlain by a massive anomalously low resistive zone, less than 7.0 Ώm (light to deep blue colour). This zone is located at a depth of 25.1 m to 32.9 m and between 72.5 and 107.5 surface points. A second high resistive zone is isolated at the top section of the profile between 138.0 m and 155.0 m surface point.
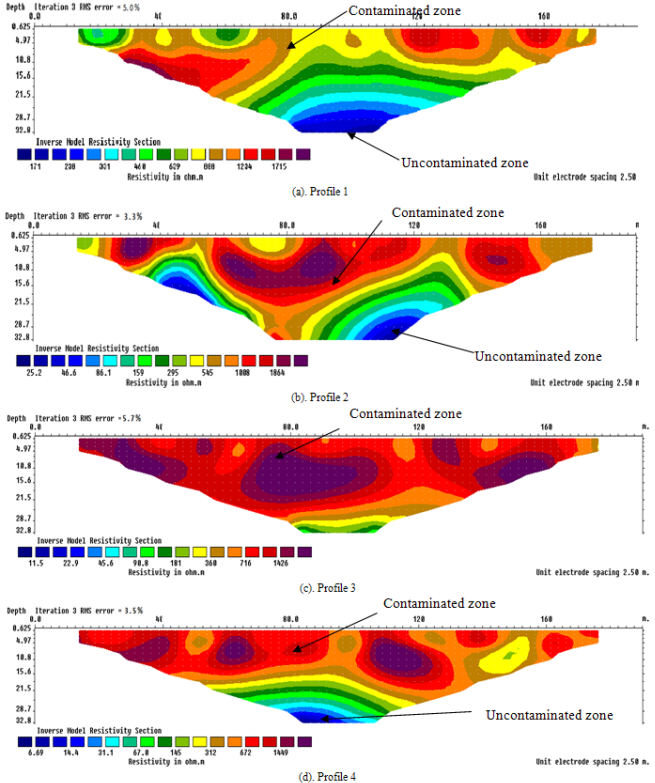 | Figure 2-5. Inverted Resistivity Sections of the Profiles |
5. Discussion and Conclusions
- Three distinctive zones has been isolated in this study from the horizontal profiling method: the low resistive zone (Deep to light blue colour), the intermediate zone (green to yellow colour), and the anomalous high resistive zone (yellow to purple colour). The low resistivity zones in the profiles are areas possibly characterized by clay or brackish sands with little or no contamination. This zone with resistivity varying between 7 Ώm and 331 Ώm are conspicuously absent at the top of the entire profiles, but were isolated at depth points ranging from 10.8 m to 32.9 m. The anomalous high resistivity zones (brown to purple) with resistivities vary between 312.0 Ώm and 1715.0 Ώm and depths ranging from 0.7 m to above 42.8 m, are the possible oil spill contaminated zone. These isolated high resistivity zones at depths in excess of 32.8 m imply that both the subsoil and groundwater in the area may have been contaminated by the oil spill. This is evidenced by the complaint of the residents of the community of having poor seedlings germination, stunted growth and low yield of agricultural produce in the area. On the average, the areas within profiles 3 and 4 are more contaminated than those of profiles 1 and 2. This shows that the clean-up exercise is less effective in areas within profiles 3 and 4. The implication is that groundwater investigation and agricultural development within these two profile zones are less suitable. The relative high resistivity values encountered in all the surveyed profiles in the area may be considered to have reduced chances of detecting deeper layers when compared with the VES data. However, the results reveal that good aquifer can still be obtained from the depth of 30 m and above.
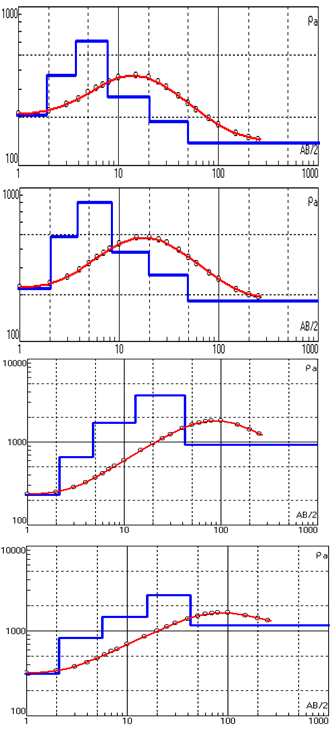 | Figure 6. Typical sounding curves and the interpreted geoelectric |
ACKNOWLEDGEMENTS
- The authors are grateful to Miss Patricia Egbekiri, Akpan Ime, Mr. Itota Godwin and others that were helpful during the acquisition of the data. The support of the entire Oshika Community is highly appreciated.