-
Paper Information
- Previous Paper
- Paper Submission
-
Journal Information
- About This Journal
- Editorial Board
- Current Issue
- Archive
- Author Guidelines
- Contact Us
American Journal of Environmental Engineering
2012; 2(2): 35-38
doi: 10.5923/j.ajee.20120202.06
Nonlinear Correlation Model in the Assessment of Screen Printing Indoor Pollution
 Abstract
 Reference
 Full-Text PDF
 Full-Text HTML
Jelena Kiurski , Ljubo Nedović , Savka Adamović , Ivana Oros , Jelena Krstić , Ilija Kovačević , Lidija Čomić
University of Novi Sad, Faculty of Technical Sciences, Trg Dositeja Obradovića 6, 21000 Novi Sad, Serbia
Correspondence to: Jelena Kiurski , University of Novi Sad, Faculty of Technical Sciences, Trg Dositeja Obradovića 6, 21000 Novi Sad, Serbia.
| Email: |  |
Copyright © 2012 Scientific & Academic Publishing. All Rights Reserved.
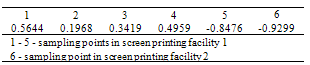
The correlation models were applied to assess the mutual dependencies of the ozone concentrations on the sampling time and sampling points as an extension of our previous investigations. There is no significant mutual dependence, but there are some observable linear and non-linear correlations with sampling time. Correlation of ozone concentration on sampling time is linear at two sampling points (6 and 5) and is expressed by equation: y = - 0.0171x + 0.1329 for sampling point 6. At the other sampling points (1 and 3) nonlinear correlations are expressed by third degree polynomials, y = 0.0061x3 – 0.0934x2 + 0.4335x + 0.0967 (sampling point 1), y = 0.0035x3 – 0.0520x2 + 0.2182x + 0.9887 (sampling point 3). All calculations have been done in the program MATHEMATICA, version 7.0, at 4 correct decimals. Nonlinear correlation model can be successfully used in the assessment of indoor polluted gases distribution in screen printing facility.
Keywords: Regression models, Ozone, Monitoring, Screen printing, Indoor pollution
Article Outline
1. Introduction
- Screen printing is arguably the most versatile of all printing techniques. It can be used to print on a wide variety of substrates, including paper, paperboard, plastics, glass, metals, fabrics, and many other materials. Because of the simplicity of the application, a wider range of inks and dyes are available in screen printing than in other printing techniques. This has been a result of the development of the automated and rotary screen printing press, improved driers, and UV curable ink [1, 2]. UV curable inks consist of liquid prepolymers, monomers, and initiators which upon being exposed to large doses of UV radiation instantly polymerize the vehicle to a dry, tough thermosetting resin [1-4]. Ozone is produced incidentally during many printing activities where UV radiation is emitted, during curing of printing inks, varnishes, lacquers, use of projection lamps, etc. [5]. The risks to health are slight - and in general any symptoms shown will be irritation of the respiratory tract [6-8]. However, in certain cases it is possible that the level of ozone accumulated in inadequately ventilated rooms exceeds the Occupational Exposure Standard (OES). The OESs are approved by the Health and Safety Commission and are applicable only to persons at work. The current OES for ozone is 0.2 ppm in air, averaged over a 15 minute reference period[9]The previous studies were focused mainly on the measurements of tropospheric ozone and other pollutants and their statistical analysis [10-15]. The mutual dependence of ozone concentration on the sampling points and sampling time in indoor printing environment has not been examined yet.This paper extends on the results of our previous investigation for detection and quantification of ozone in the screen printing facilities of [16]. Also, this paper describes the development of an application to forecast the peak ozone levels with the aid of air quality variables, in screen printing facilities. For this purpose, a regression model was considered. The model adapted includes variables that are available on a daily basis, so as daily operational maximum ozone concentration level forecast can be achieved.
2. Materials and Methods
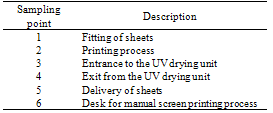
- Sampling: Concentration levels of ozone were monitored in two small screen printing facilities (4-12 employees) in , situated on northern part of . The process in facility 1 (SPF 1) is automatic with a significantly higher production compared with manual process in facility 2 (SPF 2). Number of sampling points during instrumental measurement of ozone concentration was different, due to the type of production process (five sample points in automatic and one in manual process). The locations of sampling points during instrumental measurement were determined by the technical characteristics of automatic screen printing machine, Table 1 [16].During analytical measurement method, air was sampled at one sampling point, near to the automatic machine and to the desk for manual screen printing process.
|
3. Results and Discussion
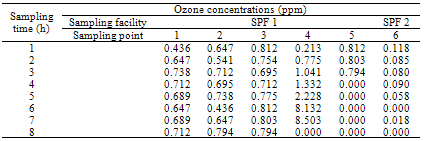
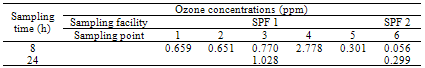
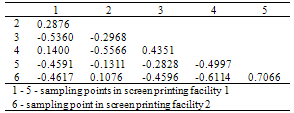
- The results of experimental measurements of ozone concentrations obtained in our previous investigation [16] were used for statistical analysis, Tables 2 and 3.Mutual linear dependence of ozone concentration: Investigating the mutual linear dependence of ozone concentration at the observed sampling points in the two screen printing facilities, the correlation coefficients were calculated, Table 4.Generally, mutual linear dependence of ozone concentration is insignificant at the observed sampling points. Based on the obtained data, the highest obtained correlation coefficient was 0.7066 for sampling points 5 - 6 (Table 4). Also, there is no significant mutual dependence of any other type (quadratic, polynomial, exponential, logarithmic, etc.) of ozone concentration on the sampling points in the automatic and manual screen printing facilities.In the automatic screen printing facility the ozone concentration was largely localized, with low effect of the concentration at one sampling point to ozone concentration at other points.Linear dependence of ozone concentration on sampling time: Investigating the linear dependence of ozone concentrations on sampling time at observed sampling points, the corresponding correlation coefficients were calculated as shown in Table 5. The significant correlation coefficient at the sampling point 6 (SPF 2) was -0.9299. Additionally, the correlation coefficient of -0.8476 was significant at sampling point 5, SPF 1. At both sampling points the correlation coefficient is negative, which indicates that the ozone concentration decreases during the working time (8 hours).
|
|
|
|
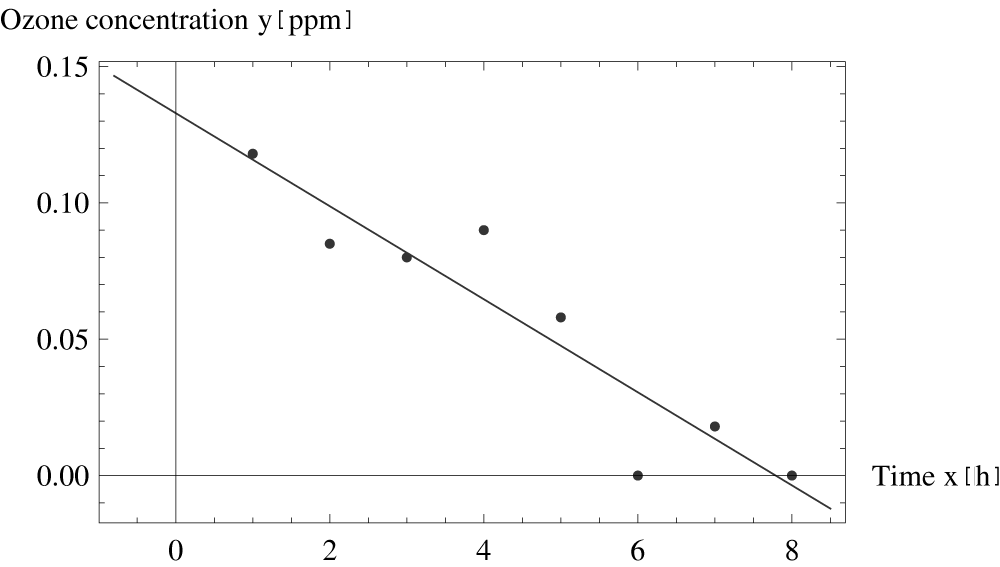 | Figure 1. Graph of linear regression at sampling point 6, screen printing facility 2 |
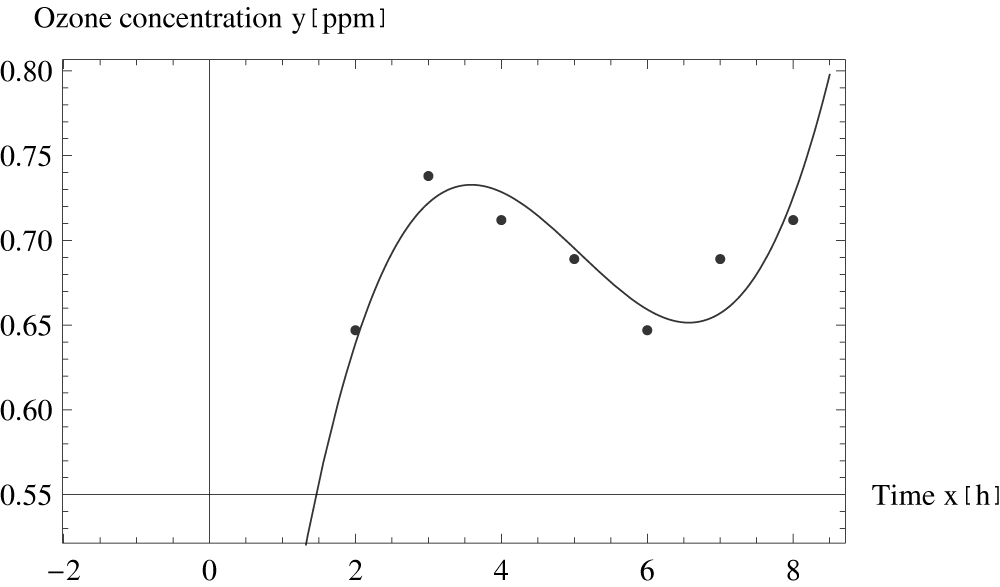 | Figure 2. Graph of nonlinear regression of third degree at sampling point 1, screen printing facility 1 |
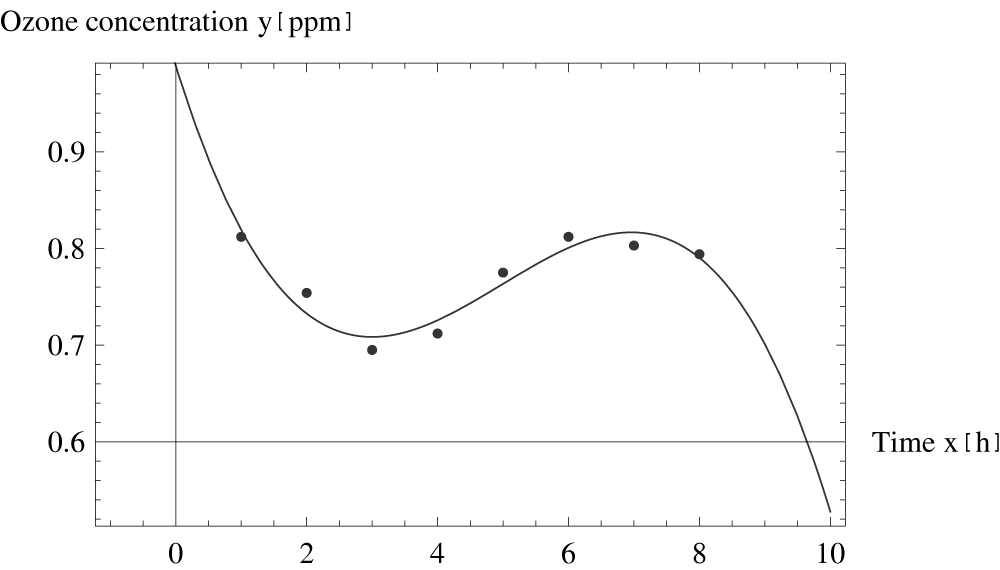 | Figure 3. Graph of nonlinear regression of third degree at sampling point 3, screen printing facility 1 |
4. Conclusions
- Our previous study clearly showed that concentration of ozone depends on the type of screen printing process (automatic or manual) and increases with production volume. Because of the short half-life of ozone (15 minutes) and its known interaction with other pollutants (VOC, NO, NO2, PAN) present in indoor of screen printing facilities, detected concentrations are probably lower than real generated concentrations. Namely, the ozone concentration has a local character, meaning that it can be different at physically close locations, and can be independent of the ozone concentrations at nearby locations. Thus, we conclude that ozone is quickly eliminated in the contact with the surrounding air and is removed outdoors through ventilation systems.Considering the printing microclimate and the complexity of air quality determination, the quantity of actual measured data needed to produce a far reaching and reliable prediction leads very fast to a problem difficult to be managed. The statistical linear regression analysis model becomes, in that sense, attractive, as it enables a fast assessment of the location-specific situation. Even so, given the inevitable limits of regression analysis, the use of area and time covering monitoring data remains a prerequisite. It can, therefore, be only emphasised, that the statistical methodology should be guided by an understanding of the underlying physical mechanisms. Therefore, this study could be a starting point in application of linear and nonlinear regression for ozone analysis in other types of press processes.
ACKNOWLEDGEMENTS
- The authors acknowledge the financial support of the Ministry of Education and Science of the , within the Project No. 34014.