American Journal of Environmental Engineering

2012;  2(2): 19-30

doi: 10.5923/j.ajee.20120202.04

Evaluation of Spatial and Seasonal Variations in Groundwater Quality at Kolar Gold Fields, India

Piyush Gupta , Surendra Roy

National Institute of Rock Mechanics, Kolar Gold Fields, India

Correspondence to: Piyush Gupta , National Institute of Rock Mechanics, Kolar Gold Fields, India.

Email:

Copyright © 2012 Scientific & Academic Publishing. All Rights Reserved.

Abstract

Underground gold mining at Kolar Gold Fields (KGF), Karnataka, was carried out for more than a century, which disturbed the groundwater aquifers. In addition, leaching from mill tailings dumps has also been contaminating groundwater in this area. The aim of the study was to assess the groundwater quality and its suitability for drinking purpose. A detailed survey was carried out within a 10 km radius of KGF and 12 borewells, being used for domestic purposes, were identified for groundwater sampling. The samples were collected from each borewell in each season and analysed for different water quality parameters. It was found that pH, total suspended solids, nitrate, arsenic, fluoride, cyanide, sulphate, alkalinity and sodium in groundwater were within the regulatory limits whereas other parameters exceeded the norms. Water quality index (WQI) was evaluated to know the overall quality of groundwater for each borewell for different seasons. Multiple regression model was developed for prediction of WQI and the performance of the model was assessed. Methods for the treatment of groundwater have also been suggested in this paper.

Keywords: Gold mill tailings, Groundwater quality, Kolar Gold Fields, Physicochemical parameters, Seasonal variation, Water Quality Index

1. Introduction

The Kolar Gold Fields (KGF) mines are seated towards the southern end of a narrow strip of schist in the Kolar district of Karnataka. At KGF, gold has been mined to a depth of 3 km below the surface with 650 km of tunnel work[1] and mining was carried out over 120 years and about 40 million tonnes of mill tailings were accumulated[2].
At KGF, groundwater is a major source of water supply for domestic purposes. Huge amounts of mill tailings dumps, sewerage system in township areas, agriculture and earlier mining activities can contaminate groundwater quality. The use of contaminated groundwater for drinking purpose can cause health problems.
The water quality index (WQI) has been widely used to characterize the usability of water resources for domestic purposes. It provides a single number that expresses overall water quality at a certain location and time, based on several water quality parameters. It gives general idea of the possible problem with water in a particular region[3] and is one of the most effective ways to know water quality[4].
In this study, borewells frequently being used by the public were surveyed to analyze physical, chemical and biological characteristics of water for the assessment of safe drinking water source, to study seasonal variations in water quality parameters with respect to locations, to evaluate seasonal WQI for different borewells, to develop model for WQI for computation of water quality for any season, and to suggest treatment methods.
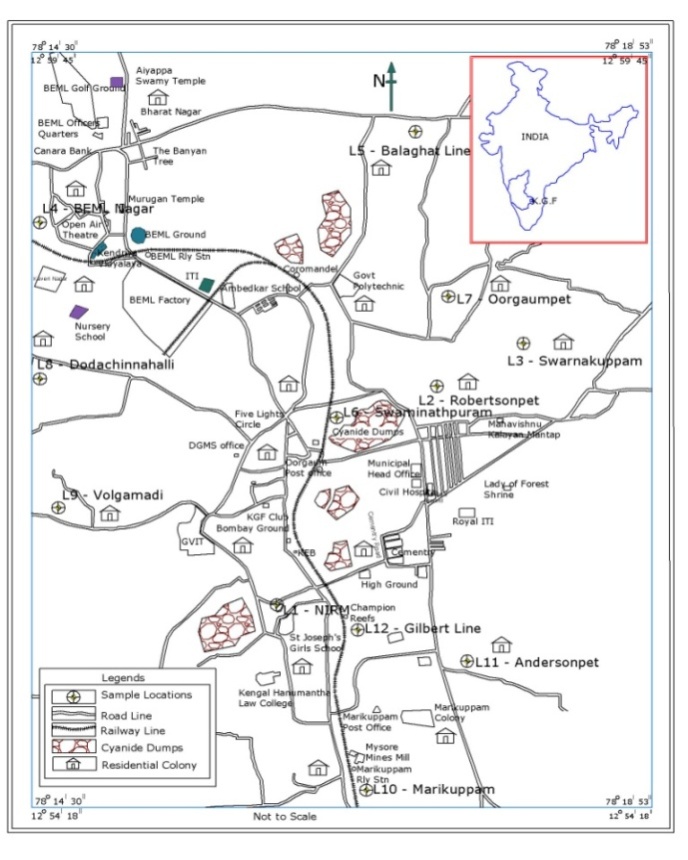
Figure 1. Sampling locations and other surface structures at KGF

2. Methodology

2.1. Sampling Locations

A detailed survey was carried out within a 10 km radius of KGF to identify borewells being used for domestic purposes. Accordingly 12 borewells at different locations (Figure 1) were selected for water sampling, out of which, 5 locations (L4, L5, L8, L9 and L10) are used for drinking in addition to other domestic purposes whereas remaining wells are used for other than drinking purpose. The sampling locations, gold mill tailings dumps, residential colonies and other surface structures are depicted in Figure 1.

2.2. Collection of Samples

At first, borewells were pumped for 5-10 minutes until the pH remained constant. This phenomenon purged the stagnant water from the aquifers. After purging, fresh aquifer samples were collected[5]. Stoppered polyethylene bottles of two litre capacity were thoroughly cleaned and rinsed with water being sampled. The samples collected by grab sampling techniques from different locations were sealed and labeled properly. The samples were collected in different seasons like post-monsoon (October-November), winter (January-February), summer (April-May) and monsoon (July-August) during 2009-10. Preservations of samples were done as per the standard procedures[6]. Sample from each location was collected two times in each season at 30 days interval to determine the average value of the results, which were compared with drinking water standards.
For determination of bacterial contamination, samples were collected in sterile bottles of 200 ml capacity in winter. The samples were kept into ice box and immediately brought to the laboratory for analysis.

2.3. Water Quality Parameters Tested

The samples were analyzed following the methods given in Standard Methods for the Examination of Water and Wastewater[6]. In situ measurements of temperature, electrical conductivity, dissolved oxygen, pH and turbidity were made with Water and Soil Analysis Kit. Total suspended solids were estimated by filtering a known volume of water. Total dissolved solid was determined using digital TDS meter. Total Kjeldahl nitrogen was analysed by Kjeldahl digestion assembly, ammonical nitrogen by colorimetric method, nitrate by phenol disulfonic acid method, arsenic by water hydride generation atomic absorption spectrometric method, fluoride by SPADNS spectrophotometric method and chloride by argentometric titration method. Sulphate and sulphide were analysed by turbiditmetric and iodometric method respectively. Acidity and alkalinity was determined by titration. Calcium, magnesium and total hardness were measured by Ethylene Diamine Tetra Acetic Acid (EDTA) titration method. Sodium and potassium was determined using flame photometer. Biochemical Oxygen Demand (BOD) was measured by direct method using BOD digital incubator and Chemical Oxygen Demand (COD) by digital reactor and photometer. Cyanide was analysed by colorimetric method and coliform organisms by membrane filtration technique. All the parameters were analysed within one week of sample collection after preservation.

2.4. Water quality index

WQI is defined as a rating reflecting the composite influence of different water quality parameters on the overall quality of water. It indicates the quality by an index number, which represents the overall quality of water for any intended use[7]. It depends upon weight or weighting and quality rating of different water quality parameters. The purpose of assignment of weights to water quality variables is to denote each variable's importance to the overall water quality. A larger weight value implies greater importance of the variable and depends on the standards in drinking water set by National and International agencies. Those parameters, which have low standards, can influence the water quality to a large extent even a little fluctuation shows high weighing. The parameter having high limits are less harmful to the water quality allocates low weighting[8]. Therefore, the weights for various water quality characteristics are assumed to be inversely proportional to the recommended standards for the corresponding parameters.
To determine the overall quality of water at different locations in different seasons, WQI was calculated based on the methods given by Sindhu & Sharma[9], Alobaidy et al.[10] and Sisodia & Moundiotiya[7], which is as under:
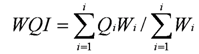
(1)
Where, Wi - unit weight of water quality parameter, Qi – sub index or quality rating
Based on WQI, quality of water was assessed using the water quality index scale [9] (Table 1).
Table 1. Water Quality Index Scale
     

3. Results and Discussion

In the discussion, the water quality parameters have been compared with the drinking water standards prescribed by the Bureau of Indian Standards (BIS)[11]. The parameters for which BIS standards are not available have been compared with United States Public Health (USPH)[12] and World Health Organization[13] standards. The available standards of parameters have been written in their respective figure for comparison and parameters for which standards are not available neither mentioned in the figure nor in the text.

3.1. Assessment of Water Quality Parameters

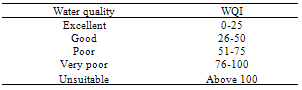
pH is a numerical expression that indicates the degree to which water is acidic or alkaline. It causes chemical reactions such as solubility and metal toxicity depending on its concentrations. It did not vary significantly in the seasons i.e. the results were very uniform throughout this study, with minor spatial and seasonal differences (Figure 2a). All values lied within the tolerance limit. The lower pH value tends to make water corrosive and higher pH provides taste complaint and negative impact on skin and eyes[14].
The highest temperature (28.25℃) was at location L9 in summer and the lowest (24.9℃) at L1 in monsoon indicating seasons influenced the temperature (Figure 2b). Variations in solar energy received at the earth’s surface create periodicities, both diurnal and annual, in temperature below ground surface[15]. Season and topography influences the temperature[16].
Total suspended solids (TSS) consist of silt, clay and fine particles of organic and inorganic matter that usually remains on the filter paper[17]. Seasonal changes showed the lowest (0.147 mg/l) value at L1 in monsoon and the highest (1.513 mg/l) at L6 in winter (Figure 2c). Though mine is closed but earlier activities might have caused its presence in accumulated water. The observed values are within the permissible limit of USPH[12].
Total dissolved solids (TDS) mainly consists of inorganic salts such as carbonates, bicarbonates, chlorides, sulphates, phosphates and nitrates of calcium, magnesium, sodium, potassium, iron etc. and small amount of organic matter[18]. At most of the locations, TDS was higher in winter and lower in post-monsoon (Figure 2d) indicating influence of seasons on concentrations. Wavde & Arjun[19] also found seasonal changes in groundwater. TDS exceeded the tolerance limit at all locations except L9 in post-monsoon. Dissolution of calcite and other minerals might be contributing TDS at different locations[1]. Beyond the limit, palatability decreases and causes gastro intestinal irritation[20], during cooking forms scales in the cooking vessels[21].
Electrical conductivity (EC) measures the amount of ions in a solution. It is an indirect measure of the total dissolved solids content of water[14]. Seasonal variations indicated higher conductivity at all locations in winter compared to other seasons (Figure 2e). It exceeded the standard of USPH[12] at all locations indicating high salinity in groundwater. This might be due to the presence of inorganic dissolved solids such as chloride, sulfate, sodium, magnesium, calcium, and iron cations[14]. According to Ullah et. al.[22], movement of salts along with percolation of water causes EC in groundwater. Often groundwater has higher EC compared to surface water. Excess values lead to scaling in boilers, corrosion and quality degradation of the product[23].
Turbidity depends on the nature of the water bodies such as river under flood conditions, lake or other water existing under relatively quiescent conditions. Under quiescent conditions, most of the turbidity is due to colloidal and extremely fine dispersions[24]. At most of the locations, turbidity is within the norm except L2 and L10 (Figure 2f). High turbidity shortens the life of sand filters and increases cleaning costs of the filters[24].
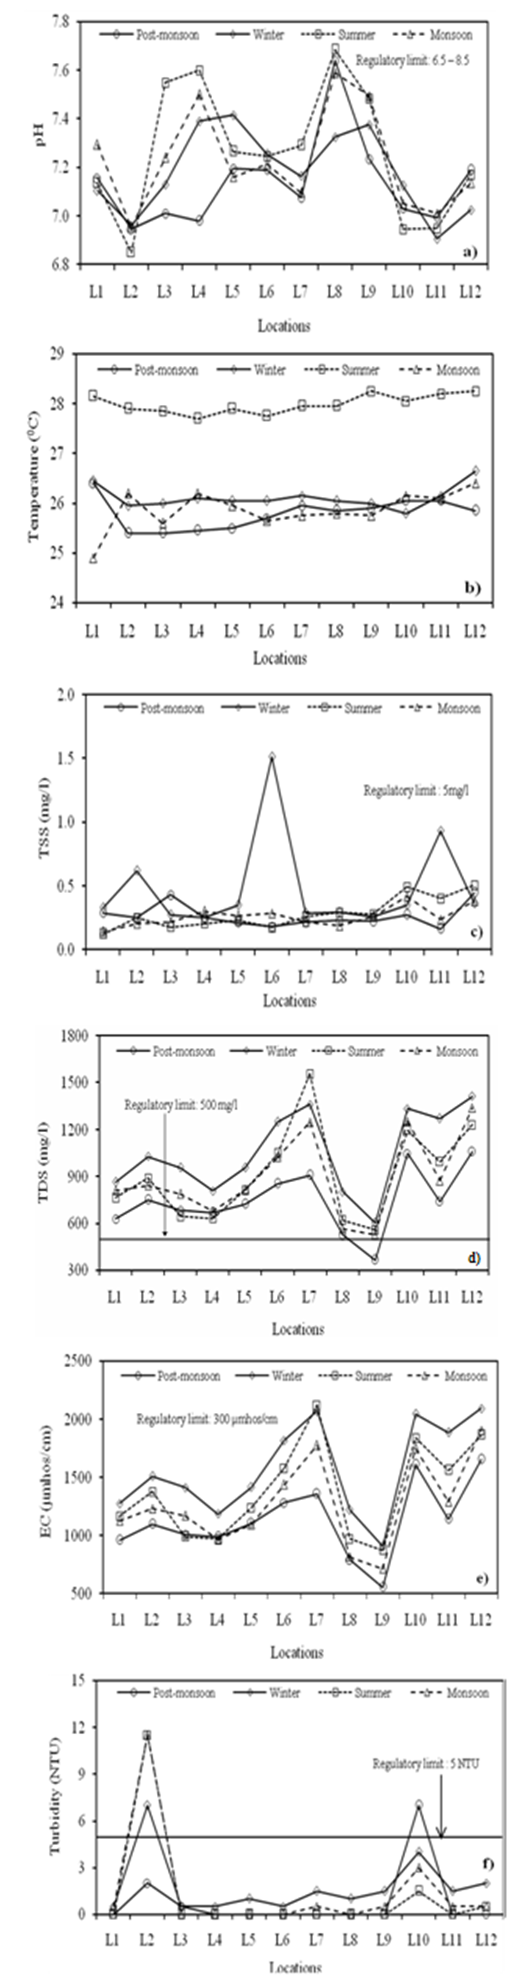
Figure 2. Seasonal variations in (a) pH (b) Temperature (c) TSS (d) TDS (e) EC and (f) Turbidity at different locations
Often four forms of nitrogen namely nitrate nitrogen (NO3-N), nitrite nitrogen (NO2-N), ammonical nitrogen (NH4-N), and organic nitrogen are present in water and wastewater. Organic nitrogen and ammonical nitrogen determined together are referred as total nitrogen or total kjeldahl nitrogen (TKN) and its presence is accepted as a chemical evidence of recent organic pollution particularly of animal origin[25]. Seasonal variations showed the lowest concentration at L5 in monsoon and the highest at L4 in winter (Figure 3a). The intrusion of organic nitrogenous matter in the source might be the reasons for the highest concentration in winter.
Ammonical nitrogen is produced by the microbial activity of organic nitrogenous matter; therefore, it appears in many ground waters[25]. The concentrations of ammonical nitrogen varied seasonally (Figure 3b). It was found higher in post-monsoon compared to other seasons at all locations indicating that more microbial decomposition of organic nitrogenous matter took place in this season. The values were less than 0.47 mg/l as concentration of ammonia in groundwater is generally low because it adsorbs to soil particles and clays[25].
Nitrate concentration in groundwater and surface water is normally low but can reach high levels as a result of agricultural runoff, refuge dump runoffs, or contamination with human or animal wastes[26]. Seasonal changes in nitrate concentrations are shown in Figure 3c. At most of the locations, the concentrations were higher in post-monsoon compared to other seasons. The borewells L10 and L12 are surrounded by dense habitations, domestic drains and septic tanks which might be the reasons for causing variations in concentrations[26]. The nitrate is within the prescribed limit.
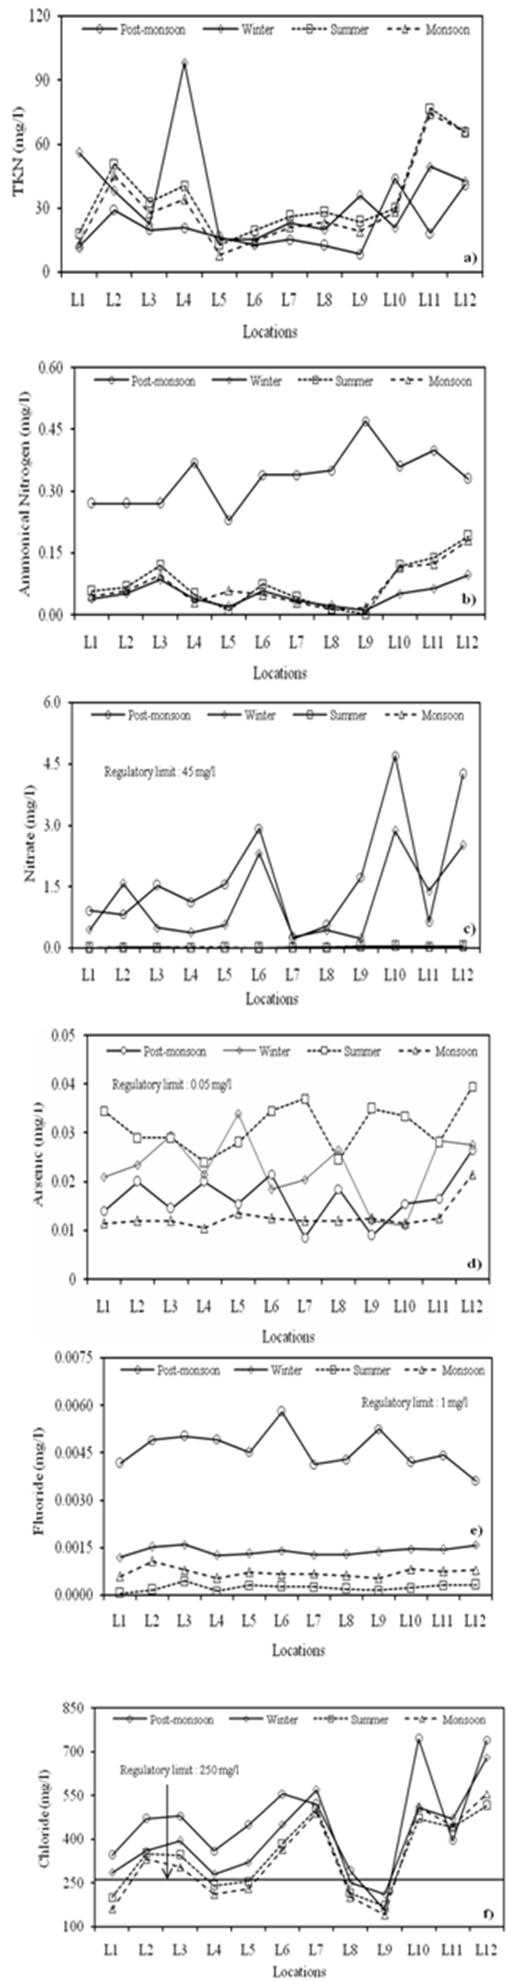
Figure 3. Seasonal variations in (a) TKN (b) Ammonical nitrogen (c) Nitrate (d) Arsenic (e) Fluoride and (f) Chloride at different locations
Arsenic is commonly encountered component of gold ores, which may be mobile under both highly acidic and basic conditions. Figure 3d shows seasonal changes in arsenic concentrations. In summer, concentrations were higher at most of the locations compared to other seasons. The highest value occurred at location L12 (0.0395) in summer and the lowest at L7 (0.0085) in post-monsoon indicating that seasons influenced the arsenic concentrations. Frost et al.[27] also found temporal and seasonal variations and the highest concentrations in summer. The traces of arsenic in groundwater at KGF might be due to presence of sulfide bearing ore like arsenopyrite (FeAsS)[1]. The oxidation of sulphide minerals result in the release of arsenic into groundwater. Arsenic is within the limit. In case of high concentrations, it can cause skin lesion, cancers, vascular diseases, hypertension and diabetes mellitus[28].
Fluoride is universally present in almost every water, earth crust, many minerals, rocks etc.[29]. Seasonal variation indicated higher concentrations at all locations in post- monsoon and lower in summer (Figure 3e). This may be due to amount of soluble and insoluble fluoride in source rocks, the duration of contact of water with rocks and soil temperature, rainfall, oxidation-reduction process[30]. All the values were very low compared to tolerance limit. At decreasing levels, dental caries becomes a serious problem, and at increasing levels, dental fluorosis becomes a problem[24].
Chloride is a widely distributed element in all types of rock in one or the other form. Its affinity towards sodium is high. Hence its concentration is high in groundwater, where the temperature is high and rainfall is less[31]. Seasonal variations showed higher chloride concentration in post- monsoon and lower in monsoon at most of the locations (Figure 3f). The highest value was observed at L10 in post-monsoon and the lowest at L9 in monsoon. Poor sewerage system nearby L10 might be the reasons for the highest chloride. According to Mudgal et al.[32], the presence of chloride in water samples is due to dissolution of rocks surrounded the aquifer or probably due to leakage of sewage and anthropogenic pollution. At most of the locations, it is beyond the limit. High concentrations of chlorides are troublesome for irrigation, harmful to aquatic life [33], corrode concrete used for construction purposes [34] and make water unfit for drinking or livestock watering[31].
Oxidation of sulphide ores, gypsum and anhydride are the main sources of sulphate in groundwater. It combines with calcium to form an adherent and hence heat-retarding scale [15]. Seasonal variations in sulphate at different locations are shown in Figure 4a. The lowest value was found at L11 in post-monsoon and the highest at L5 in monsoon showing influence of seasons on concentrations. At all locations, the concentrations are within the limit. Leaching from gypsum and other common minerals influences the sulphate concentrations in groundwater [35].
Under anaerobic conditions, the sulphate ion is reduced to sulphide ion, which establishes equilibrium with hydrogen ion to form hydrogen sulphide. Seasonal variations were observed at every location (Figure 4b). Concentrations at different locations varied from 1 mg/l to 16.8 mg/l in the seasons.
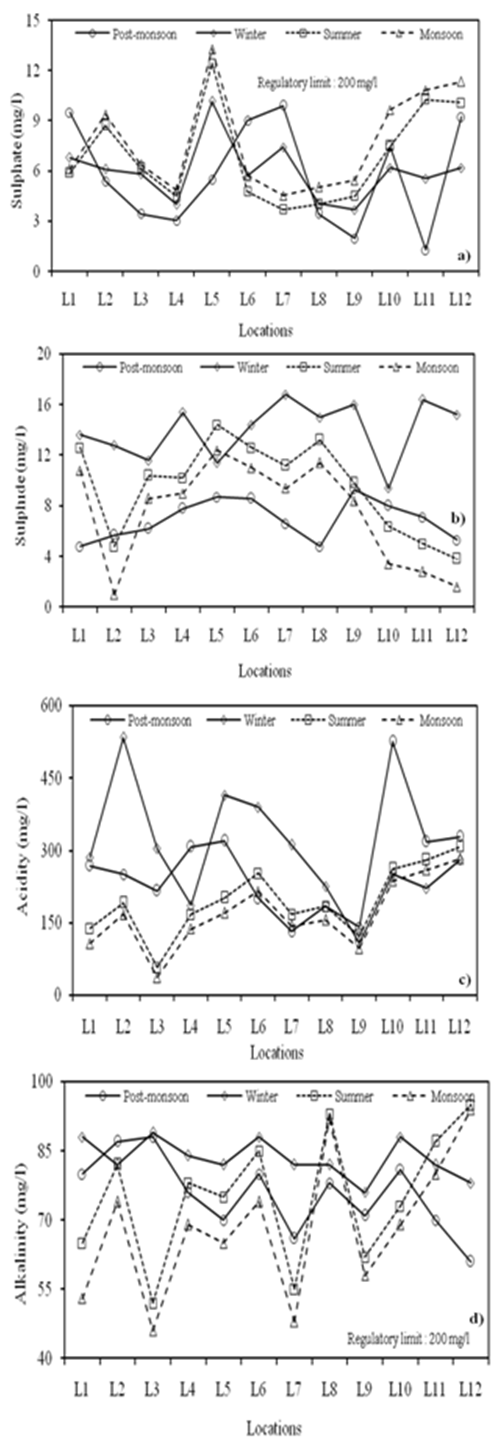
Figure 4. Seasonal variations in (a) Sulphate (b) Sulphide (c) Acidity and (d) Alkalinity at different locations
Acidity is the measure of the ability of water to neutralize base (HCO3-, CO32-, and OH-). Carbon dioxide acidity is due to presence of free CO2 in groundwater. Mineral acidity is due to the presence of HCl, H2SO4, HNO3 and strong organic acids[18]. Seasonal variations in acidity observed at each location are shown in Figure 7c. The lowest value was found at L3 in monsoon and the highest at L2 in winter. Drainage from abandoned mines having iron pyrites poses acidity in groundwater[24].
Alkalinity is a measure of the ability of water to neutralize acids. It is due to presence of bicarbonates, carbonates and hydroxide of calcium, magnesium, sodium, potassium and salts of weak acids and strong bases as borates, silicates, phosphates, etc[18]. Seasonal changes influenced the concentrations at different locations (Figure 4d). Lower alkalinity in monsoon is due to dilution[7]. The concentrations are within the prescribed limit. Large amount of alkalinity imparts a bitter taste, harmful for irrigation as it damages soil and hence reduces crop yields[34].
Water that require considerable amount of soap to produce foam or lather and generate scale in hot-water pipes, heaters, boilers, and others are called hard water. It reflects the nature of the geological formations with which it has been contact. The principal hardness causing cations are calcium, magnesium, strontium, ferrous iron, and manganous ions associated with bicarbonate, sulphate, chloride, nitrate and silicate respectively. Among them calcium and magnesium cause by far the greatest portion of the hardness occurring in natural waters. Water is commonly classified in terms of the degree of hardness namely 0-75 mg/l, 75-150 mg/l, 150-300 mg/l and 300 mg/l above as soft, moderately hard, hard and very hard respectively[24]. Seasonal variations in hardness at different locations are shown in Figure 5 (a, b, and c). At all the locations, total hardness was higher in summer and lower in post-monsoon. It exceeded the desirable limit at all the locations indicating that water is under very hard category. Similar results were also observed for calcium and magnesium at most of the locations. The presence of quartz, calcite, amphiboles, feldspar, etc in gold minerals might be the reasons for hardness in groundwater. The hard water can cause indigestion problem and possibilities of forming calcium oxalate crystals in urinary tracks[23].
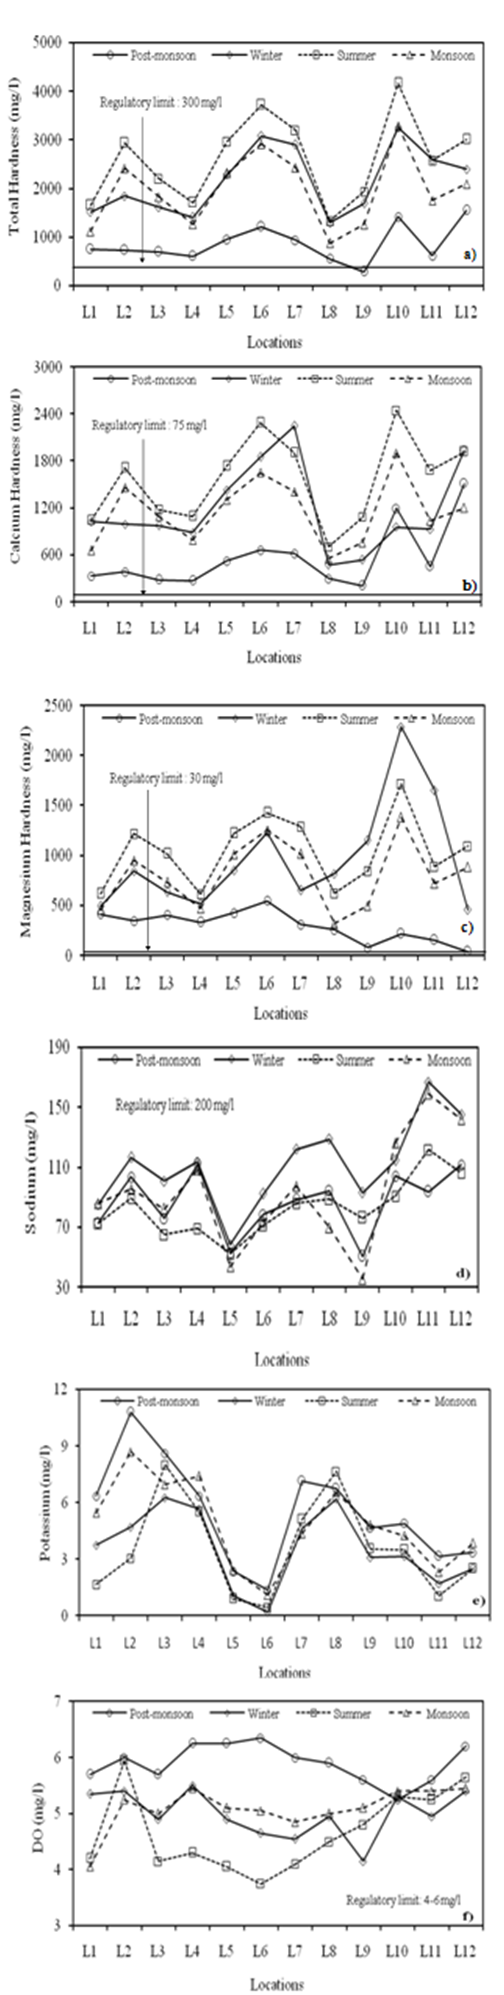
Figure 5. Seasonal variations in (a) Total hardness (b) Calcium (c) Magnesium (d) Sodium (e) Potassium and (f) DO at different locations
Sodium salts are highly soluble in water and impart softness in contrast to hardness[20]. Sodium concentrations varied seasonally at each location (Figure 5d). Feldspars, clay minerals, etc might contribute sodium in groundwater [15]. Also movement of accumulated soil sodium in the downward to the groundwater results in the seasonal variations[36]. Sodium is mostly excreted in urine[20]. The dense habitation surrounding L11 might be the reasons for the highest sodium. All the values are within the limit[13]. Higher concentration can cause cardiovascular diseases and toxemia associated with pregnancy in women[29].
Potassium varied seasonally at different locations (Figure 5e). The lowest (0.20 mg/l) concentration was found at L6 in winter and the highest (10.8 mg/l) at L2 in post-monsoon. Feldspars, micas, clay minerals, etc are responsible for the availability of potassium in groundwater by weathering[15]. Lower value of potassium in groundwater is due to greater resistance to its weathering and fixation in the formation of clay minerals[37]. High concentrations of potassium (> 3.0 mg/l) in ground water result from fertilizing with KNH4 and manure near the wells[36].
Dissolve oxygen (DO) represents the ability of groundwater to purify itself through biochemical process. Respiration by aquatic animals, decomposition of organic matter, and various chemical reactions consume DO. Thus, it is important to assess the waste assimilative capacity of the waters [14]. Seasonal variations indicated the highest and the lowest DO at L6 in post-monsoon and summer respectively (Figure 5f). Since the solubility of O2 in warm water is lower than in cold water, therefore, lower contents of oxygen were measured in summer[36]. Wavde & Arjun[19] also observed minimum DO due to increase in temperature in summer. DO levels fluctuate seasonally, daily, and with water temperature[14,19]. As per USPH the DO should be in between 4 and 6 mg/l[12]. As DO levels in water drop below 5.0 mg/L, many life forms are put under stress[21].
Biochemical oxygen demand (BOD) is defined as the amount of oxygen required by bacteria while stabilizing decomposable organic matter under aerobic conditions[24]. It is required to assess the pollution of surface and groundwater where contamination occurred due to disposal of domestic and industrial effluents[18]. Seasonal changes in concentrations were found at different locations (Figure 6a). The consequences of high BOD are the same as those for low dissolved oxygen. According to WHO drinking water standard, BOD should not exceed 6 mg/l[12]. The BOD is within the norm at every location except at L2 in monsoon, which might be due to leaching of domestic effluent [33].
Chemical oxygen demand (COD) determines the oxygen required for chemical oxidation of most organic matter and oxidizable inorganic substances with the help of strong chemical oxidant[20]. In conjunction with the BOD, the COD test is helpful in indicating toxic conditions and the presence of biologically resistant organic substances[24]. COD varied seasonally (Figure 6b). The highest value occurred at L2 in winter due to adjacent sewer line. It exceeded the norm of WHO[12] at most of the locations which might be due to defective sewer pipe, breakage by tree roots, fractures from seismic activity, etc[15].
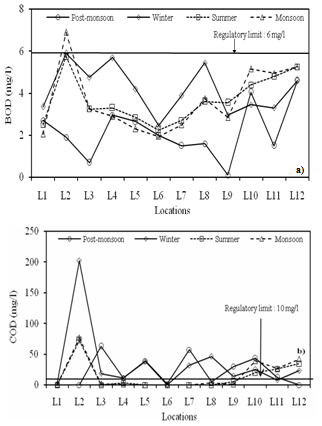
Figure 6. Seasonal variations in (a) BOD and (b) COD at different locations
Cyanide concentrations in groundwater are nil. Rao & Reddy[1] also did not find the presence of soluble cyanide into groundwater, indicating that the cyanide discharged in the tailings are volatilized or immobilized at KGF. According to Abdalla et al.[38], the reduction over time of the cyanide (CN) concentration in the solid waste is attributed to volatilization process. Significant reduction in CN concentration in the aged tailings occurs mainly due to volatilization, leaching and bacterial degradation. They also stated that hundreds of groundwater samples analyzed since the inception of the gold mining indicated CN concentration below detection limits.
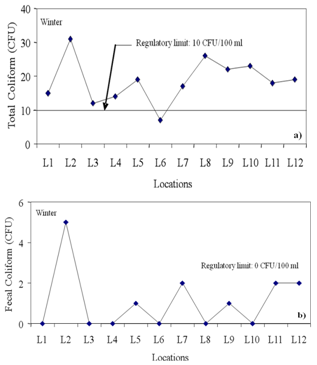
Figure 7. Variations in (a) total coliform and (b) fecal coliform at different locations
The coliform group of bacteria is the principal indicator of suitability of water for domestic purpose[6]. They cause water borne diseases like cholera, typhoid, dysentery, etc. As per BIS, total coliforms (TC) should be less than 10 CFU/100 ml whereas fecal coliforms (FC) should be 0 CFU/100 ml. Total coliforms exceeded the limit at all locations except location L6 (Figure 7a). Out of twelve locations, fecal coliforms are absent in six borewells (Figure 7b). Leaking of waste water from sewer drains might be responsible for intrusion of bacteria into groundwater[15]. Maiti [20] stated that in rural areas, open-defecation in the field, bathing and washing of clothes, etc are some of the common sources of coliform contamination.

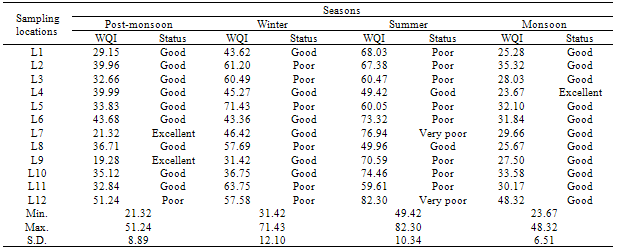
3.2. Assessment of WQI

Many researchers have considered different water quality parameters for the assessment of water quality index [8]. In this study, those parameters for which standards are available like pH, TSS, TDS, EC, turbidity, nitrate, fluoride, arsenic, chloride, sulphate, alkalinity, total hardness, Ca- hardness, Mg-hardness, sodium, DO, BOD and COD were considered for the assessment of WQI in post-monsoon, winter, summer and monsoon. Though total and fecal coliform was analysed in winter season but only total coliform was incorporated in index assessment. Since standard of fecal coliform is zero, it was not considered in index determination.
WQI evaluated for 12 sampling locations in different seasons are given in Table 2. The minimum and maximum values indicate the range of water quality at different locations in different seasons. In summer, the quality at most of the locations was poor compared to other seasons. In monsoon, the range occurred under good to excellent category. The dilution properties due to rain might be the reasons for improved water quality in monsoon.
It was observed that even at the same monitoring location the quality of water varied from season to season. At location L4, the water quality is excellent in monsoon and good in other seasons. At L7, it is excellent in post-monsoon, good in winter and monsoon but degraded (very poor) in summer. Similarly water quality at L9 was excellent in post-monsoon, good in winter and monsoon but degraded (poor) in summer. Hence, seasons influenced the water quality. Low standard deviation in monsoon shows that fluctuation in water quality index at different locations is lesser than other seasons. In winter, WQI ranged from 30.43 to 70.89 after removing total coliform whereas it varied from 31.42 to 71.43 after incorporating (Table 2) indicating that there are no differences in water quality status.

3.3. Multiple Linear Regression Analysis of Data

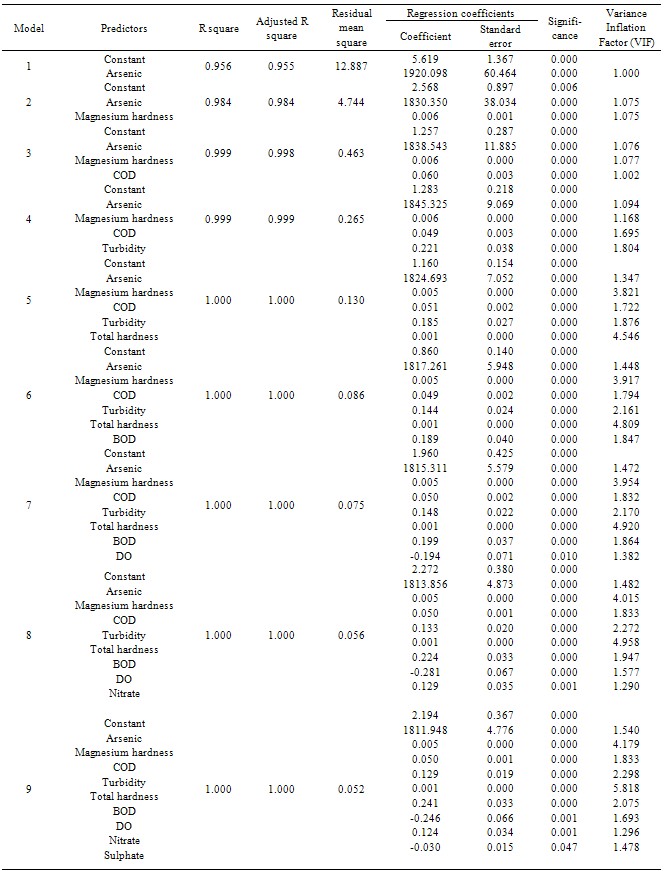
To determine the most influencing parameters as well as to develop a multiple linear regression model for the assessment of WQI from 48 sets of data, SPSS software version 13.0 was used. Stepwise regression algorithm was followed for the selection of variables. According to Grivas & Chaloulakou[39], stepwise multiple regression procedure is commonly used to produce a parsimonious model that maximizes accuracy with an optionally reduced number of predictor variables.
Table 2. Water Quality Index (WQI) of Different Locations in Different Seasons at KGF
     
Table 3 shows the model summary of WQI. The adjusted R2 value is the high and the residual mean square is the lowest for model 9. The derived regression coefficients are neither zero nor less than the standard error. For a model, adjusted R2 increases if the addition of the variable reduces the residual mean square. In addition to this, it is not good to retain negligible variables, that is, variables with zero coefficients or the coefficients less than their corresponding standard errors[40]. Variance inflation factor (VIF) for the input variables is lower than 10 indicating that there is no multicollinearity. According to Montgomery et al.[40], VIF lower than 10 do not imply problems with multicollinearity whereas higher values cause poor prediction equations. Therefore, regression coefficients for the predictors of model 9 were used to derive the equation for WQI, which is as under:
WQI = 2.194 + 1811.948*Arsenic (mg/l) + 0.005*Mg-hardness (mg/l) + 0.050*COD (mg/l) + 0.129*Turbidity (NTU) + 0.001*Total hardness + 0.241*BOD (mg/l) – 0.246*DO (mg/l) +0.124*Nitrate (mg/l) - 0.030*Sulphate (mg/l)
Analysis of variance (ANOVA) for the model indicated that observed value of F was 28925.369 for WQI whereas critical value of F0.01,9,38 was 2.92. It reveals that observed value is many times higher than critical value. For the regression model, to be useful as a predictor, observed F ratio must be at least four or five times greater than critical value of F as reported in Montgomery et al.[40].
The study of residuals (or error) is very important in deciding the adequacy of the statistical model. If the error shows any kind of pattern, then it is considered that the model is not taking care for all the systematic information. For the best performance of the model, residuals should be random i.e. they should follow the normal distribution with zero mean and constant variance[40]. Grivas & Chaloulakou [39] used correlation coefficient (R) between measured and predicted values for the evaluation of model performance.
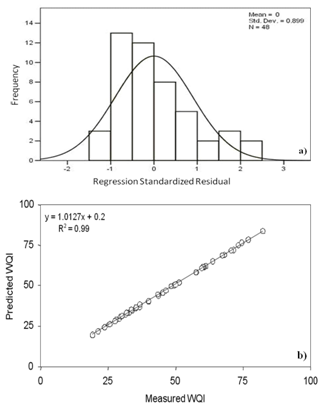
Figure 9(a). Standardized residual analysis and (b) Correlations between predicted and measured values of WQI
Figure 9a indicates histograms of the residuals of WQI model. The residuals analysis shows that the residuals are distributed normally with zero mean and constant variance. The R2 for equation (1) is 0.99, which is significant in statistical sense at 1% level of significance. All the regression coefficients of predictors are also statistically significant (Table 3). Figure 9b shows the plots of predicted and measured values of WQI. Considering the adequacy of the model, equations 1 can be used to estimate WQI for any season in the study area.
Table 3. Model Summary of WQI
     

3.4. Water Treatment Methods

At KGF, groundwater is the only source of water supply for domestic purpose but it cannot be used for drinking purpose without treatment. Analysis showed that some parameters like TDS, hardness, electrical conductivity, etc. exceeded the limits. The methods developed by different researchers can be use for the treatment of water. The temporary hardness caused by the carbonates and bicarbonates of calcium and magnesium can be removed by boiling or by adding lime. The permanent hardness is caused by the sulphates, chlorides and nitrates of calcium and magnesium, which can be removed by special methods of water softening like lime-soda, Zeolite, demineralization[41], electrodialysis[42,43] etc. Dissolved salts in water can be removed by methods like electrodialysis, reverse osmosis, freezing process, etc[41]. TDS in groundwater was observed below 2000 mg/l indicating that electrodialysis method can be used for treatment[41]. Electrodialysis is a compact machine, cost of buying and erecting the plant is small, easy to operate and can be started and stopped in a few minutes. This is an ideal machine for purifying water in a small town or at a remote place.

4. Conclusions

The analysis of water from 12 different borewell locations of KGF showed that TDS, EC, hardness, coliform bacteria, etc. exceeded the norms at most of the locations. Presence of sewer lines and septic tanks adjacent to borewells caused higher BOD and COD at some locations. Cyanide is nil in water samples.
Water quality index showed good water quality in monsoon and poor in summer because most of the parameters were within the norms in monsoon compared to other seasons. Its evaluation will not only be helpful to understand the seasonal quality of water but also has advantages for government agencies and institutions where regular water quality data is required. The model developed for WQI can be used to evaluate water quality for any season of the study area. Total hardness, magnesium hardness, DO, BOD, COD, turbidity, arsenic, nitrate and sulphate are the most influencing parameters. Hence testing of only these parameters will be sufficient for the evaluation of WQI.
Based on the results and analysis of water samples, it is recommended to use water only after boiling and filtering or by Reverse Osmosis treatment for drinking purpose by the individuals. For the treatment of water on large scale basis, it is suggested to install electrodialysis treatment plant at KGF. However, for other domestic purposes, water of different borewells can be used if the WQI shows status of water quality either good or excellent.

ACKNOWLEDGEMENTS

The authors are thankful to the Director, National Institute of Rock Mechanics (NIRM) for his technical guidance and in-house funding of this project. They are also grateful to Dr. G. R. Adhikari, Scientist & Head, Technical Coordination & Project Management Department, NIRM for his valuable comments.

References

[1]  Rao, S.M., and Reddy, B.V.V., 2006, Characterization of Kolar gold field mine tailings for cyanide and acid drainage., Geotech. Geol. Eng., 24 (6), 1545-1559.
[2]  P.A.K. Shettigher, Gold Production in India – Problems and Perspectives, Metals in India’s Development – The Vision of Jawaharlal Nehru, New Delhi, Ministry of Steel and Mines, Govt. of India, E.I.H. Press, Delhi, pp. 127-140, 1989.
[3]  Yadav, A.K., Khan, P. and Sharma S.K., 2010, Water quality index assessment of groundwater in Todaraisingh tehsil of Rajasthan State, India – A greener approach., E-J.Chem., 7(S1), S428-S432.
[4]  Kavitha, R. and Elangovan, K., 2010, Groundwater quality characteristics at Erode district, Tamilnadu, India., Int. J.Environ. Sci., 1 (2), 145-150.
[5]  Gibrilla, A., Osae, S., Akiti, T.T., Adomako, D., Ganyaglo, S.Y., Bam, E.P.K. and Hadisu, A., 2010, Hydrogeochemical and groundwater quality studies in the northern part of the Densu river basin of Ghana., J. Water Resource Prot., 2, 1071-1081.
[6]  American Public Health Association (APHA), Standard Methods for the Examination of Water and Wastewater, 18th ed., Washington D.C., USA, 1992.
[7]  Sisodia, R. and Moundiotiya, C., 2006, Assessment of the water quality index of wetland Kalakho lake, Rajasthan, India., J. Environ. Hydrol., 14, 1-11.
[8]  Kumar, A. and Dua, A., 2009, Water quality index for assessment of water quality of river Ravi at Madhopur (India)., Global J. Environ. Sci., 8(1), 49-57.
[9]  Sindhu, S.K. and Sharma, A., 2007, Study on some physico-chemical characteristics of ground water of district Rampur - A statistical approach., E-J.Chem., 4(2), 162-165.
[10]  Alobaidy, A.H.M.J., Abid, H.S. and Maulood, B.K., 2010, Application of water quality index for assessment of Dokan lake ecosystem, Kurdistan region, Iraq., J. Water Resource Prot., 2, 792-798.
[11]  Bureau of Indian Standard (BIS) for Drinking Water-Specification IS:10500, BIS, New Delhi, India, 1991.
[12]  A.K. De, Environmental Chemistry, 5th ed., New Age International Publishers, New Delhi, India, 2003.
[13]  World Health Organization (WHO), Guidelines for drinking water quality, Geneva, 1993.
[14]  Rao, G.S. and Rao, G.N., 2010, Study of groundwater quality in greater Visakhapatnam city, Andhra Pradesh (India)., J. Environ. Sci. Eng., 52 (2), 137-146.
[15]  D.K. Todd, Groundwater Hydrology, 2nd ed., John Wiley & Sons, Singapore, 1995.
[16]  Bhattacharjee, K.K. and Bhattacharyya, K.G., 2010, Baseline study of Siang river water in Pasighat, Arunachal Pradesh (India)., J. Environ. Sci. Eng., 52(2), 121-130.
[17]  Nasrullah, Naz, R., Bibi, H., Iqbal, M. and Durrani. M.I., 2006, Pollution load in industrial effluent and ground water of Gadoon Amazai Industrial Estate (Gaie) Swabi, NWFP., J. Agr. Biol. Sci., 1 (3), 18-24.
[18]  B. Kotaiah, and N.K. Swamy, Environmental Engineering Laboratory Manual, 1st ed., Charotar Publishing House, Anand, India, 1994.
[19]  Wavde, P.N. and Arjun, B., 2010, Groundwater quality assessment at Malegaon region of Nanded in Maharashtra (India)., J. Environ. Sci. Eng., 52 (1), 57-60.
[20]  S.K. Maiti, Handbook of Methods in Environmental Studies, Vol. 1: Water and Wastewater Analysis. ABD Publishers, Jaipur, India, 2001.
[21]  Raveen, R. & Daniel, M., 2010, Spatial changes in water quality of urban lakes in Chennai (India) – A case study., J. Environ. Sci. Eng., 52 (3), 259-264.
[22]  Ullah, R., Malik, R.N. and Qadir, A., 2009, Assessment of groundwater contamination in an industrial city, Sialkot, Pakistan, Afr. J. Environ. Sci. Technol., 3 (12), 429-446.
[23]  Muthulakshmi, L., Ramu, A. and Kannan, N., 2010, Assessment of groundwater quality in Virudhunagar district (India): A statistical approach., J. Environ. Sci. Eng., 52 (3), 229-234.
[24]  C.N. Sawyer and P.L. McCarty, Chemistry for Environmental Engineering,3rd ed., McGraw-Hill Book Company, New York, 1978.
[25]  National Environmental Engineering Research Institute (NEERI), Manual on Water and Wastewater Analysis, Nagpur, India, 1986.
[26]  Nas, B. and Berktay, A., 2006, Groundwater contamination by nitrates in the city of Konya, (Turkey): A GIS perspective., J. Environ. Manage., 79, 30-37.
[27]  Frost, F., Frank, D., Pierson, K., Woodruff, L., Raasina, B., Davis, R. and Davies, J., 1993, A seasonal study of arsenic in groundwater, Snohomish County, Washington, USA., Environ. Geochem. Health, 15 (4), 209-214.
[28]  Shahnawaz, Md. and Singh, K.M., 2009, Ground water quality of Piro and Jagdishpur blocks of Bhojpur District: A middle Gangatic plain., Int. J. Pharmaceutics Qual. Ass., 1 (1), 9-12.
[29]  Shah, M.C., Shilpkar, P.G. and Acharya, P.B., 2008, Ground water quality of Gandhinagar taluka, Gujarat, India., E-J.Chem., 5 (3), 435-446.
[30]  Patel, P. and Bhatt, S.A., 2010, Fluoride contamination in groundwater of Patan district, Gujarat, India., International Journal of Engineering Studies, 2 (2), 171-177.
[31]  Yisa, J. and Jimoh, T., 2010, Analytical studies on water quality index of river Landzu., Am. J. Applied Sci., 7(4), 453-458.
[32]  Mudgal, K.D., Kumari, M. and Sharma, D.K., 2009, Hydrochemical analysis of drinking water quality of Alwar district, Rajasthan., Naturesciencej., 7(2), 30-39.
[33]  Venkatesharaju, K., Ravikumar, P., Somashekar, R.K. and Prakash, K.L., 2010, Physico-chemical and bacteriological investigation on the river Cauvery of Kollegal stretch in Karnataka., Kathmandu University. J. Sci. Eng. Tech., 6 (1), 50-59.
[34]  Sundar, M.L. and Saseetharan, M.K., 2008, Ground water quality in Coimbatore, Tamil Nadu along Noyyal River., J. Environ. Sci. Eng., 50 (3), 187-190.
[35]  Patil, V.T. and Patil, P.R., 2010, Physicochemical analysis of selected groundwater samples of Amalner town in Jalgaon district, Maharashtra, India., E-J.Chem., 7 (1), 111-116.
[36]  Scheytt, T., 1997, Seasonal variations in groundwater chemistry near Lake Belau, Schleswig-Holstein, Northern Germany., Hydrogeol. J., 5 (2), 86-95.
[37]  Bangar, K.S., Tiwari, S.C., Verma, S.K. and Khandkar, U.R., 2008, Quality of ground water used for irrigation in Ujjain district of Madhya Pradesh, India., J. Environ. Sci. Eng., 50 (3), 179-186.
[38]  Abdalla, O.A.E., Suliman, F.O., Al-Ajmi, H., Al-Hosni, T. and Rollinson, H., 2010, Cyanide from gold mining and its effect on groundwater in arid areas, Yanqul mine of Oman., Environ. Earth. Sci., 60, 885–892.
[39]  Grivas, G. and Chaloulakou, A., 2006, Artificial neural network models for prediction of PM10 hourly concentrations, in the Greater area of Athens, Greece., Atmos. Environ., 40(7), 1216-1229.
[40]  D.C., Montgomery, E.A. Peck and G.G. Vining, Introduction to Linear Regression Analysis. John Wiley & Sons, Inc., New York, 2003.
[41]  S.K. Garg, Water Supply Engineering, Environmental Engineering Vol. 1, Khanna Publishers, New Delhi, India, 2006.
[42]  Hell, F., Lahnsteiner, J., Frischherz, H. and Baumgartner, G., 1998, Experience with full-scale electrodialysis for nitrate and hardness removal., Desalination, 117(1-3), 173-180.
[43]  Kabay, N., Demircioglu, M., Ersöz, E. and Kurucaovali, T., 2002, Removal of calcium and magnesium hardness by electrodialysis., Desalination 149, 343-349.