-
Paper Information
- Previous Paper
- Paper Submission
-
Journal Information
- About This Journal
- Editorial Board
- Current Issue
- Archive
- Author Guidelines
- Contact Us
American Journal of Environmental Engineering
p-ISSN: 2166-4633 e-ISSN: 2166-465X
2012; 2(1): 45-49
doi:10.5923/j.ajee.20120201.07
Quality Assessment of Aba River Using Heavy Metal Pollution Index
 Abstract
 Reference
 Full-Text PDF
 Full-text HTML
Amadi Akobundu N.
Department of Geology, Federal University of Technology, Minna
Correspondence to: Amadi Akobundu N., Department of Geology, Federal University of Technology, Minna.
| Email: |  |
Copyright © 2012 Scientific & Academic Publishing. All Rights Reserved.
Increased industrial expansion and population in Aba has lead to huge generation of wastes and their disposal has resulted to air, land and water pollution. This study examined the degree of heavy metal contamination of Aba River in southeastern Nigeria. Heavy metals such as Fe, Zn, Cu, Mn, Cr, Cd, As and Pb were analyzed using Atomic Absorption Spectrophotometer and the result compared with the Nigerian Standard for Drinking Water Quality. The pollution load index between the heavy metals in the river produced the following output: Fe > Zn > Cu > Mn > Ni > Cr > Pb > As > Cd. The metals exhibited a good linear correlation coefficient and the application of factor analysis on the data revealed three sources of pollution arising from the various human activities taking place along the river channel. The findings indicate that the water needs some degree of treatment before consumption and it also needs to be protected from the perils of contamination.
Keywords: Water Quality, Heavy Metal Pollution, Aba River
Cite this paper: Amadi Akobundu N., Quality Assessment of Aba River Using Heavy Metal Pollution Index, American Journal of Environmental Engineering, Vol. 2 No. 1, 2012, pp. 45-49. doi: 10.5923/j.ajee.20120201.07.
Article Outline
1. Introduction
- Rivers are by far the cheapest form of water supply compared to other sources like groundwater and seawater desalination. According to Amadi et al., (2010), meeting water quality expectations for streams and rivers is required to protect drinking water resources, encourage recreational activities and to provide a good environment for fish and wildlife. Therefore, water quality evaluation and management is of ecotoxicological importance. Changes in water chemistry of rivers are usually anthropogenic via domestic, industrial and agricultural discharges which may in turn results to degradation of the aquatic ecosystem (Ezigbo, 1989 and Amadi, 2010). The continuous drift of people to the urban centres aggravated the pollution of Aba River as it forms the effluent discharge point for industrial and agricultural waste by the heavy and light industries that flank both sides of the river along Aba-Port-Harcourt express way.Heavy metals are widespread pollutant of great environmental concern as they are non-degradable, toxic and persistent with serious ecological ramification on aquatic ecology (Jumbe and Nandini, 2009). Humans have always depended on aquatic resources for food, medicines and materials as well as recreational and commercial purposes such as fishing and tourism (Chopra et al., 2009). The urban aquatic ecosystem are strongly influenced by long term discharge of untreated domestic and industrial wastewater,storm water runoff, accidental spill (Sarika and Chandramohankumar, 2008) and direct solid waste dumping (Plate 1). All these released pollutant have a great ecological impact on the river water quality and its surrounding food web (Abhishek and Mishra, 2008; Hejabi and Belagali, 2009).Historically, Aba River takes its source from Okpu- Umuobu town, few kilometers away from Aba town (Ezigbo, 1989). It is used for domestic, agricultural and industrial purposes. Due to the poor sanitation habit of the populace and non enforcement of sanitation laws by government on offenders, the banks of the river now serves as toilet and refuse dumps at the river bank (Plate 1). Industries and laundry services located downstream near the river channel discharged their untreated effluent into the river’s floodplain without any apology and these unhealthy practices have the tendency of deteriorating the quality of the river, hence the need for a quality assessment of Aba River since it receive wastes on a daily bases due to urbanization and industrialization. The effects of industrial wastes, municipal wastes and agricultural runoff on the quality of Aba River was investigated in this study. The overall objective of this research work was to evaluate the extent to which the heavy metal arising from urban waste disposed along the river course has affected the river quality. Heavy metal pollution index was used to determine the pollution status of the river.
2. Materials and Methods
2.1. Location of Study Area
- Aba River is a tributary of Imo River and is the major river that passes through Aba town (Fig.1). It is situated between latitudes 5o05IN to 5o30IN of the Equator and Longitudes 7o15IE to 7o40IE of the Greenwich Meridian (Fig.1) and is characterized by relatively low elevation and near flat topography (Uma, 1989) which enhances its runoff. The River flows in North-South direction and joins the Imo River (Ezigbo, 1989). The river is recharged by precipitation and groundwater (Uma, 1989; Amadi et al., 2010).
2.2. Climate and Vegetation
- The study area falls within the humid tropical rainforest climate. The average rainfall for the area is about 2285 mm and falls from March to November (Uma, 1989). Most parts of the area are flooded during the rainy season due to poor drainage system and construction. The dry season in the area is from November to March and is characterized by dry, cold and windy weather, with little or no rainfall (Onyeagocha, 1980). The temperature is highest in December and lowest in February due to the harmattan. Palm trees, Raffia palms, bananas, plantain, cassava, yam, cocoyam and maize are grown abundantly in the area. The abundant rainfall and high temperature in the area favours their growth. The vegetation appears more forest-like along river channels and due to intense farming in the area, grasses are taking over the original tropical forest characteristic of the area.
2.3. Geology and Hydrogeology of the Area
- The study area is part of the Niger Delta Basin and is underlain by the Benin Formation of Miocene to Recent age. The formation is made up of very friable fine to coarse grained sand with minor intercalations of clay and gravel. The Benin Formation is composed mostly of high resistant fresh water bearing continental sand and gravel with clay and shale intercalations (Onyeagocha, 1980). The general thickness of the Benin Formation is variable and ranges from 200 m at the North-East end to about 2000 m at the South-west (Avbovbo, 1978).
3. Method of Investigation
- Eighteen sampling points were established along the Aba River course in order to give a comprehensive idea of overall quality of the river. This was monitored for a period of one year and six months by taking the sample once in every month. The selection of the sampling points was necessitated by accessibility, proximity to residential area and topography as these factors are responsible for the quantity and quality of wastes dumped into the river via anthropogenic means. The surface water samples were collected at mid-depth of the river using clean one litre plastic containers at each sampling point. The containers were rinsed thrice with the water to be collected and were stabilized with dilute HCl on collection. All the samples were preserved by refrigeration and analyzed within 24 hours of collection using spectrophotometric method. In this study, heavy metals such as Iron (Fe), Zinc (Zn), Copper (Cu), Cadmium (Cd), Chromium (Cr), Nickel (Ni), Manganese (Mn), Lead (Pb) and Arsenic (As) in Imo River were analyzed in accordance with American Public Health Association, (1995) standard for analyzing water and waste-water.The sampling points were geo-referenced using a hand held Global Positioning System (GPS, German 72 model) with position accuracy of less than 5 m. The information obtained was used in the generation of digital terrain model (Fig. 2) and contour map (Fig. 3) of the area using sulfer-8 software.
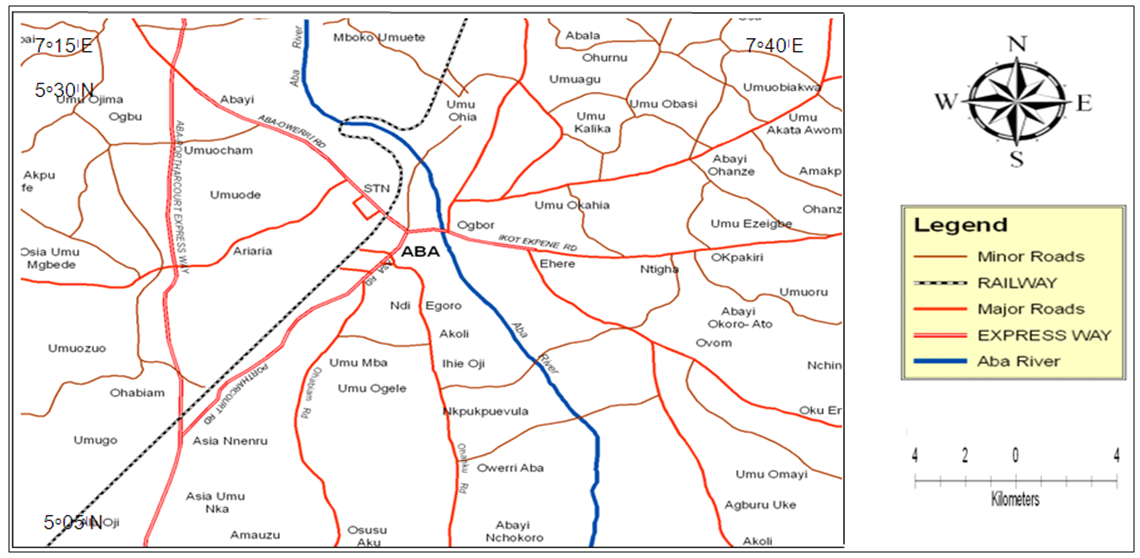 | Figure 1. Location map of the study area showing Aba River, major towns and road network (Source: NGSA, 2004) |
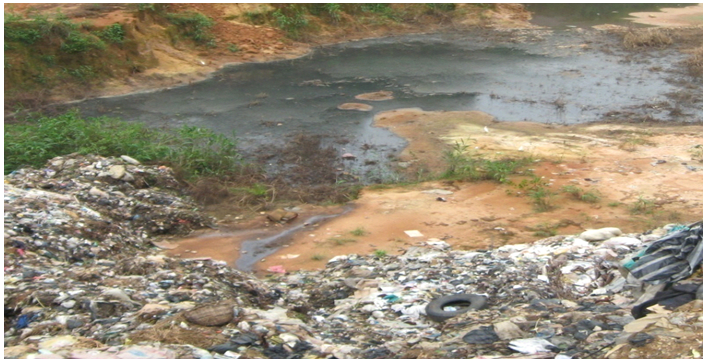 | Plate 1. Refuse dumped along the river channel (Source: Amadi, 2010) |
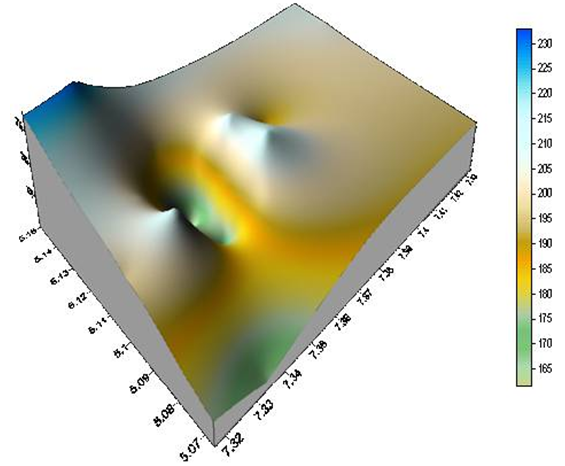 | Figure 2. Digital Terrain Model (DTM) of the area (Source: Amadi, 2010) |
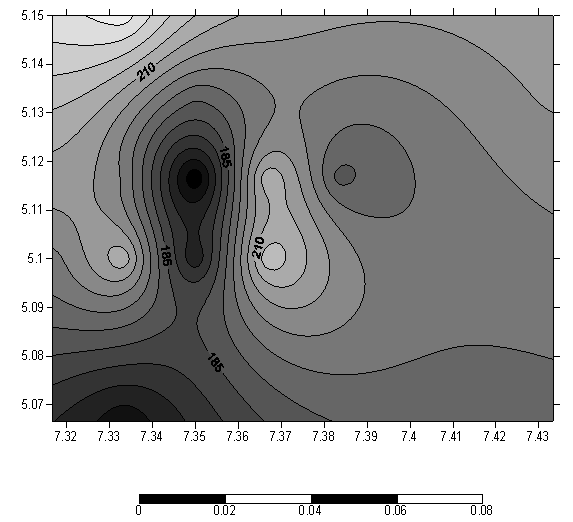 | Figure 3. Contour map of the area (Source: Amadi, 2010) |
3.1. Statistical Analysis
- In order to quantitatively evaluate heavy metal enrichment in the river, Pearson’s correlation analysis was applied to dataset. Factor Analysis (FA) was adopted to assist the interpretation of elemental data. This powerful method allows identifying the different ground of metals that correlate and thus can be considered as having a similar behavior and common origin (Tahri et al., 2005). It should be noted that parametric statistical tests require the data to be normally distributed. Therefore it was checked if the data collected from a population with normal distribution by applying Shapiro-Wilk’s test (significance level, α = 0.05). The non-normal data were transferred logarithmically to ensure normal distribution. All the statistical analyses were performed using SPSS-16 for Windows (release Ver. 11, Inc., Chicago, IL).
4. Results and Discussion
- Table 1 shows the mean values of the heavy metal concentrations while Correlation coefficient matrix of the heavy metals is contained in Table 2. A close look at Table 1 shows that the mean metal concentration of all the metals were slightly higher than the maximum permissible value for a safe drinking water postulated by the Nigerian Standard for Drinking Water Quality (NSDWQ, 2007) except Cd. The variability in range of all the metal distributions as compared with their respective means is an indication of a pollution of the river with that metal ion. The decreasing trend of average metal levels was as follows: Fe > Zn > Cu > Mn > Ni > Cr > Pb > As > Cd.The degree of linear association between any two or more of the water quality parameters, as measured by correlation coefficient is shown in Table 2. A very strong positive correlation exists between Fe, Cu and Zn as well as Pb (<0.01 level) thereby indicating same source. Similarly, Cd showed moderately positive correlation with Ni and Mn (0.05 level) and can also be attributed to same origin while the metals with negative correlation is an indication of distinctive sources for the metals in the river.
|
|
5. Conclusions and Recommendations
- Heavy metal contamination of Imo River was investigated in this study using heavy metal pollution index and the order of enrichment are: Cd > As > Pb > Cr > Ni > Mn > Cu > Zn > Fe. The data was subjected to correlation and factor analysis which yielded three factors representing three possible sources of pollution. Anthropogenic activities such as electroplating, soldering and battery charging activities, Rusting and decomposition of vehicle and machine scraps as well as discharge of untreated industrial effluent and laundry waste that takes place along the river course are the likely sources of the heavy metals in the river water. The water needs to be treated before consumption and the various human activities domiciled near the river should discontinue, preventing future and severe contamination of the river.
References
| [1] | A. N. Amadi, P. I. Olasehinde, E. A. Okosun and J. Yisa. Assessment of the water quality index of Otamiri and Oramiriukwa Rivers. Physics International, 2010, 1(2), 116 – 123 |
| [2] | H. I. Ezeigbo. Groundwater quality problems in parts of Imo State, Nigeria. Journal of Mining and Geology. 1989, 25 (1), 1-9 |
| [3] | A. N. Amadi. Effects of urbanization on groundwater quality: A case study of Port-Harcourt, Southern Nigeria. Natural and Applied Sciences Journal, 2010, 11(2): 143 – 152 |
| [4] | A. S. Jumbe, N. Nandini. Heavy metals assessment of wetlands around Peenya industrial area, Bangalore. Res. Environ. Life Sci., 2009, 2, 25 – 30 |
| [5] | A. K.Chopra, C. Pathak, G. Prasad. Scenario of heavy metal contamination in agricultural soil and its management. Journal of Applied Natural Sciences, 2009, 1, 99 – 108 |
| [6] | P. R. Sarika, R. Chandramohankumar. Geochemistry of heavy metals in the surficial sediments of mangroves of the southwest coast of India. Chem. Ecol., 2008, 24, 437 – 447 |
| [7] | M. Abhishek, V. K. Mishra. Bioaccumulation of heavy metals in crops irrigated with secondary treated sewage waste water in surrounding villages of Varanasi city. Res. Environ. Life Sci., 2008, 1: 103 – 108 |
| [8] | A. T. Hejabi, S. L. Belagali. Survey of trace metal contaminants in Sediments of Kabini River in the NanJangud industrial area, Mysore District. Nat. Environ. Pollut. Tec h., 2009, 8: 49 – 52 |
| [9] | K. O. Uma. Water resource of Owerri and its environs, Imo state, Nigeria, Journal of Mining and Geology, 1989, 22 (1&2), 57-64 |
| [10] | A. C. Onyeagocha. Petrography and depositional environment of the Benin Formation, Nigeria. Journal of Mining and Geology, 1980, 17, 147-151 |
| [11] | NGSA. Nigerian Geological Survey Agency. Modified location map of Aba town, Abia State, Southeastern Nigeria, 2004 |
| [12] | A. A. Avbovbo. Tertiary Lithostratigraphy of Niger Delta: Bulletin, American. Association Of Petroleum Geologist, 1978, 62, 297–306 |
| [13] | F. Tahri, M. Benya, E. I. Bounakla, J. J. Bilal. Multivariate analysis of heavy metal in soils, sediments and water in the region of Meknes, Central morocco. Environ. Monitor. Asses., 2005, 102: 405 – 417 |
| [14] | SPSS-16. Statistical Package for the Social Sciences. SPSS Inc. Chicago, USA, 2009 |
| [15] | NSDWQ. Nigerian Standard for Drinking Water Quality. Nigerian Industrial Standard, NIS:554, 2007, 13-14 |
| [16] | A. B. N. Jose, M. Crapez, J. J. McAlister, C.G. Vilela. Concentration and Bioavailability of heavy metals in sediments from Nitero’I Harbour (Guanabara bay/S.E. Brazil). J. coas. Res. 2005, 21,811 – 817 |
| [17] | B. Anglin-Brown, A. Armour-Brown, G. C. Lalor. Heavy metal pollution in Jamaica 1: Survey of cadmium, lead, and zinc concentration in the Kintyre and Hpoe flat districts. Environ. Geochem. Health, 1995, 17, 63 – 66 |
| [18] | M. N. Tijani, K. Jinno, Y. Hiroshiro. Environmental impact of heavy metal distribution in water and sediment of Ogunpa River, Ibadan area, southwestern Nigeria. J. Min. Geol. 2004, 40(1): 73 – 83 |
| [19] | K. Huang, S. Lin. Consequences and implication of heavy metal spatial in sediments of Keelung River drainage basin, Taiwan. Chemosp. 2003, 53: 1113 – 1121 |
| [20] | J. Yisa, T. Jimoh. Analytical studies on water quality index of River Landzu. American Journal of Applied Sciences, 2010, 7, 453 – 458 |
| [21] | M. Singh, G. Muller, I. B. Singh. Heavy metals in freshly deposited stream sediment of rivers associated with urbanization of the Ganga plain, India. Water Air Soil Pollut., 2002, 141, 35 – 54 |