American Journal of Environmental Engineering

p-ISSN: 2166-4633    e-ISSN: 2166-465X

2012;  2(1): 34-44

doi:10.5923/j.ajee.20120201.06

Spatial Variability of Some Chemical and Physical Soil Properties in Nesho Mountainous Rangelands

H. Kavianpoor1, A. Esmali Ouri1, Z. Jafarian Jeloudar2, A. Kavian2

1Dept. Rangeland and Watershed Management, University of Mohaghegh Ardabili, Ardabil, P. O. Box: 179, Iran

2Dept. Rangeland and Watershed Management, Natural Resources Faculty, Sari Agricultural Sciences and Natural Resources University, Sari, P. O. Box: 737, Iran

Correspondence to: A. Esmali Ouri, Dept. Rangeland and Watershed Management, University of Mohaghegh Ardabili, Ardabil, P. O. Box: 179, Iran.

Email:

Copyright © 2012 Scientific & Academic Publishing. All Rights Reserved.

Abstract

Soil is a suitable place for vegetation and plant growth, while this valuable investment is not preserved, shortage of food, erosion and damage natural resources will be respected. Soil is a heterogeneous, diverse and dynamic system and investigation of its temporal and spatial changes is essential. In this paper spatial variability of some chemical and physical soil properties were investigated in mountainous rangelands of Nesho, Mazandaran province, Iran. From the study area 110 soil samples were sampled by a systematic sampling strategy at 0 to 30 cm depth below the surface on a regular grid spacing of 30 × 30 m2 with different vegetation cover and all the samples were transported to laboratory. Then soil chemical and physical parameters including Acidity (pH), Electrical conductivity, CaCO3, Bulk density, Particle density, total phosphorus, total Nitrogen, available potassium, Organic matter, Saturation moisture, Soil texture (percentage of sand, silt and clay), Sodium, Calcium, magnesium were measured in laboratory. After data normalization, classical statistical analysis were used to describe soil properties and geo-statistical analysis were used to illustrate spatial correlation of soil characteristics and by using interpolating techniques of maps spatial distribution of these properties was prepared. Results indicated that in the study area saturation moisture and percentage of Sand had highest and lowest spatial correlation respectively.

Keywords: SpatialVariability, Chemical And Physical Soil Properties, Nesho Rangeland

Cite this paper: H. Kavianpoor, A. Esmali Ouri, Z. Jafarian Jeloudar, A. Kavian, Spatial Variability of Some Chemical and Physical Soil Properties in Nesho Mountainous Rangelands, American Journal of Environmental Engineering, Vol. 2 No. 1, 2012, pp. 34-44. doi: 10.5923/j.ajee.20120201.06.

1. Introduction

The spatial variability and geographical heterogeneity of physical and chemical properties of rangeland ecosystems soils are under physical and biological factors impact including topography, vegetation cover, soil microclimate, various grazing systems and rangeland management (Chaneton and Avado, 1996). Soil properties change in time and space continuously (Rogerio et al., 2006). Heterogeneity may be occurred at large scale (region) or at small scale (community), even in the same type of soil or in the same community (Du Feng et al., 2008). Despite the temporal and spatial changes of soil characteristics in small and large scales, awareness of how are these changes for increasing profitability and sustainable agriculture management, is necessary (Ayoubi, 2008). Spatial changes and heterogeneous geographical distribution of chemical and physical properties of soils in rangeland ecosystem are influenced by a set of biological and physical factors including topography, vegetation, soil microclimate, different grazing systems andvarious rangeland Management(Chaneton andAvado,1996). Distribution of Vegetation is related to soil moisture and other soil properties such as soil ventilation, soil texture, depth etc., and soil properties in relation tovegetation cover cause plant diversity and widespread geographical distribution of plants (Noy-Mire, 1973; Burke, 2001). Soil compaction following heavy grazing cause homogenous spatial distribution of soil properties and increase vulnerability of soil, water and soil loss, and consequently reduce available water for plants and production of rangeland (Ying Zhao et al., 2007). Cheng et al. (2007) reported that spatial variability of aboveground biomass in shrub lands is greater than grasslands. There is clear special spatial relationship between plant and soil (Etemaand Wardle, 2002; Covelo et al., 2008; Zhao et al., 2007). Determining soil variability is important for ecological modeling, environmental predictions, precise agriculture and management of natural resources (Hangsheng et al., 2005; Wang, 2009). For a long time, spatial changes of soil characteristics have been attended by soil scientists and also nowadays the access means to precise and quantitative information about these changes is essential for environmental assessment of soil quality, risk of soil pollution and retro gradation of soil characteristics and soil erosion studies as a part of environment and non-agricultural interpretations of soils has new challenges against soil scientists. Soil organic matter, nitrogen and phosphorus are the most important functions of ecosystems because they play a direct role in ecosystem processes such as plant growth and carbon cycle (Roberston et al., 1988). Organic matter is one of the most indexes of soil quality, thus investigation of changes and spatial distribution of organic carbon can be useful for evaluation of soil function and understanding of soil carbon decomposition processes and determination of soil quality changes trends (Wood, 1998;Venteris et al., 2004). Temporal and spatial investigation of data is essential for understanding of soil spatial variability. Kersic (1997) knew geo-statistics technique as the most confident, strongest and widest method for interpolation and has acknowledged that geo-statistics is the strategy that considers spatial variance, location and distribution of samples. Geo-statistics is a powerful tool for determining the spatial variability (Sauer et al., 2006). Geo-statistical methods use mathematical and statistical functions for interpolation and their basis is statistical characteristics of data. This technique predicts unknown points based on autocorrelation and their spatial structure of measured points (Ghahroodi, 2006). Soil properties maps show their spatial changes well. Different methods exist for creating soil properties maps that one of them is gathering samples from soil depths and analyze the samples by using geo-statistics technique and regional theory (Hunter and et al, 1982). Since the part of variations are caused by a number of randomly occurring events and other part is related to the distance, geo-statistics lead us to more accurate estimations with less error (Adriana, 2007). In fact geo-statistics investigate the variables that have spatial structure (Hassani Pak, 2007) or continuous spatial distribution. Early principal of geo-statistics is that the similarity between near samples decreases when the distance increases (IsaakandSrivastava 1989;Goovaerts 1997). Many studies have shown the correlation between soil characteristics like organic matterand the results were illustrated in map (Jian-Bing et al., 2006; Zhang and McGrans, 2004; Fennessy and Mitsch, 2001; Anderson et al., 2005). Zhao (2007) reported that spatial variability of soil chemical and physical properties are affected by graze intensity and heavy grazing decreases soil water content () and soil organic carbon (SOC) but increases bulk density (BD) and shear strength (SS). Mohammadi and RaeisiGahrooei (2003) showed that spatial variation pattern of soil variables absolutely depends exactly on rangeland management history. Variogram of organic matter at grazing site has linear structure and does not access to threshold variance in attention to regional scale. While the spatial pattern of this variable at enclosure site has strong structure and determined threshold variance. Fennessy and Mitsch (2001) evaluated spatial distribution of soil properties in 2 year period. They found that the spatial variability of organic matter and total nutrient of soil had decreased in this period. Yong et al. (2006) investigated soil properties and their spatial pattern in a sandy grassland and reported that continuous grazing lead to decrease spatial dependence of soil organic carbon and total nitrogen at sandy hills. According to recent studies and confirmation of special spatial relation between soil properties and plant at different ecosystems like rangelands, knowledge of soil spatial variability for application purposes is necessary as well as model development (Søvik and Aagaard, 2003). This research was done to investigate spatial variability of some chemical and physical soil properties in mountainous rangelands.

2. Material and Methods

Study area
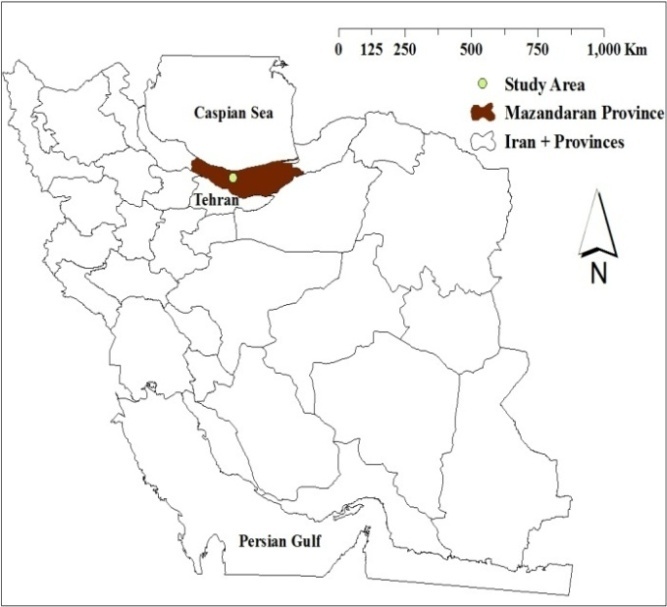
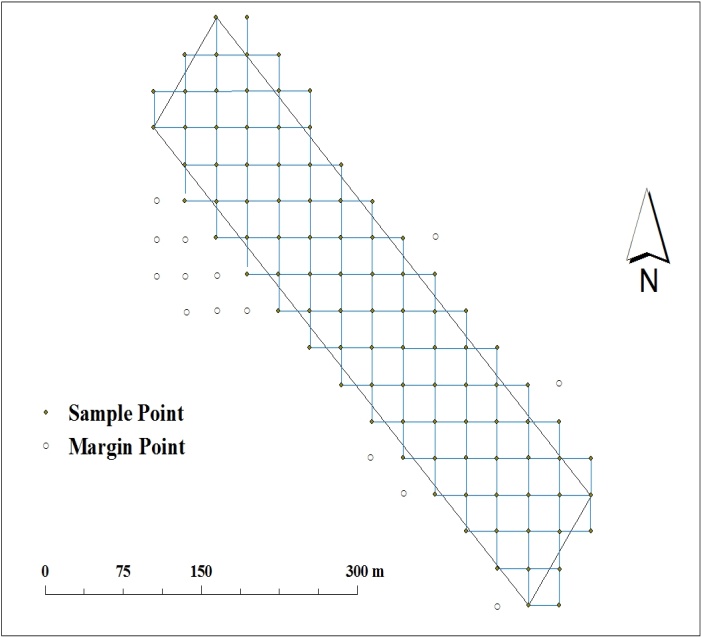
The study area is located at central Alborz zone, Mazandaran province Northern Iran and 40 km south of Ruyan county (50° 08'00" E to 50° 08'17" and 36° 21'49" N to 36° 22'04"). It has 1700 m altitude above sea surface and 6 ha area (Figures 1 and 2). The land use of this area was forest that was transformed to rangeland about 30 year ago. The climate is cold-mountain based on Embergermethod with mean annual precipitation of 253 mm, mostly falling in the winter, autumn and spring. Minimum and maximum monthly mean temperatures were -4.1 and 28.4 in January and August respectively. The annual mean temperature is 12.17 ◦C. Nesho village is surrounded by forest from each side.
Sampling
A sampling site was selected in Nesho rangelands. Soil samples were sampled by a systematic sampling strategy at 0 to 30 cm depth below the surface on a regular grid spacing of 30 × 30 m2 from 0-30 cm depth. 96 points were selected and also 14 marginal points were added to increase the accuracy of research (110 soil samples in total). The UTM coordinates of soil samples were recorded for using in spatial analysis of soil characteristics.
Laboratory analysis
The samples were air-dried and passed through a 2 mm sieve to prepare them for experiments. The methods that were applied were: hydrometer method for soil texture (Jacob and Clark, 2002), Kjeldahl method for total nitrogen (Bremner and Mulvaney, 1982), and the modified Walkley- Black wet oxidation procedure for organic carbon content. Multiplying the soil organiccarbon by 1.72 resulted in soil organic matter (Nelson and Sommers, 1982). Titration method with EDTA solution were used for measuring Calcium and Magnesium (Lanyon and Heald, 1982), Pycnometer method for Particle density (Jacob and Clark, 2002), sampling cylinder method for Bulk density (Jacob and Clark, 2002) and also soil pH and electrical conductivity (EC) were measured in saturated mud and saturated extract, respectively (McLean, 1982). Saturated moisture was determined from saturated mud and weighing method (McLean, 1982). CaCO3 was measured by Titration method with I N NAOH (Nelson, 1982). The amount of Phosphorus that exists in extracts of soil was determined by Spectrophotometer (Olsen and Sommers, 1982). Absorbable K and Na after extraction were measured using 1 N ammonium acetate (pH= 7) (Knudsen, Peterson, and Pratt 1982). Apparent density and soil actual density were measured applying sampling cylinders and Pichnometer respectively (Jacob and Clarke, 2002), also calcium and magnesium were measured using titration method with EDTA solution (Lanyon and Heald, 1982).
Spatial analysis of data
At first in order to recognize how data is distributed and accessing to statistical information summary, each soil characteristics were investigated using descriptive statistics. Geo-statistics was used to investigate spatial variability of soil properties. In geo-statistical studies, abnormal distribution of data have such effects that may lead to high fluctuations in variograms and reduces the reliability of analytical results, thus normalization of data is necessary. Normal distribution of data was estimated based on their skew ness, to this case that the data with a range of -1 to +1 skew ness were considered as normally distributed data (Virgilio et al., 2007;PazGonzales et al., 2000). This method is widely used in the analysis of soil ecological heterogeneity (Schlesinger et al., 1996). Since nitrogen and phosphorus had skew ness coefficient greater than 1, after elimination of imperfect data, Logarithmic conversion was chosen as the best method (Webster and Oliver, 2001). For every variable before implementing geo-statistics analysis, with drawing of different directions variograms, isotropy and anisotropy of each soil variable were controlled. Geo-statistics is based on spatial correlation between observations or samples and this correlation can be expressed with mathematical model which called "variogram". In fact, variogram is defined as functions which describe spatial variations of one variable (Hassani Pak, 2007) and is defined by following formula:
(1)
N (h) is the number of sample pairs that are located by a particular distance (h) from each other. Z (xi) and Z (xi+ h) are the values of regionalized variable at location xi and xi+ h respectively.
Figure 1. Geographical position of study area
After calculating the experienced variogram, fitting a theoretical model is necessary to generalization of deductionand estimation of variables in points where not have beensampled. In the next spatial interpolation and spatial map ping of soil characteristics Kriging method was used. OverallKriging method is a statistical estimator that gives statistical weight to each observation so their linear structure's has been unbiased and has minimum estimation variance (Kumke et al., 2005). This estimator has high application due to minimizing of error variance with unbiased estimation (Polhaman, 1993).
Figure 2. Used regulars sampling pattern in this study
(2)
Where, Z*(XO) is, estimated variable at XO location and Z*(XO) is values of investigated variable at Xi location and λi is the statistical weight that is given to Z (Xi) sample located near XO. N is the number of observations in the neighborhood of estimated point. Accuracy assessment of interpolation was done by using Cross-validation methods (Goovaerts, 1997). The software package GS+ version 5.1 was also used for geo-statistical analysis (Gamma Design Software, MI, USA).

3. Results

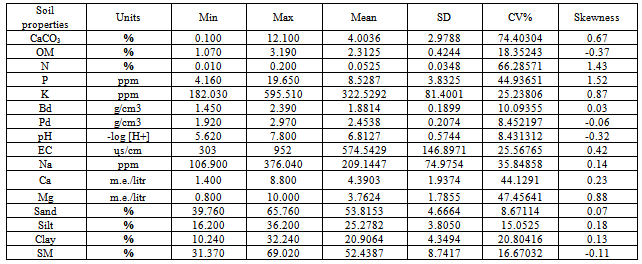
Table 1 shows the summary statistics of soil characteristics. Coefficient variation is used to show total changes. According to Table 1, pH and CaCO3 had lowest and highest coefficient variation respectively.
Table 1. Summary statistics of soil properties in the study area
     
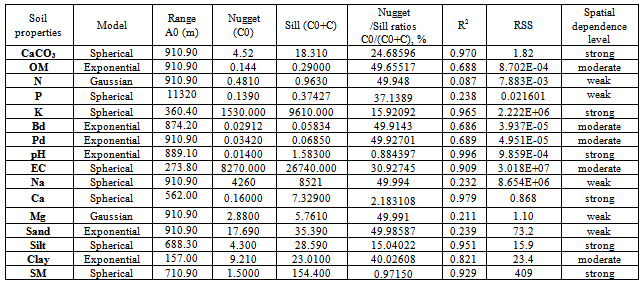
Table 2. Calculated semi-variograms properties of soil factors
     
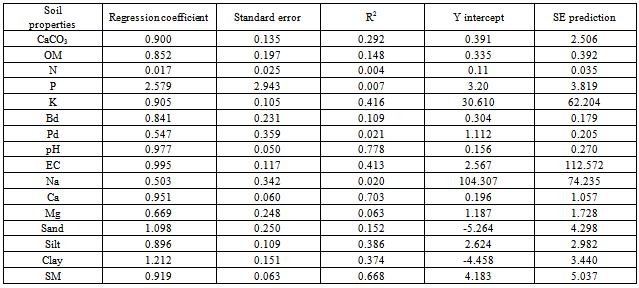
Table 3. Results of assessment using cross validation
     
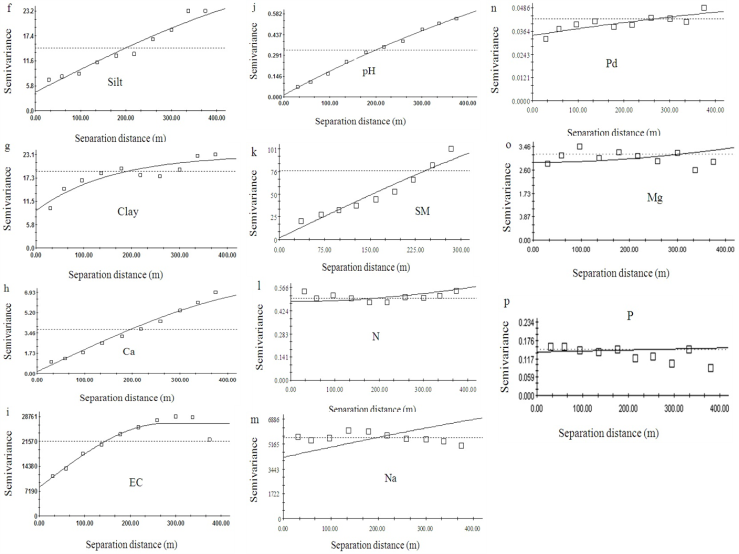
Presented models in Table 2 were selected from fitted models to soil characteristics because had less residual sum of squares and better structure. Suitable model for soil characteristics was isotropic. Results showed that CaCO3, organic matter, nitrogen, phosphorus, particle density, magnesium and sand had highest effective range with 910.900 meter and clay, with 157 meter had minimum effective range between the studied characteristics of soils.
In the study area the spatial dependence of soil characteristics was different. Nitrogen, phosphorus, sodium, magnesium, and sand had weak, organic matter, bulk density, particle density, electrical conductivity and clay had moderate, and CaCO3, available potassium, pH, calcium, silt and saturated moistures had strong spatial dependence in the study area.
Assessment of fitted models showed that models of phosphorus, clay and sand content had a higher regression coefficient and thus more accuracy (Table 3).
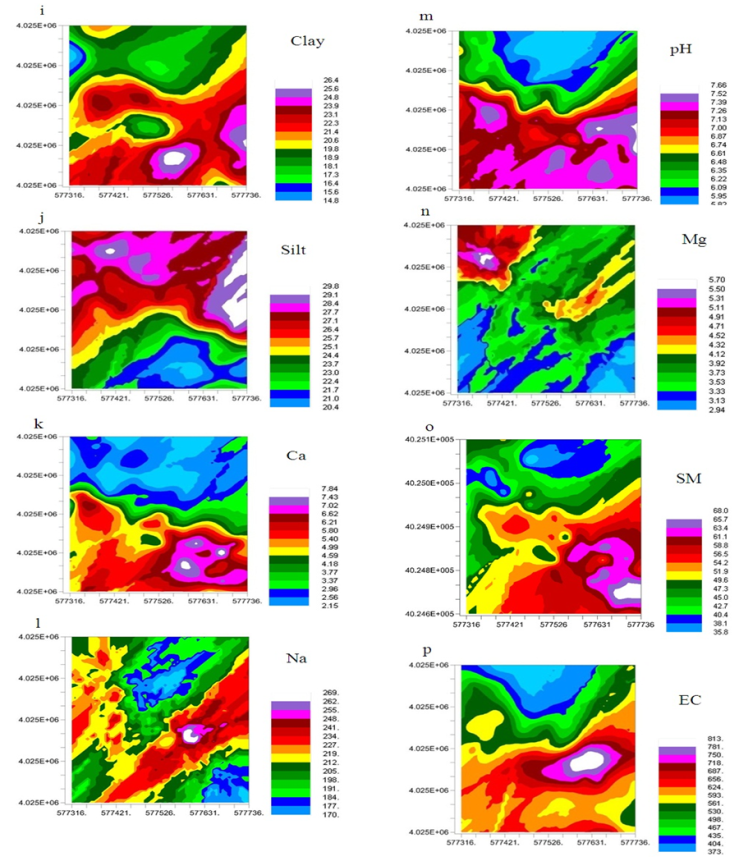
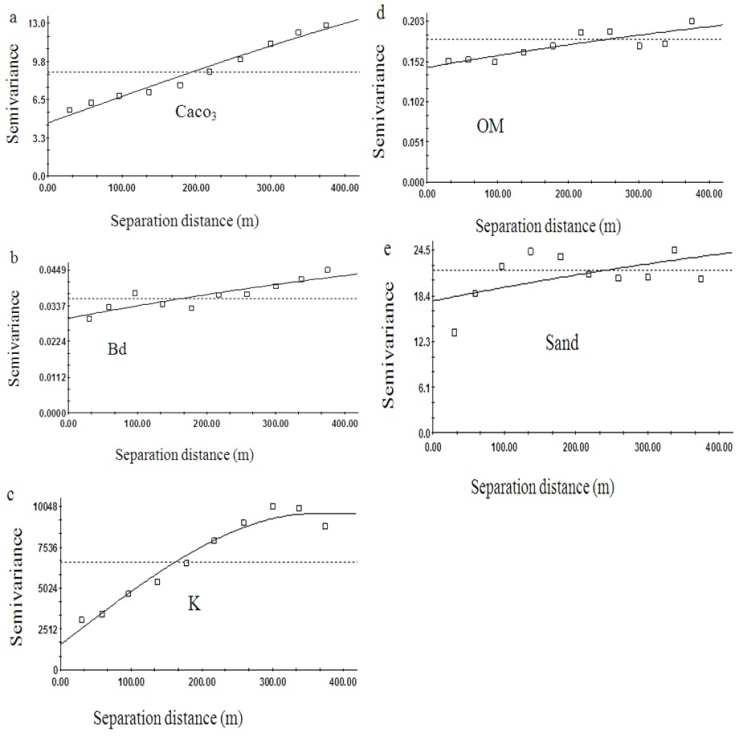
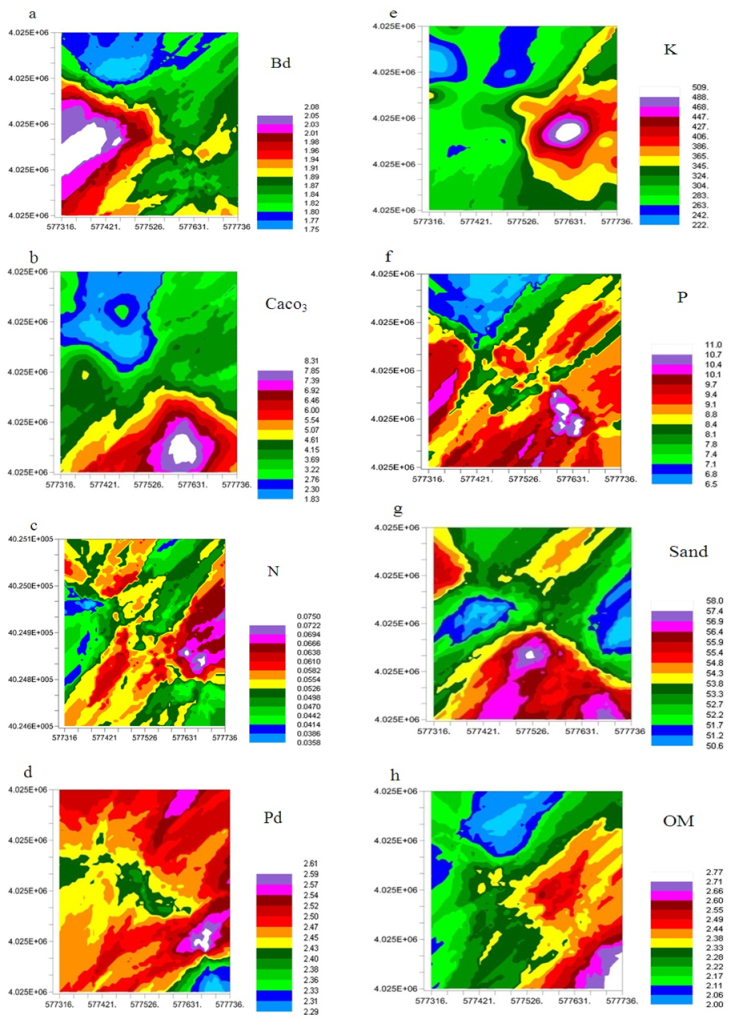
Semi-variograms and maps of soil characteristics presented in figures 3 and 4.
Figure 3. Semi-variograms of (a) CaCO3, (b) Bd, (c) K, (d) OM, (e) Sand, (f) Silt, (g) Clay, (h) Ca, (i) EC, (j) pH, (k) SM, (l) N, (m) Na, (n) Pd, (o) Mg, and (p) P. Described parameters are Bd, Bulk density; K, Potassium; OM, Organic matter and Sand, Sand content; Silt, Silt content; Clay, Clay content; EC, Electrical conductivity; SM, Saturation moisture; N, Nitrogen; Na, Sodium; Pd, Particle density; Mg, Magnesium and P, Phosphorus
Figure 3. Continued
Figure 4. Ordinary kriged maps of (a) Bd, (b) CaCO3, (c) N, (d) Pd, (e) K, (f) P, (g) Sand content, (h) OM,(i) Clay, (j) Silt, (k) Ca, (l) Na, (m) pH, (n) Mg, (o) SM, and (p) EC. Described parameters are Bd, bulk density; Pd, Particle density; N, Nitrogen; P, Phosphorus; K, Potassium; OM, Organic matter; Sand, Sand content. Silt, Silt content.; Clay, Clay content; Na, Sodium; Ca, Calcium; Mg, magnesium; EC, Electrical conductivity and SM, Saturation moisture
Figure 4. Continued

4. Discussion and Conclusions

Sampling method was systematic with equal distances between soil samples in this study.Random sampling can generate points that are very close together so decreases accuracy of these studies (Weindorf and Zhu, 2010). Davatgar (1998) reported whatever variables have been more randomly distributed and samples have been less continuous, nugget effect of variogram increases and precision of interpolation decreases. Also, Wang and Qi (1998) and McBratney and Webster (1983) expressed that a systematic sampling pattern provide more accurate results than random sampling pattern, and precision increased with addition sample size. plotted variograms on different directions including 0, 45, 135 degrees for all soil variables in this study showed that effective range and sill of variograms were uniform and there was no clear anisotropy, also soil properties were recognized isotropic. This shows the variability of variables is equal in different directions and changes depend on distance between samples (Mohammadzamani et al., 2007). The ratio of nugget to sill (C0/C0+C) reflects the spatial autocorrelation generally (Li and Reynolds, 1995). If it is less than or equal to 25%, spatial dependent of variable is strong, if the ratio is between 25 and 75%, spatial dependent of variable is moderate and if it is greater than 75%, spatial dependent of variable is weak (Cambardella et al., 1994). Among the investigated variables in this study, CaCO3 had highest Coefficient of variation with % 74.40. This result is consistent with the research of Jafarian et al. (2009). pH had lowest coefficient variation with % 8.43, which could be because of the uniform conditions in the region such as small changes in slope and its direction that led to uniformity of soil in this region. Cambardella et al. (1994), Kamare et al. (2010), Afshar et al. (2009) and Yi-chang et al. (2009) found similar results. Nitrogen, phosphorus, sodium, magnesium and sand had a weak spatial dependence because the fitted R2 was less than 0.50(Emadi, 2008). Silt percentage, available potassium and acidity (pH) had strong spatial dependence according to results of Cambardella et al. (1994), Lopez-granados et al. (2002) and Weindorf and Zhu(2010). Bulk density had moderate spatial dependence similar to what had been illustrated in research of Cambardella et al. (1994) and Jafarian et al. (2009) also organic matter had moderate spatial dependence according to results of Yi-chang et al. (2009). Variables with strong spatial structure and very low nugget effect have high continuous distribution in this area. Strong spatial dependence can be controlled through the inherent variability of soil properties such as soil texture, mineralogy and less spatial dependence by non-intrinsic factors such as grazing (Cambardella et al., 1994). Semivariograms have difference forms depending on the quality of data and the distance between samples (Davatgar et al., 2000). The results showed spatial distribution of clay content can be described with spherical model according to results of Vasques et al. (2010),Weindorf and Zhu (2010),Jian-Bing Wei et al. (2008)and Jafarian et al. (2009).Organic matter can be described with exponential model according to results of Jian-Bing et al. (2006). Available potassium can be expressed with spherical method as had been showed in research of Yi-chang, et al. (2009), Mohammadi and RaeisiGahrooei(2003). The value of nugget effect for pH, bulk density and saturated moisture is small which suggest that the random variance of variables is low in the study area.This means that near and away samples have similar and different values respectively. In other words, a small nugget effect and close to zero indicates a spatial continuity between the neighboring points. Results of Vieira and Paz Gonzalez (2003), Mohammad Zamani et al. (2007) showed that variogram of nitrogen had very small nugget effect equal to 0.006. Kamare et al. (2010), Afshar et al. (2009) and Jian-Bing Wei et al. (2008) reported that nugget effect of clay content; electrical conductivity and bulk density were 0.01, 0.0008 and 0.00308 respectively. The larger effective range has more widespread spatial structure and this expansion will increase the virtual range which can be used to estimate the amount of regional variable at unknown points (HasaniPak, 2007). Effective range of some soil properties including CaCO3, organic matter, nitrogen, phosphorus, bulk density, magnesium and sand content were higher than others which probably is due to same impact of intrinsic processes on these soil characteristics. Spatial structure of these parameters have been more widespread rather than others and also in sampling design, one can extend sampling interval up to effective range. The effective ranges were 157- in this study which represents an increase in soil heterogeneity or potential of retrospection processes. The results of this study can be used to make recommendations of best management and modeling of soil and plant relationships in future studies.

References

[1]  Adriana, L. D., 2007, On the use of soil hydraulic conductivity functions in the field, Soil Science, 93, 162-170
[2]  Afshar, H., Salehi, M. H., Mohammadi, J., and Mehnatkesh, A., 2009, Spatial variability of soil properties and irrigated wheat yield in quantitative suitability map, a case study: Share e Kian Area, ChaharmahalevaBakhtiari province, Journal of water and soil, 23 (1), 161-172
[3]  Anderson, C.J., Mitsch, W.J. and Nairn, R.W., 2005, Temporal and spatial development of surface soil conditions at two created riverine marshes, J. Environ. Qual, 34,2072-2081
[4]  Ayoubi S., and Khormali, F., 2009, Spatial Variability of Soil Surface Nutrients Using Principal Component Analysis and Geostatistics: A Case Study of Appaipally Village, Andhra Pradesh, India JWSS, Isfahan University of Technology, 12 (46), 609-622
[5]  Bremner, J. M., and Mulvaney, C. S., 1982. Nitrogen total. P. 595-624. In A. L. Page (ed.), Methods of soil analysis. Agron. No. 9, Part 2: Chemical and microbiological properties, 2nd ed., Am. Soc. Agron., Madison, WI, USA
[6]  Burke, A., 2001, Classification and ordination of plant communities of the Nauklaft mountain, Namibia, Journal of Vegetation Science, 12, 53-60
[7]  Cambardella, C.A., Moorman, T. B., Parkin, T. B., Karlen, D.L. Turco. R .F. and Konopka. A. E., 1994, Field scale variability of soil properties in Central Iowa soils, Soil Sci. Soc. Am. J., 58, 1501-1511
[8]  Chaneton, E.J., and Avado, R.S.L., 1996, Soil nutrients and salinity after long-term grazing exclusion in flooding pama grassland, J. Range management, 49, 182-187
[9]  Cheng, X., An, S., Chen, J., Li, B., Liu, Y., and Liu, S., 2007, Spatial relationships among species, above-ground biomass, N, and P in degraded grasslands in Ordos Plateau, northwestern China, Journal of Arid Environments, 68, 652–667
[10]  Covelo, F., Rodríguez, A., and Gallardo, A., 2008, Spatial pattern and scale of leaf N and P resorption efficiency and proficiencyin a Quercusrobur population, Plant Soil, 311,109–119
[11]  Davatgar, N., 1998. Investigation spatial variability of some soil characteristics. Ms.c Thesis, Faculty of agriculture, Tabriz University, 108 pp
[12]  Davatgar, N., Neyshabouri, M. R., and Moghaddam, M.R., 2001, The Analysis of information obtained from soil variables map by use of semivariogram models. Iranian Journal of agricultural sciences, 31(4), 725-735
[13]  Du Feng, L.Z., XuXuexuan, Z.X., and Shan L., 2008, Spatial heterogeneity of soil nutrients and aboveground biomass in abandoned old-fields of Loess Hilly region in Northern Shaanxi, China. ActaEcologicaSinica, 28(1), 13−22
[14]  Emadi, M., Baghernejad, M., Emadi M., and Maftoun, M., 2008, Assessment of some soil properties by spatial variability in saline and sodic soils in Arsanjan plain, southern Iran, Pakistan Journal of Biological Sciences, 11 (2), 238-243
[15]  Etema, C., and Wardle, D.A., 2002, Spatial soil ecology. Trends in Ecology & Evolution, 17, 177-183
[16]  Fennessy, M.S., and Mitsch, W.J., 2001, Effects of hydrology and spatial patterns of soil development in created riparian wetlands, Wetlands Ecol. Manage., 94,103-120
[17]  Goovaerts, P., 1997, Geostatistics for natural resources evaluation. Oxford University Press, New York. 483 p
[18]  Hangsheng L., Dan W., Jay B., and Larry W., 2005, Assessment of soil spatial variability at multiple scales. Ecological Modelling 182, 271–290
[19]  Hassanipak, A. A., Geostatistics, 2007, Tehran University Press, 314 pp
[20]  Hunter, R. B., Romeny, E. M., and Wallace, A., 1982, Nitrate distribution in Majava Desert soils, Soil Science, 134, 22-30
[21]  Isaaks, E.H., and Srivastava, R.M., 1989, An introduction to applied geostatistics. Oxford University Press, New York. 561p
[22]  Jacob, H., and Clarke, G., 2002, Methods of Soil Analysis, Part 4, Physical Method, Soil Science Society of America, Inc, Madison, Wisconsin, USA, 1692 p
[23]  JafarianJeloudar, Z., Arzani, H., Jafari. M., Kelarestaghi, A., Zahedi, Gh., and Azarnivand, H. 2009, Spatial distribution of soil properties using geostatistical methods in Rineh rangeland, Rangeland journal, 3 (1), 120-137
[24]  Jian-Bing, W., Du-Ning, X., Xing-Yi, Z., Xiu-Zhen, L., and Xiao-Yu, L., 2006, Spatial Variability of Soil Organic Carbon in Relation to Environmental Factors of a Typical Small Watershed in the Black Soil Region, Northeast China, Environmental Monitoring and Assessment, 121, 597–613
[25]  Jian-Bing W., Du-Ning X., Hui Z., and Yi-Kun F., 2008, Spatial variability of soil properties in relation to land use and topography in a typical small watershed of the black soil region, northeastern China. Environ. Geol., 53,1663–1672
[26]  Kamare, R., 2010, Spatial variability of production, density and canopy cover percentage of Nitrariaschoberi L. in Meyghan Playa of Arak by using geostatistical methods, Ms.c Thesis, TarbiatModares University, 76 pp
[27]  Kresic, N., 1997, Hydrogeology and Groundwater Modeling. Lewis Publishers
[28]  Kumke, T., Schoonderwaldt, A., and Kienel, U., 2005, Spatial variability of sedimentological properties in a large Siberian lake, Aquatic Sciences, 67, 86–96
[29]  Knudsen, D., Peterson, G. A. and Pratt, P. F., 1982, Lithium, sodium, potassium. In Methods of soil analysis, part 2, ed. A. L. Page. Madison, Wisc.: ASA-SSSA
[30]  Lanyon, LE, and Heald, W.R., 1982. Magnesium, calcium, strontium and barium. In: Methods of soil analysis. Part 22nd ed. Page AL, Miller RH, Keeney DR (Eds). Agronomy No. 9 American Society of Agronomy, Madison WI, pp. 247-262
[31]  Li, H. B., and Reynolds, J. F., 1995, On definition and quantification of heterogeneity, Oikos, 73, 280–284
[32]  Lopez-Granados, F., Jurado-Exposito, M., Atenciano, S., Garcia-Ferrer, A., De la Orden, M. S., and Garcia-Torres, L., 2002, Spatial variability of agricultural soil parameters in southern Spain, Plant and Soil, 246, 97-105
[33]  McBratney, A.B., and Webster, R., 1983, Optimal interpolation and isarithm mapping of soil properties. V. Coregionalization and multiple sampling strategy. European J. Soil Sci, 34,137-162
[34]  McLean, E. O., 1982, Soil pH and lime requirement. In Methods of soil analysis, part 2, ed. A. L. Page. Madison, Wisc.: ASA-SSSA
[35]  Mohammadi, J., and RaeisiGahrooee, F., 2004, Fractal Description of the Impact of Long-term Grazing Exclusion on Spatial Variability of Some Soil Chemical Properties JWSS - Isfahan University of Technology, 7 (4), 25-37
[36]  Mohammadzamani, S., Auubi, S., and Khormali, F., 2007, Investigation of spatial variability soil properties and wheat production in some of farmland of sorkhkalateh of Golestan province, Journal of Science and technical Agriculture and Natural Recourses, 11(40), 79-91
[37]  Nelson, D. W., and Sommers, L. E., 1982, Total carbon and organic matter. In Methods of soil analysis, part 2, ed. A. L. Page. Madison, Wisc.: ASA-SSSA
[38]  Nelson, R.E., 1982, Carbonate and gypsum. In A.L Page, ed. 1982. Methods of soil analysis, Part 2: Chemical and microbiological properties, 2nd edition. Agronomy Monograph No. 9, American Society of Agronomy, Madison, WI
[39]  Noy-Mire, I., 1973, Multivariate analysis of the semi-arid vegetation of southern Australia. II. Vegetation catena and environmental gradients. Australian Journal of Botany, 22, 15-40
[40]  Olsen, S. R., and Sommers, L. E., 1982, Phosphorus. P. 403- 430. In A. L. Page (ed), Methods of soil analysis, Agron. No. 9, Part 2: Chemical and microbiological properties, 2nd ed., Am. Soc. Agron., Madison, WI, USA
[41]  PazGonzales, A.,Vieira, S.R. and Castro, T., 2000, The effect of cultivation on the spatial variability of selected properties of an umbric horizon, Geoderma, 97,273-292
[42]  Pohlmann, H., 1993, Geostatistical modeling of environment data, catena, 20,191-198
[43]  Robertson, G.P., Lingesmith, K.M., and Klug, M.J., 1997, Soil resources, microbial activity, and primary production across an agricultural ecosystem, Ecological Applications, 7, 158–170
[44]  Robertson, G.P., Huston, M.A., Evans, F.C., and Tiedje, J.M., 1988, Spatial variability in a successional plant community: patterns of nitrogen availability, Ecology, 69, 1517–1524
[45]  Roberston, G.P., and Gross, K.L., 1994, Assessing the heterogeneity of belowground resources: quantifying pattern and scale. In: Calwell, M.M., Pearcy, R.W., (Eds), Exploitation of Environmental Heterogeneity by Plants, Academic press, San Diego, CA
[46]  Rogerio, C., Ana, L.B.H., andQuirijn de J.L., 2006, Spatio- temporal variability of soil water tension in a tropical soil in Brazil, Geoderma, 133,231-243
[47]  Sauer, T.J., Cambardella, C.A., and Meek, D. W., 2006, Spatial variation of soil properties relating to vegetation changes, Plant and Soil, 280,1–5
[48]  Schlesinger, W.H, Raikes J.A., Hartley A.E., and Cross, A.F., 1996, on the spatial pattern of soil nutrients in desert ecosystems, Ecology, 77,364–374
[49]  Søvik, A.K., and Aagaard, P., 2003, Spatial variability of a solid porous framework with regard to chemical and physical properties, Geoderma, 113, 47–76
[50]  Vasques, G.M., Grunwald, S., Comerford, N.B., and Sickman, J.O., 2010, Regional modeling of soil Carbon at multiple depth within a subtropical watershed, Geoderma, 156, 326-336
[51]  Venteris, E. R., McCarty, G. W., Ritchie, J. C. and Gish, T., 2004, Influence of management history and landscape variables on soil organic carbon and soil redistribution, Soil Science, 169(11), 787–795
[52]  Vieira, S.R. and Paz Gonzalez, A., 2003, Analysis of the spatial variability of crop yield and soil properties in small agricultural plots. Bragantia, Campinas, 62, 127-138
[53]  Virgilio, N.D., Monti, A., and Venturi, G., 2007, Spatial variability of switchgrass (Panicumvirgatum L.) yield as related to soil parameters in a small field, Field Crops Research, 101, 232-239
[54]  Wang, X.J., and Qi, F., 1998, The effects of sampling design on spatial structure analysis of contaminated soil, The Sci. Total Environ., 224,29-41
[55]  Wang, Y., Zhang, X., and Huang, C., 2009. Spatial variability of soil total nitrogen and soil total phosphorus under different land uses in a small watershed on the Loess Plateau, China. Geoderma, 150, 141–149
[56]  Webster, R., and Oliver, M.A., 2001, Geostatistics for Environmental Scientists. John Wiley and sons, Brisbane, Australia
[57]  Weindorf, D.C. and Zhu, Y., 2010, Spatial variability of soil properties at Capulin volcano, New Mexico, USA: Implications for sampling strategy, Pedosphere, 20(2),185-197
[58]  Wood, G., Macle, K.L.D.A., Scott, J.M., and Hutchinson, K.J., 1998, Changes soil physical properties after grazing exclusion, Soil Use and Management, 14,19-24
[59]  Yi-chang, W., You-lu, B., Ji-yun, J., Fang, Z., Li-ping, Z., and Xiao-qiang, L., 2009, Spatial Variability of Soil Chemical Properties in the Reclaiming Marine Foreland to Yellow Sea of China, Agricultural Sciences in China, 8(9), 1103-1111
[60]  Yong, Z.S., Yul, L., and Halin, Z., 2006, Soil properties and their spatial pattern in a degraded sandy grassland under post- grazing restoration, Inner Mongolia, northern China, Biogeochemistry, 79, 297-314
[61]  Zhao, Y., Peth, S., Krummelbein, J., Horn, R., Wang, Z., Steffens, M., Hoffmann, C., and Peng, X., 2007, Spatial variability of soil properties affected by grazing intensity in Inner Mongolia grassland, Ecological Modeling, 205, 241-254
[62]  Zhang, C.S., and McGrath, D., 2004, Geostatistical and GIS analysis on soil organic carbon concentrations in grassland of southeastern Ireland from two different periods, Geoderma, 119, 261-27