-
Paper Information
- Next Paper
- Paper Submission
-
Journal Information
- About This Journal
- Editorial Board
- Current Issue
- Archive
- Author Guidelines
- Contact Us
American Journal of Environmental Engineering
p-ISSN: 2166-4633 e-ISSN: 2166-465X
2012; 2(1): 1-7
doi:10.5923/j.ajee.20120201.01
Experimental Study of Influencing Factors and Kinetics in Catalytic Removal of Methylene Blue with TiO2 Nanopowder
 Abstract
 Reference
 Full-Text PDF
 Full-text HTML
Marziyeh Salehi1, 2, Hassan Hashemipour1, 3, Mohammad Mirzaee2
1Chemical Engineering Department, Shahid Bahonar University, Kerman, 7616914111, Iran
2Environmental Sciences Department, International Center for Science, High Technology & Environmental Science, Kerman, 7631133131, Iran
3Mineral Industries Research Institute, Shahid Bahonar University, Kerman, 7616914111, Iran
Correspondence to: Hassan Hashemipour, Chemical Engineering Department, Shahid Bahonar University, Kerman, 7616914111, Iran.
| Email: |  |
Copyright © 2012 Scientific & Academic Publishing. All Rights Reserved.
In this research, degradation of methylene blue as a dye pollutant was investigated in the presence of TiO2 nanopowders using photolysis and sonolysis systems separately and simultaneously. Effect of different parameters such as catalyst dosage, initial concentration of dye, UV power, pH and type of catalyst on the removal efficiency was ascertained. The results showed that basic pH is proper for the photocatalytic removal of the dye. Furthermore higher UV power and lower initial concentration of dye leads to higher removal percent. Moreover TiO2 showed more photocatalytic activity than ZnO in the nanopowder form. The experimental kinetic data followed the pseudo-first order model in both photocatlytic and sonophotocatalytic processes but the rate constant of sonophotocatalysis is higher than it at photocatalysis process. Finally the reaction order of the rate law respect to nanocatalyst dosage in photocatalysis process is obtained 1.45. High activation energy of this process shows its high sensitivity to temperature.
Keywords: Methylene Blue, TiO2 Nanopowder, Photocatalysis, Sonophotolysis, Kinetic Study
Cite this paper: Marziyeh Salehi, Hassan Hashemipour, Mohammad Mirzaee, Experimental Study of Influencing Factors and Kinetics in Catalytic Removal of Methylene Blue with TiO2 Nanopowder, American Journal of Environmental Engineering, Vol. 2 No. 1, 2012, pp. 1-7. doi: 10.5923/j.ajee.20120201.01.
Article Outline
1. Introduction
- Dyestuffs are the materials which extensively used in the textile and other printing industries. The color and toxicity which dyes impart to water bodies are very undesirable and harmful to the water users for aesthetic and environmental reasons[1,2]. From an environmental point of view, as some synthetic dyes have toxic and carcinogenic properties, they are of great concern. Approximately about 1-20% of the overall dye production of the world is discharged from various industries such as dyestuff manufacturing, dyeing, printing, and textile finishing[3,4]. Methylene blue (MB) is a cationic dye, used extensively for dying cotton, wool and silk. The risk of the existence of this dye in waste water may be arisen from the burns effect of eye, nausea, vomiting and diarrhea[4,5]. MB has a maximum absorption in the 660 nm visible area[6].In general, several methods have been developed for the removal of dyes from effluents including (1) physical methods employing precipitation, adsorption, and reverse osmosis; (2) chemical methods via oxidation (using air oxygen; ozone, NaOC1, and H202 as oxidants) and reduction(e.g., Na2S204); and (3) biological methods including aerobic and anaerobic treatment. The disadvantages of these conventional methods are sludge formation, waste disposal and high operation cost, time consuming and ineffectiveness in cases where complicated aromatic compounds are presented [7,8].Advanced oxidation processes (AOPs) have been defined broadly on the intermediacy of the hydroxyl radicals (OH●) in driving the oxidation processes. Since AOPs provide different routes to OH● radical production, easier tailoring of the treatment process occurs. Ozone, hydrogen peroxide, ultrasonic, ultraviolet radiation, etc are some methods of AOPs that can be used individually or in different combination forms to generate the hydroxyl radicals[9,10].It is evident that the conduction band electrons (e-) and the valence band holes (h+) are formed when the aqueous suspension of TiO2 irradiates with photon energy higher than the band gap (figure 1).The process of photodegradation starts when TiO2 absorbs a UV radiation of energy equal or higher than its band gap (3.2 eV for anatase; 3.0 eV for rutile). This leads to the formation of free electrons in the conduction band and holes in the semiconductor valence band. The energized electrons can either recombine with the holes (and then dissipate the absorbed energy as heat) or the electron-hole pairs can participate in redox reactions. They can react with electron acceptors/donors adsorbed on the surface of the photocatalyst. Alternatively, the solid side at the semiconductor/liquid junction creates an electrical field that separates the electrons-holes pairs that fail to recombine. The electron field allows the holes to migrate to the illuminated part of the TiO2 and the electrons to migrate to the unlit region of the TiO2 particle surface. Essentially, it is accepted that the initial steps of photocatalytic degradation of a species is the reaction with extremely reactive but short-lived hydroxyl radicals (OH●) or direct hole trapping. The OH● is formed either in the highly hydroxylated semiconductor surface or by direct oxidation of the pollutant molecules under UV radiation. There is also a possibility that both methods of forming OH● occurs in these situation simultaneously. The reduction of adsorbed oxygen species occurs immediately after this process. Dissolved oxygen molecules (in the aqueous system), or other electron acceptors available in the aqueous system can cause this reduction[11,12].
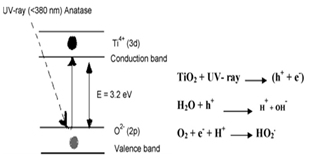 | Figure 1. Energy band gap created on TiO2 surface |
2. Experimental
2.1. Materials
- Titanium dioxide (Degussa P25) nanopowder was utilized as a degradation catalyst. It is mostly in the anatase form with a surface area of 50 m2/g corresponding to a mean particle size of 20 nm and purity >99%. Zinc oxide nanopowder as another catalyst of the reaction was used with average particle size of 25 nm, specific surface area 44 m2/g and purity 99.7% that was prepared from Nano Nader-Sama Company.In this paper, methylene blue was obtained from Merck in the laboratory grade and used without further purification. Adjustment of pH of the dye solutions prior to degradation was carried out with NaOH or H2SO4 from Merck. Distilled water was used in all experiments.
2.2. Apparatus
- The sonolysis experiments were carried out in an ultrasonic bath with controlling power and temperature. Four UV-A (365 nm) 6W Hitachi black light lamps were applied to irradiate in the photocatalytic experiments. The UV lamps were installed on the top of the ultrasonic bath for alternative photo and/or sono irradiation cases. The reaction region was covered with aluminum foil to create light reflection and to prevent light emission to surroundings. The dye concentration was analyzed with a VinCary 50 UV-vis Spectrophotometer. The solution’s pH was detected with a pH meter (Metrohm).
2.3. Methods and Analyses
- A solution containing proper concentration of the dye and dosage of TiO2 nanopowder was prepared and imposed to ultraviolet or ultrasonic depending on the photocatalytic or sonocatalytic cases over a pre-determined period of time. Before analysis, the aqueous samples were filtered through 0.22 µm Biofil syringe filter to remove TiO2 nanopowders. The absorbance measurements with UV-visible spectrophotometer at 660 nm (which is maximum absorption wavelength of MB) were employed to calculate the dye concentration from the calibration curve (absorbance vs. MB concentration). The removal percent of MB was calculated by using the equation given below:
 | (1) |
3. Results and Discussion
3.1. Effect of Catalyst Dosage
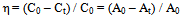
- The effect of the amount of TiO2 dosage on the MB removal was studied and the results are shown in figure 2 for sonocatalysis (US), photocatalysis (UV) and sonophotocatalysis (US/UV) processes. The experiments were carried out with a 10 ppm dye solution for 60 min.Basically, the removal efficiency increases with increasing the catalysis dosage and then stays nearly constant in a specific catalyst dosage. The most effective decomposition of MB was observed at 0.2 g/l of TiO2 for photo and sonophotocatalysis and 1 g/l for sonocatalysis reactions. The reason of this observation is thought to be the fact that when all dye molecules are adsorbed on TiO2, the addition of higher quantities of TiO2 would have no effect on the degradation efficiency. Another cause for this is supposedly an increased opacity of the suspension, brought about as a result of excess of TiO2 particles[15,16].
 | Figure 2. Effect of dosage of TiO2 on MB removal |
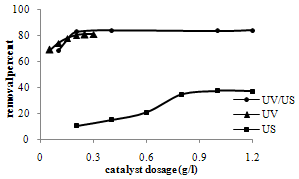
 | Figure 3. Effect of initial dye concentration on MB removal |
3.2. Effect of Initial Dye Concentration
- The effect of initial concentration of dye solutions on the removal percentage was investigated at the optimum catalyst dosage determined before (0.2 g/l for photocatalysis and 1 g/l for sonocatalysis) for 90 min during separate and simultaneous photocatalysis and sonocatalysis as were shown in figure 3.As expected there is a tradeoff between both photo and sonocatalysis degradation conversion of MB and initial concentration of MB. The reason is that when the initial concentration of dye is increased, more and more dye molecules are adsorbed on the surface of TiO2. Since the existence of the large amounts of adsorbed dye results the lack of any direct contact with the holes or hydroxyl radicals, this might have an inhibitive effect on the dye degradation. Other possible reasons for these results is the effect of UV screening of the own dye. In high dye concentrations a major amount of UV tends to be absorbed by dye molecules. This reduces the efficiency of the catalytic reaction due to the decline in OH• and OH2• concentrations. Another possible reason is the formation of the by-products during the degradation of mother dye molecules. Moreover the percentage removal decreases rapidly at low MB concentrations and then changes slowly as the initial concentration increases[20-22].As seen, more dye removing is observed in photocatalysis than sonocatalysis in all experiments. It indicates that photocatalytic process has higher efficiency than sonocatalysis. The combined processes of photocatalysis and sonoly- sis produced synergistic effects and showed the highest efficiency in the all initial concentration of dye.
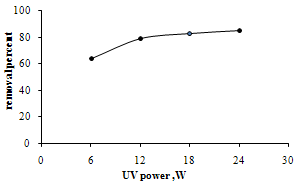 | Figure 4. Effect of UV power in the photocatalytic degradation of MB. (0.2 g/l TiO2, [MB] =10 ppm) |
3.3. Effect of UV Power
- The effect of UV power on the removal of MB was shown in figure 4. The results show that the removal percent increases with increasing the power of radiation. The increasing in UV power from 6W to 12W increases the percentage removal from 64% to 79% and increasing the UV power from 12W to 24W the percentage removal from 79% to 85% for a 10 ppm solution of dye increases after 60 min at ambient temperature. The results show that the UV light intensity plays an important role in degradation of MB. Moreover at the range of UV power that the experiments were done, the percentage removal increases rapidly at low power of UV and then changes slowly as the UV power increases. Increasing the power of UV radiation provides more energy to excite the electron of TiO2 and creates more electron-hole pairs, thus improve the photocatalytic process [23,24].
3.4. Effect of PH
- Since pH of dye solution is a main parameter on the degradation progress, comparative experiments were performed at different pH values: one acidic pH (3.3), two basic pHs (11.4, 13.3) and one natural pH (7.7). The pH parameter improves the removal percentage and the results are shown in figure 5. The pH influences the characteristics of the photocatalyst surface charge, so pH of the solution is a significant parameter in performing the reaction on the surface of semiconductor particles. Point of zero charge (PZC) for TiO2 particles is pH PZC = 6.8[3,25]. The surface of TiO2 has a negative charge in basic media (pH > 6.8), so there is an electrostatic absorption between negative charge surfaces of TiO2 and cationic dyes. As the pH of the system decreases, the number of surfaces with positive charge increases. The surface sites on TiO2 do not tend to absorb the cations of dyes made by electrostatic propulsion. H2SO4 and NaOH were used to pH adjustment of dye solutions
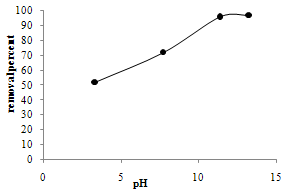 | Figure 5. Effect of pH,[MB] = 10 ppm, 1 hr reaction |
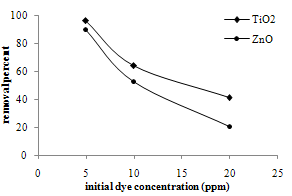 | Figure 6. Comparison of TiO2 and ZnO sonophotoreactivity |
3.5. Comparison of the Sonophotocatalytic Removal Using Tio2 and Zno Nanopowders
- The photocatalytic reactivity results of TiO2 and ZnO nanopoders in methylene blue removal are presented in figure 6. Particle size of both photocatalysts is almost the same. TiO2 nanopowders show higher efficiency and higher percentage of dye removal than ZnO nanoparticles in all initial concentrations of methylene blue. As the initial concentration of dye increases, the differences in removal percent increase.The photocatalytic activity of semiconductors is dependent on the band gap energy, crystallinity, particle size, surface area, pore structure and concentration of the impurities in the catalysts[26,27]. ZnO has higher band gap energy and this causes lower sonophotoreactivity than TiO2. In addition, this may be due to lower surface area and higher density of ZnO than TiO2.
3.6. Removal Kinetics
3.6.1. Investigation of the Order of Rection in Photo and Sonophotocatalytic Reaction
- To estimate the kinetic rate of the removal reaction, an equation form of power law is used:
 | (2) |
 | (3) |
 | (4) |
 | (5) |
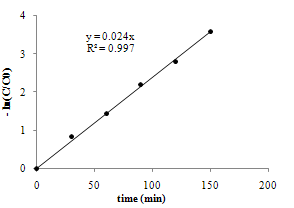
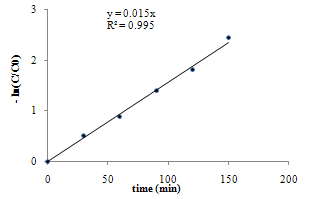 | Figure 7. Pseudo-first order of the reaction rate in photocatalytic state, Cdye0 = 10 ppm, room temperature |
 | Figure 8. Pseudo first order of the reaction rate in sonophotocatalytic state, Cdye,0 = 10 ppm, room temperature |
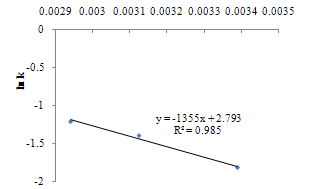
3.6.2. Calculation of rate constant and order of reaction respect to photocatalyst concentration in sonophotocatalytic reaction
- Logarithmic form of the equation 4 can be used to find out the order of reaction respect to catalyst dosage:
 | (6) |
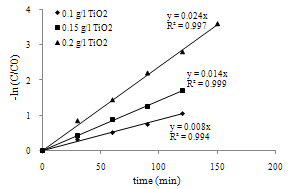 | Figure 9. Determination of Kobs in three dosages of photocatalyst |
|
 | (7) |
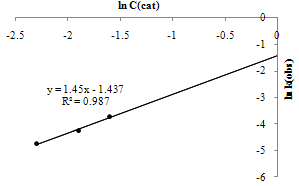 | Figure 10. Determinations of m and k in sonophotocatalytic reaction |
 | (8) |
|
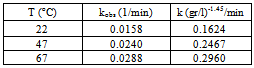
 | Figure 11. Arrhenius plot of the rate constant in sonophotocatalytic reaction |
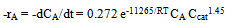 | (9) |
4. Conclusions
- In this study the dye MB was appropriately mineralized by separate and simultaneous photocatalytic and sonocatalytic reactions in the presence of nanoparticles titanium dioxide in the form of slurry. The effect of efficiency parameters like dosage of catalyst, concentration of dye, UV power pH and type of nanocatalyst were investigated. It was found that optimum dosage of catalyst was 1, 0.2 and 0.2 for sonocatalytic, photocatalytic and sonophotocatalytic reactions respectively. The results revealed that the dye removal was inversely proportional to the initial methylene blue concentration in all processes. photocatalysis seems to be more efficient than sonocatalysis in the same environmental situations. the removal rate of dye increases with increasing UV power from 6 to 24 W. photocatalytic and sonophotocatalytic removal of methylene blue obey pseudo first order kinetic at low initial concentrations and the sonophotocatalytic kinetic parameters was determined for initial MB concentration of 10 ppm. Also it was observed that TiO2 was found to be more efficient than ZnO for methylene blue removing via photocatalytic process.