-
Paper Information
- Previous Paper
- Paper Submission
-
Journal Information
- About This Journal
- Editorial Board
- Current Issue
- Archive
- Author Guidelines
- Contact Us
American Journal of Environmental Engineering
p-ISSN: 2166-4633 e-ISSN: 2166-465X
2011; 1(1): 21-27
doi: 10.5923/j.ajee.20110101.04
Metal Leaching Potential in Coal Fly Ash
Kandarp K. Shivpuri 1, Lokeshappa B. 1, Deepak A. Kulkarni 1, Anil Kumar Dikshit 1, 2, 3
1Centre for Environmental Science and Engineering, IIT Bombay, Mumbai, 400076, India
2School of Civil Engineering, Survey and Construction, University of KwaZulu-Natal, Durban, 4041, South Africa
3School of Civil and Environmental Engineering, Nanyang Technological University, 639798, Singapore
Correspondence to: Anil Kumar Dikshit , Centre for Environmental Science and Engineering, IIT Bombay, Mumbai, 400076, India.
| Email: |  |
Copyright © 2012 Scientific & Academic Publishing. All Rights Reserved.
Thermal power plants are the major source of electricity generation in India and most of them use pulverized coal as the fuel producing enormous quantities of coal fly ash every year. The method of disposal adopted is by wet sluicing in on-site fly ash ponds. This disposal in the form of dilute slurry has a high potential for leaching into the surrounding soil and groundwater. The coal fly ash contains trace metals like As, Cr, Zn, Cd, etc which are toxic in nature and thus, the wet disposal of coal fly ash has serious environmental concerns. This paper assesses the leaching potential of coal fly ash from six thermal power plants in Maharashtra, India. The maximum leachable quantities of some trace metals present in coal fly ash are computed by a Sequential Extraction Procedure (SEP) and results are compared with values obtained by Toxicity Characteristics Leaching Procedure(TCLP).
Keywords: Coal Fly Ash, Leaching, Metals, SEP, TCLP
Cite this paper: Kandarp K. Shivpuri , Lokeshappa B. , Deepak A. Kulkarni , Anil Kumar Dikshit , "Metal Leaching Potential in Coal Fly Ash", American Journal of Environmental Engineering, Vol. 1 No. 1, 2011, pp. 21-27. doi: 10.5923/j.ajee.20110101.04.
Article Outline
1. Introduction
- India has 211 billion tonnes of coal reserves. Indian coal used in thermal power plants is of low grade quality and has an ash content of 40 to 50%[1]. The expected generation of fly ash in India is more than 175 million tonnes by the year 2012[2]. The minerals in coal decompose during combustion and their alterations result in the formation of ash, which has silicates as its major component, while unburnt carbon/char constitutes a small fraction. The mineralogy of the coal governs the crystalline phases in fly ash, which include oxides of aluminium and iron, feldspars, quartz, mullite and gypsum. Fly ash also contains organic fractions like coke and char particles. Fly ash is enriched in most elements that are found in coal except for the most volatile elements, such as Hg[3]. The fly ash collected by electrostatic precipitators is carried from silos to storage ponds by flushing along with water through drains made especially for this purpose, the method referred to as ‘hydraulic conveying’. This water is recycled for further conveying of fly ash from silos and this process results in increased concentration of metals in the ponds due to accumulation[4]. Fly ash and bottom ash and water are usually mixed in ash: water ratios varying from 1:4 to 1:20[5]. The ash ponds contain fly ash and water mix in form of a dilute slurry and leaching of metals from this dilute slurry is a function of its pH, which itself is a dynamic parameter. pH can change due to physico-chemical reactions taking place in the pond itself or due to addition of rain water which has an acidic pH of about 5.7 on interaction with atmospheric CO2[6]. Also, the leaching is affected by liquid to solid (L/S) ratio of the slurry. Maximum concentrations of many elements were found at lower L/S ratio and it decreased with increasing L/S ratio[7]. Composition of the leachate waters depends on many factors ranging from treatments given to coal (desulfuri- zation, lime addition processes etc) to engineering process design (conditions of combustion systems and flue gas processes). It is also a function of the surface of fly ash[8]. The elements in the aluminosilicate glass phase of fly ash are released in lower concentrations initially and dominate in the leachate of the weathered fly ash. In the initial stages, the elements adsorbed on the surface of fly ash particles are prominent in the leachate[4]. The combustion of coal in thermal power plants may result in concentration of certain elements in fly ash, designated as enriched elements, such as Cd, Cr, Pb, and Zn. These elements have a greater tendency to leach out from the solid phase (fly ash). These toxic trace elements display subsequent enrichment in concentration from coal to bottom ash and to fly ash[9]. This enrichment in concentration can reach to about 100 times the metal concentration in the coal[10]. Initially when fly ash comes in contact with water, the alkaline elements present on its surface will tend to dissolve rapidly and move into solution. But, with subsequent increase in solution pH and element concentration, reprecipitation of elements may occur to form more stable secondary solids[11]. Under leaching conditions, the mobility of different elements from coal ash is critically dependent on the pH developed within the ash–water system and that the effect of the pH of the natural ash on the pH of the ash–water system decreases on increasing the dilution of the ash[12]. Oxyanions like B, As, and Se have high solubility and so these tend to leach more at both low and high pH values, while cations like Ca and Sr show decrease in solubility when pH increases[13].
2. Materials and Methods
- The fly ash samples were collected from the dust hoppers of electrostatic precipitators of the six thermal power plants in Maharashtra, India. The samples named as FA-1, FA-2, FA-3, FA-4, FA-5 and FA-6 were characterized on the basis of particles size, surface area, mineralogy by X-Ray Diffr- action (XRD), metal oxides content by X-Ray Fluorescence (XRF), leachable metal concentrations by Sequential Extrac- tion Procedure (SEP) and Toxicity Characteristic Leaching Procedure (TCLP) using Inductively Coupled Plasma Atomic Emission Spectrometer (ICP-AES). All the samples were sieved finer than 250 µm and oven dried at 105℃ for 24 hours before analysis. All glassware (Borosil make) were regularly washed using chromic acid, neutralized with dilute alkali, washed using tap water and ultra pure water and oven-dried after each experiment. Stock solutions of all reagents of 1000 mg/L were prepared using Merck Chemicals, India and multi element standards of 1000 ppm solution were purchased from the VGH laboratory, USA and diluted as per experimental requirements. Metal free nitric acid, hydrochloric acid and acetic acid and metal free ultra pure water generated using Ultraclear water kit TWF EDI UV TM (Siemens, Singapore) were used for all experiments.
2.1. Particle Size Distribution
- The particle size analyses of coal fly ashes were carried out with the help of Beckman Coulter Laser Diffraction Particle Analyser (LS 13320, Japan). A well-mixed slurry using 1 g of fly ash sample and 20 mL of ultrapure water was kept in the Beckman Sonication Control Unit, where the aqueous liquid module was capable of suspending samples in the range of 0.04 to 2000 µm. Samples were diluted to omit interference by re-scattering.
2.2. Specific Surface Area
- The specific surface area of the fly ash samples was determined with the help of BET surface area analyzer (Smart Instruments, India) based on single point. First step in this experiment was to regenerate the sample (1 g of sample) to remove the moisture or adsorbed gases. Regeneration was done at 110º C for 2 hr for the sample. In second step, the regenerated sample was placed in sampler, which was connected to the instrument for the experiment. Initially the sample was dipped in liquid nitrogen. This led to adsorption of N2 on the sample from the flow of gas mixture of He and N2. After this adsorption was over, the sample was dipped in water which started the desorption process. The adsorbed N2 got released in the gas flow. The quantity of gas released was measured with the help of thermal conductivity detector (TCD) and was then integrated with the help of electronic circuit in terms of number or counts (NCs). The instrument is then calibrated by injecting known quantity of N2. All these measurements are used to calculate the surface area of the sample. The software package provided with instrument is user friendly and guides the user about every procedure. it does all the calculations internally and displayed the final result on the computer screen.
2.3. Mineralogical Composition
- Mineralogical investigations of coal fly ashes were carried out by powder X Ray Diffractions (XRD) (Rigaku Geiger- flex, Japan), coupled with PW 1729 X-ray generator using CuKα radiation. All samples were run at a tube voltage 20 kV and 30 mA. The geniometer and chart speed were maintained at 0.05 mm/2θ and 10 mm/2θ, respectively. All samples were dried at 110℃ before analysis.
2.4. Elemental Composition
- The elemental composition of the coal fly ash samples was obtained with the help of Philips X-Ray Fluorescence Spectrometer (2404, Netherlands), which determines all major oxides present in the sample. 4 g of oven-dried, finely ground coal fly ash sample and 1 g of micro crystalline methyl cellulose were mixed uniformly with isopropyl alcohol and kept for slow drying under a 200 W infrared lamp. This dried sample was made as a pellet by filling in an aluminium dish and was compressed under a load of 1-2 ton for 1 minute with the help of a hydraulic jack. The compressed pallet was run in the XRF setup for computing the composition as oxides of elements as percentage by weight of the ash sample.
2.5. Sequential Extraction Procedure
- The fly ash samples were subjected to a leaching procedure using leaching solutions sequentially in order of increasing aggressive nature and the concentrations of different metals leached during each step were calculated using ICP-AES[14]. 0.5 g of dried fly ash samples were mixed with 50 mL of the corresponding leaching solution in a centrifuge tube and set in an end-to-end agitator (Trishul Equipment, India) specifically fabricated for SEP at 30 rpm for specified time period. Thereafter the samples were centrifuged at 10000 rpm for 10 minutes. The supernatant was decanted, filtered with a 0.2 µm PTFE filter and then acidified to 2% (by mass) using concentrated nitric acid and preserved for analysis by ICP-AES. The solids remaining after the centrifugation for one step were then contacted with the next leaching solution in the sequence. The concentra- tions of metals of interest in all leaching solutions for all fly ash samples were obtained from ICP-AES. The leaching solutions used and the corresponding time for agitation are compiled in Table 1.
2.6. Toxicity Characteristic Leaching Procedure
- The USEPA SW 864 method 1311[15] was used for testing the leachability of the fly ash samples. Initial tests for determination of the extraction fluid to be used for analysis were done by obtaining the pH of the fly ash – ultrapure water mix in the ratio of 1:20. The corresponding extraction fluid used for the analysis was acetic acid having pH of 2.88. For analysis, 0.5 g of fly ash sample was mixed with 20 mL of extraction fluid in a 50 mL centrifuge tube and put in an end-to-end rotary agitator for 18 hours at 30 rpm and then suspension was centrifuged at 10000 rpm for 10 minutes. The supernatant was filtered through a 0.2 µm PTFE filter and and then acidified to 2% (by mass) using concentrated nitric acid and preserved for analysis by ICP-AES. The solids remaining from the centrifugation were discarded.
2.7. Metal Analysis
- Concentrations of trace metals in samples from SEP, and TCLP were obtained using Jobin Yvon Horib ICP-AES (ULTIMA 2000, France). Prior to analysis the samples were diluted with 2% nitric acid solution. Samples from the SEP were diluted 1:2 for the water soluble step, 1:10 for the acid-soluble step, and 1:20 for the other three steps. TCLP samples used a 1:10 dilution factor. Calibration standards were analyzed in the same matrices as the samples and the extractions for SET and TCLP were carried out in duplicate. Table 2 shows the operating conditions of ICP-AES.
|
3. Results and Discussions
- The results obtained by the experiments mentioned in previous section are discussed below.
3.1. Particle Size Distribution
- The results of the Particle Size Distribution Curves for the samples of fly ashes are tabulated in Table 2. It can be seen that the mean diameters vary from 4.2 µm to 207 µm. The finer particles formed during combustion tend to coagulate and form larger particles, whereas larger particles too can destabilize during combustion to form smaller particles. Thus, the mean particle size of fly ash particles may be dependent on the combustion process of the thermal power plants.
3.2. Specific Surface Area
- The specific surface area of the fly ash samples is shown in Table 3. The surface area varies between 0.89 and 1.2 m2/g. The specific surface area is more if finer particles are in abundance in the sample. The surface area increases as percentage of finer particles increases in the sample. But as particle size increases, the shape ceases to be spherical and these irregular shapes tend to have larger specific surface area[9].
|
3.3. Mineralogical Composition
- The results of XRD (Figure 1) for the fly ash samples indicated Quartz to be the most predominant element in all the samples and Mullite too was present in all the samples except FA-1 and FA-2.
3.4. Elemental Composition
- The composition of fly ash samples by XRF(Table 4) indicated that all the samples were class F ashes as the SiO2 content was very high and the CaO content was low.The SiO2 content was between 60 - 65% in all samples, being slightly less for FA-1, while the Al2O3 content varied between 20 – 30% for all fly ash samples. Fe2O3 content for the fly ash samples was between 4 – 6%. CaO content was between 1 – 2%, K2O between 0.6 – 1.3% and TiO2 between 1.2 – 1.7%. MgO, Na2O, MnO and SrO were less than 1% with Na2O being below detectable limits(less than 0.001%) in samples FA-5 and FA-6.
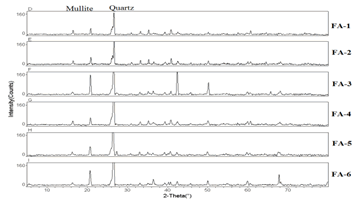 | Figure 1. Mineralogical Composition of Fly Ash Samples using XRD. |
|
3.5. Metals Leaching in SEP
- The samples showed different leaching trends for the different leaching solutions used for SEP. Some elements showed leaching for specific chemical phases. As, Cr, Mn, Zn, Cd, Ba, Pb and Co showed maximum leaching percentage in acid soluble (AS) phase. Se, Cd, Ni and V showed maximum leaching percentage in ion exchangeable (IE) phase, while Fe leached maximum in Residual Solids (RS) phase. Also, sample FA-1 exhibited maximum leaching in IE phase for As, Se, Cd, Ni, Pb, Co and V. The leaching trends exhibited by different elements for different leaching solutions are presented in Figure 2(a) to (m) and are summarised in Table 5.
|
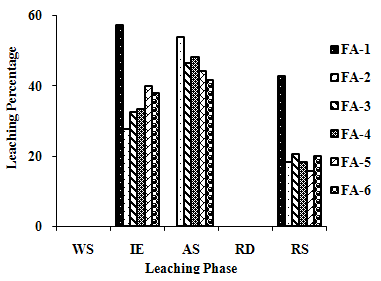 | Figure 2(a). Leaching Trend for As in SEP. |
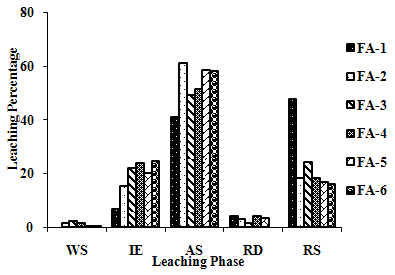 | Figure 2(b). Leaching Trend for Ba in SEP. |
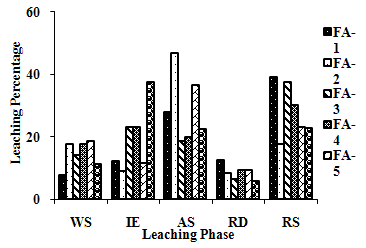 | Figure 2(c). Leaching Trend for Ca in SEP. |
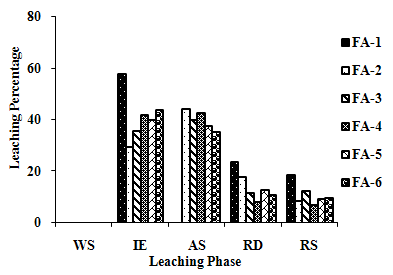 | Figure 2(d). Leaching Trend for Cd in SEP. |
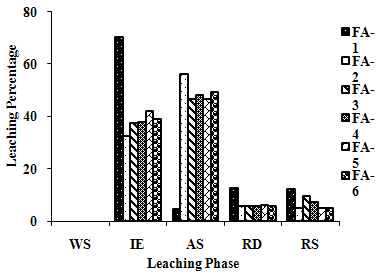 | Figure 2(e). Leaching Trend for Co in SEP. |
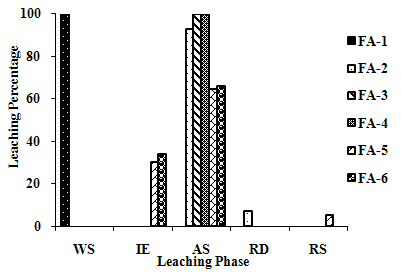 | Figure 2(f). Leaching Trend for Cr in SEP . |
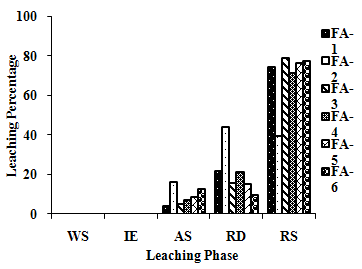 | Figure 2(g). Leaching Trend for Fe in SEP. |
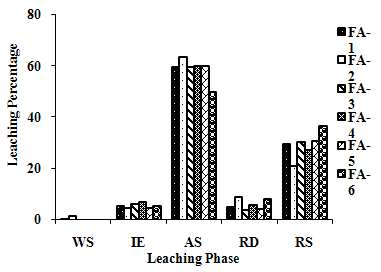 | Figure 2(h). Leaching Trend for Mn in SEP. |
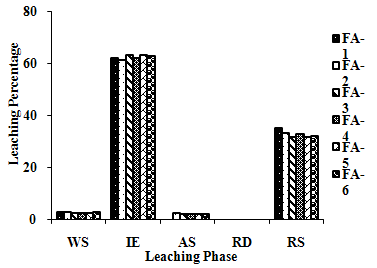 | Figure 2(i). Leaching Trend for Ni in SEP. |
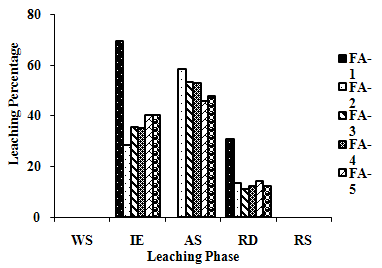 | Figure 2(j). Leaching Trend for Pb in SEP. |
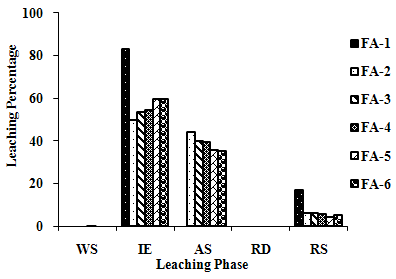 | Figure 2(k). Leaching Trend for Se in SEP. |
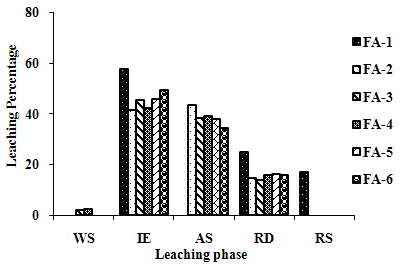 | Figure 2(l). Leaching Trend for V in SEP. |
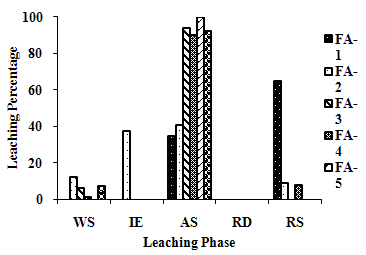 | Figure 2(m). Leaching Trend for Zn in SEP. |
|
3.6. Metals Leaching in TCLP
- The leaching trends observed for the six fly ash samples by using acetic acid of 2.88 pH, as leaching solution, are shown in Figure 3(a) and(b). Ca showed very high concen- tration in the range of 900 to 4000 µg/g. FA-3 has high leaching for Fe and Ba, showing high leaching concentra- tions of more than 100 µg/g, while FA-2 exhibits moderate leaching of Fe, Zn and Mn; FA-6 of Ba, Fe and Mn; and FA-1 of Ba.
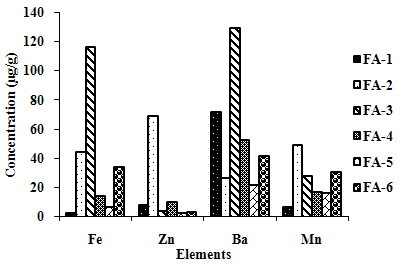 | Figure 3(a). Leaching Trend in TCLP for Elements exhibiting Higher Concentrations in Extractant. |
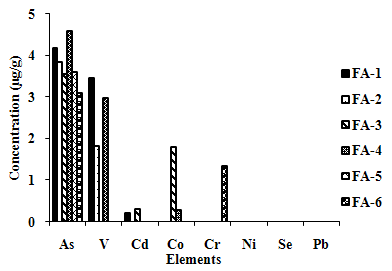 | Figure 3(b). Leaching Trend in TCLP for Elements exhibiting Lower Concentrations in Extractant. |
4. Conclusions
- The elements in coal fly ash exhibit varying behaviour for different leaching conditions like leaching medium and pH. The fly ash may be enriched in Ca, Ni and Fe and show greater leachability in acidic or ion-exchangeable conditions. Fe is tightly bound to the ash and does not leach easily while Ca is highly soluble and leaches out in almost all mediums. Se, Cd and Ni leach out at less aggressive conditions in ion exchangeable conditions, while As, Cr, Cd, Pb and Zn leach under more aggressive conditions. Also, the SO3 content of coal fly ash may influence the leaching behaviour of fly ash as exhibited by FA-1, which possesses relatively higher percentage of SO3 and showed different leaching trends during SEP. Thus, toxic metal mobility is also influenced by the mode of occurrence of metals within the ash, especially for the metals which condense on the surface of the particles in the furnace[16].
ACKNOWLEDGEMENTS
- The authors are grateful to the Centre for Environmental Science and Engineering, IIT Bombay, India for providing the facilities for this project. The authors are thankful to management and staff of all the six Thermal Power Plants in Maharashtra, India for providing the fly ash samples used in this research.
References
| [1] | Theis, T.L., Westrick, J.D., Hsu, C.L., Marley, J.J., 1978, Field investigation of trace metals in groundwater from fly ash disposal., Water Pollution Control Federation, 50(11), 2457-2469 |
| [2] | Chatterjee, A.K., 2011, Indian fly ashes: their characteristics and potential for mechanochemical activation for enhanced usability, Journal of Materials in Civil Engineering, 23(6), 783-788 |
| [3] | Gong, X., Wu, T., Qiao, Y., and Xu, M., 2010, In situ leaching of trace elements in a coal ash dump and time dependence laboratory evaluation., Energy Fuels, 24, 84–90 |
| [4] | Choi, S.K., Lee, S., Song, Y.K., and Moon, H.S., 2002, Leaching characteristics of selected Korean fly ashes and its implications for the groundwater composition near the ash disposal mound., Fuel, 81, 1083-1090 |
| [5] | Egemen, E., and Yutteri, C., 1996, Regulatory leaching tests for fly ash, a case study., Waste Management Research, 14(1), 43–50 |
| [6] | Goodarzi, F., 2006, Characteristics and composition of fly ash from Canadian coal-fired power plants, Fuel, 85, 1418–1427 |
| [7] | Grisafe, D.A., Angino, E.E., Smith, S.M., 1988, Leaching characteristics of a high-calcium fly ash as a function of pH: a potential source of selenium toxicity., Applied Geochemistry, 3, 601-608 |
| [8] | Iyer, R., 2002, The surface chemistry of leaching coal fly ash, Journal of Hazardous Materials, B93, 321–329 |
| [9] | Baba, A., 2000, Leaching characteristics of wastes from Kemerkoy, Global Nest: the International Journal, 2(1), 51-57 |
| [10] | Praharaj, T., Powell, M.A., Hart, B.R., Tripathy, S., 2002, Leachability of elements from sub-bituminous coal fly ash from India., Environment International, 27, 609–615. |
| [11] | Gandhi, R.S., 2005, Design and maintenance of ash pond for ash disposal, IGC-2005, Ahmedabad, India, 85-90 |
| [12] | Ward, C.R., French, D., Jankowski, J., Dubikova, M., Li, Z., Riley, K.W., 2009, Element mobility from fresh and long-stored acidic fly ashes associated with an Australian power station., International Journal of Coal Geology, 80, 224–236 |
| [13] | Ruhl, L., Vengosh, A., Dwyer, G.S., Hsu-Kim, H., and Deonarine, A., 2010, Environmental impacts of the coal ash spill in Kingston, Tennessee: an 18-month survey, Environmental Science and Technology, 44, 9272–9278 |
| [14] | B. Lokeshappa, A.K. Dikshit, D.E. Giammar, Y. Luo, and J.G. Catalona, “Metals in Indian fly ash: a preliminary Investigation,” in 3rd International Symposium on Global Energy Futures, Washington University in Saint Louis, USA, October, 2010 |
| [15] | “Toxicity characteristics leaching procedure,” SW-864, Method 1311, USEPA (1992), 1-35 |
| [16] | S.C. Openshaw, W.L. Miller, W.E. Bolch, and D. Bloomquist, “Utilization of coal fly ash,” Florida Center for Solid and Hazardous Waste Management, Florida, Report 92-3, 1992 |
 Abstract
 Reference
 Full-Text PDF
 Full-Text HTML