-
Paper Information
- Paper Submission
-
Journal Information
- About This Journal
- Editorial Board
- Current Issue
- Archive
- Author Guidelines
- Contact Us
American Journal of Condensed Matter Physics
p-ISSN: 2163-1115 e-ISSN: 2163-1123
2025; 14(1): 1-7
doi:10.5923/j.ajcmp.20251401.01
Received: May 22, 2025; Accepted: Jun. 10, 2025; Published: Jun. 13, 2025

Structural, Photoluminescence and Optical Properties of CdSe:Zn Nanoparticles: Effects of Doping Concentrations
 Abstract
 Reference
 Full-Text PDF
 Full-text HTML
Nimrod Gitonga1, Sharon Kiprotich1, Michael Musembi2
1Department of Physical and Biological science, Murang’a University of Technology, Murang’a, Kenya
2Department of Physics Machakos University, Machakos, Kenya
Correspondence to: Sharon Kiprotich, Department of Physical and Biological science, Murang’a University of Technology, Murang’a, Kenya.
| Email: |  |
Copyright © 2025 The Author(s). Published by Scientific & Academic Publishing.
This work is licensed under the Creative Commons Attribution International License (CC BY).
http://creativecommons.org/licenses/by/4.0/

The concentration of dopantintroduced into the host nanoparticle alters its structural, optical and morphological properties. This paper explains the one pot synthesis of zinc doped cadmium selenide nanoparticles (Zn-CdSeNPs) using L-cysteine as capping agent. The synthesis process was carried out with three necked flask at 90°C. The X-ray diffraction (XRD) pattern confirms the formation of zinc blende cubic structure. Scherrer equation was used to calculate crystal size, and the results showed that crystal size decreased with an increase in dopant concentration. Pure CdSe nanoparticles had a crystal size of 24.66 nm and 15% Zinc doped CdSe had a crystal size of 17.72nm. Results from photoluminescence (PL) spectroscopy shows that at high concentration of Zn dopant, the emission peak shift to higher wavelength and the intensity of the peak decreased. 1% zinc doped CdSe nanoparticles had the highest intensity while 15% Zn-CdSe nanoparticles had the lowest PL intensity.The optical properties of Zn-CdSeNPs were characterized with Ultra Violet visible spectroscopy. Tauc’s plot was used to obtain the bandgap energies of nanoparticles. The results showed that at 11% Zn-CdSe the bandgap energy was 1.35 eV and at lower dopant concentration 1% the bandgap energy was 1.92 eV.
Keywords: Bandgap, Dopants, Optical properties, Cadmium selenide, Zinc blende, Nanoparticles
Cite this paper: Nimrod Gitonga, Sharon Kiprotich, Michael Musembi, Structural, Photoluminescence and Optical Properties of CdSe:Zn Nanoparticles: Effects of Doping Concentrations, American Journal of Condensed Matter Physics, Vol. 14 No. 1, 2025, pp. 1-7. doi: 10.5923/j.ajcmp.20251401.01.
Article Outline
1. Introduction
- Since the rise in nanotechnology, scholars and researchers around the world have sought to invent new nanomaterials and improve the properties of the existing nanomaterials. Nanotechnology has made human life easier by changing the size and properties of so many devices used either in health, electronics or agricultural activities [1]. The need for this improvement and new invention is a fascinating task for research community. Group II-VI semiconducting elements have good photovoltaic and optoelectronic properties [2]. The nanomaterials of these semiconductors are being pursued due to their ability to control their morphology and shape. CdSe material has bandgap energy comparable with solar energy spectrum [3], adjustable n and p type of conductivity depending on the dopant [4] and high absorption coefficient in visible and infrared region [5]. In the last decade CdSe nanoparticles has attracted attentions of researchers due to its wide applications in solar cells [6], gas sensors [7] and photodetector [8]. As of 2020 the power conversion efficiency (PCE) of perovskite solar cells was 25%. This is considered low since the amount of energy produce by sun in one hour is more than the energy consumed by the world in a year [9]. Therefore other measures should be taken into consideration to ensure efficiency of this power conversion is increased to reduce the use of fossil fuels which has led to climate change.CdSe nanoparticles degrade when exposed to sunlight for a very long time thus decreasing the efficiency of solar cells. They also have lower conversion efficiency when compared to other nanoparticles such silicon [10]. To improve CdSe nanoparticles properties for solar cells application,several factors such as method of preparation, use of dopant, growth temperature and annealing temperature are being considered. CdSe nanoparticles have been successfully prepared via different methods such as thermal treatment technique [11], wet chemical colloidal method [12], sol gel method [13] and green synthesis method [14]. The best method to obtain better quality and highly structured materials of CdSe nanoparticles is still ongoing.Introducing alien element to semiconductors has tremendous effects on the optical, morphological and electronic properties. For example when Zhao et al., (2019) [15] prepared Ag doped CdSe quantum dots, it was observed that incorporation of Ag into core region leads to metallic-like electronic properties. Several transitional metals are used as dopants in CdSe nanoparticles to modify the optical, electronic and magnetic properties of CdSe. They include Ag, Mn, Co, and Ni. In this study zinc was used as dopant in CdSe nanoparticles used in solar cell application because Zn2+ has smaller ionic radius (0.74Å) compared to Cd²⁺ (0.95 Å) thus the lattice contraction in nanoparticle obtained can lead to better crystallinity, improving charge carrier mobility in photovoltaic and optoelectronic devices [16].The present study focuses on one pot synthesis of Zn-CdSeNPs and studies the effects of different doping concentrations of Zn on structural, optical and morphological properties of CdSe nanoparticles used in solar cells.In this study different concentration of Zn was added to CdSe nanoparticles and analyzed using X-ray diffraction (XRD), Ultra violet visible spectroscopy (UV-Vis) and photoluminescence (PL) spectroscopy for structural, optical and electrical properties.
2. Materials and Methods
2.1. Chemicals
- All the reagents used were of analytical gradeand were purchased from Sigma Aldrich & A.B Chem. Co., Ltd. They include: Cadmium sulphite anhydrous (>95%), anhydrous cadmium chloride (>99%), selenium powder (>99%), L-Cysteine (>99%) and zinc acetate (>=99.4%) and deionized water prepared at Murang’a University of Technology Research Laboratory.
2.2. Preparation of Se Ions
- 0.31g of selenium powder and 1.0g of sodium sulphite in 100 ml of deionized water was refluxed for 8 hours at a temperature of 90°C to form sodium selenosulphate ions as shown in equation 1.
 | (1) |
2.3. Synthesis of Zinc Doped Cadmium Selenide Nanoparticles
- 0.04g of cadmium chloride was dissolved in 50ml of deionized water. L-cysteine was dissolved in cadmium to form a molar ratio of 1:1 L-Cyst/Cd. The pH of the precursor was adjusted to elevenusing pH meter. The solution obtained were transferred to three neckedflask and stirred continuously. Selenium ions obtained from selonosulphate were added to solution followed by 3, 5, 7, 9, 11 and 15mol% zinc acetate. The solutions obtained were refluxed at a temperature of 90°C for one hour. The nanoparticles obtained were allowed to cool at room temperature for 24 hours then rinsed with ethanol and dried in an oven for one hour at 90°C. The dried nanoparticles were annealed in furnace at a temperature of 250°C.
2.4. Characterization Techniques
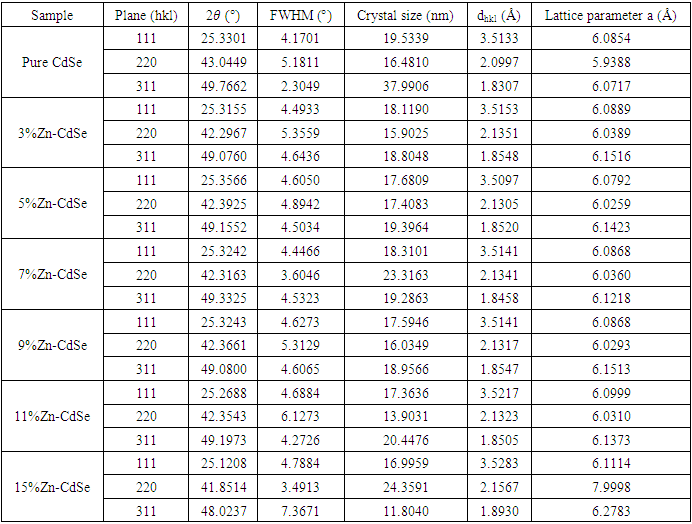
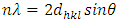
- The optical properties of Zn-CdSe nanoparticles were determined using Evolution One Plus Model Ultra Violet spectroscopy. Structural and lattice properties of nanoparticles were analyzed using ARL EQUINOX 100 XRD at 40 kV, 0.9mA, at a scanning range of 20-100° degrees at an interval time of 240 seconds. The data obtained were plotted in origin, analyzed and compared to those of standard in Joint committee on powder diffraction standards (JCPDS). Debye Scherrer equation was used to calculate the crystallite size of the nanoparticles formed. Infitek SP-LF97 photoluminescence spectroscopy was used to determinethe luminescence properties and defects in the nanoparticles.
3. Results and Discussion
3.1. X-ray Diffraction (XRD) Analysis
- The XRD pattern depicted by pure and Zn doped CdSe nanoparticles is shown in Figure 1(a). The peaks obtained matches those in JCPDS card no 19-0191 associated with zinc blende cubic structure. Doping CdSe with Zn affects its physical, chemical and crystal size properties as demonstrated by color change from dark brown to reddish brown for doped samples. A peak was observed at 2θ = 33.48 (marked with *) for 15% Zn doped CdSe nanoparticles. High concentration of dopant causes clustering asshown by peak broadening based on crystal size obtained of (16.99 nm) for 15% at plane (111). 3% Zn-CdSe had the highest intensity and 5% Zn-CdSe nanoparticles had the lowest intensity at peak (111) as shown in Figure 1(b). This means that at 3% Zn doped the nanoparticles were highly crystalline. Doping CdSeNPs increases its crystallinity, similar results has been reported when zinc oxide was doped with magnesium and the XRD pattern showed sharper peaks, indicating better crystal quality [16]. The intensity of the peaks decreased with increased in Zn dopant concentration, this may be attributed by factors such as increased micro strain, introduction of lattice distortion or partial transformation of material to amorphous phase. This observation is uniform with findings reported by Akl et al. (2020) [17] who stated that as disorder increases, the peak intensity decreases reflecting a reduced ability of the crystal lattice to diffract X-rays coherently. Crystal defects occur when Zn is used as dopant in CdSe, this changes the stoichiometry as a result of charge imbalance arising from these defects [18].
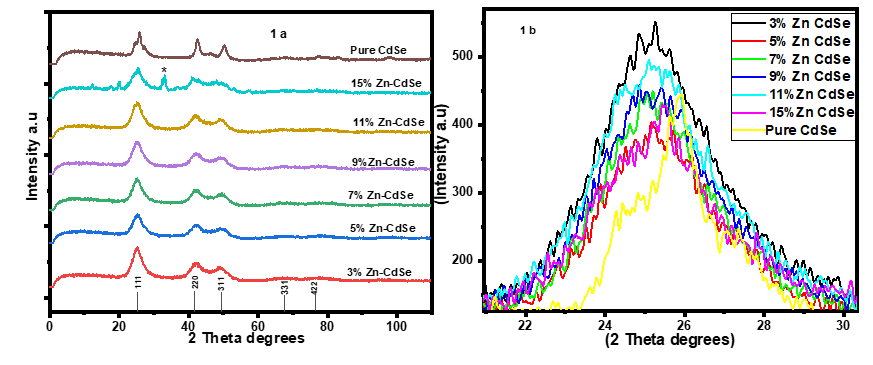 | Figure 1. 1(a) XRD spectra of Zn-CdSe and 1(b) enlarged XRD peak [100] of Zn-CdSe nanoparticles |
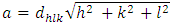
 | (2) |
 is 1.54960Å for copper
  radiation, full width at half maximum
  and
and  is the peak position. The average crystal size of CdSeNPs decreased when doped with Zn, with 15% Zn doped CdSe nanoparticles having a crystal size of 17.72 nm, 3% had 17.60nm and pure CdSeNPs had a crystal size of 24.67nm. This decrease in crystal size with increasing Zn concentration is associated with the fact that Zn limits the agglomeration of CdSeNPs and improves its surface area [20]. It is also possible that Zn2+ can substitute Cd2+ ions in the lattice of CdSe. Given that the ionic radius of Zn2+ (0.74Å) is smaller than the ionic radius of Cd2+ (0.92Å), this disparity causes a decrease in lattice parameters leading to a smaller crystallite size and more compact crystal structure [21]. The FWHM decreased when doped with 7% Zn, this indicates an improvement in crystallinity and an increase in crystal size of nanoparticles [22] as observed from the data obtained 7% zinc doped CdSe nanoparticles had an average crystal size of 20.31 nm.
|
 | (3) |
 | (4) |
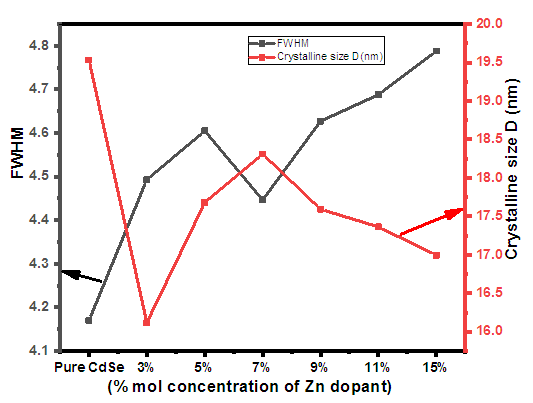 | Figure 2. Relationship between FWHM, Crystal size and Zn mol % |
3.2. Photoluminescence Spectroscopy
- The photoluminescence properties of Zn-CdSe nanoparticles were carried out at an ambient temperature at an excitation wavelength of 400 nm to determine the luminescence properties of Zn-CdSe nanoparticles and their defects. The photoluminescence properties of CdSe were found to be dopant concentration dependant. Figure 3 shows how different concentration of Zn dopant affects the FWHM, peak position and intensity of the peaks in PL. The photoluminescence intensity decreased with increase in dopant concentration and increased at low dopant concentrations. This is associated with the fact that highly doped nanoparticles excite electrons which can return to ground state without emitting photons (non-radiative recombination) [23]. 1% Zn-CdSe nanoparticles had the highest PL intensity and 15% Zn-CdSe nanoparticle had the lowest PL intensity. At high dopant concentration the emission wavelength shift to longer wavelength (red-shift) as a result of lattice strain or dopant induced defects [24]. Blue-shift was observed when low dopant concentration was used, due to quantum confinement effects that occur when the crystal size decrease the energy gap between conduction band and emission band increase [25]. The dimension of FWHM of PL spectra of samples reflects the distribution of particle size, this can be an efficient method to study size focusing. The FWHM range from 80 to 100nm and decreases with increased in dopant concentration. Narrow FWHM of the PL spectra reflects narrow particle size distribution and this can be used to investigate the size focusing [26].
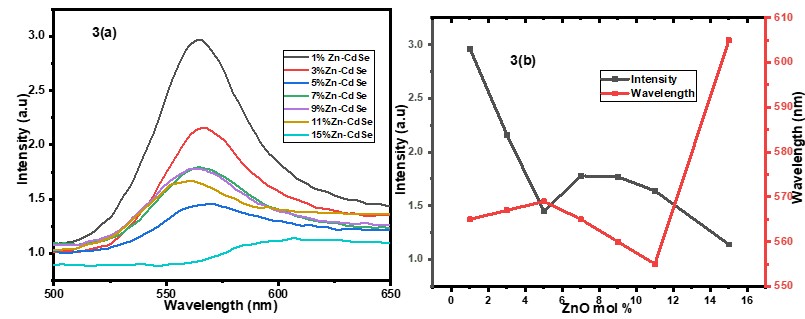 | Figure 3. (a)PL emission spectra of varying concentration of Zn-CdSeNPs 3(b) Relationship between PL Intensity, emission wavelength and mol % of Zn dopant in CdSeNPs |
3.3. Optical Properties
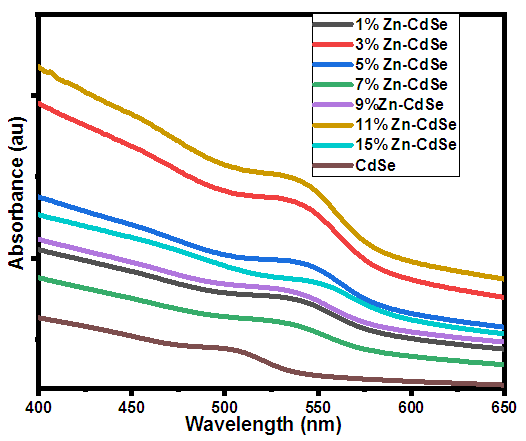
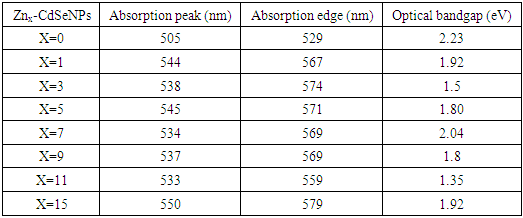
- The bandgap energy (Eg) of semi-conductors materials dispersed in liquid with known coefficient is mostly obtained using UV-vis absorption spectroscopy. Figure 4 shows the UV-vis absorbance spectra of Zn-CdSeNPs. The nanoparticles absorbed at different wavelength depending on the amount of dopant used. Highly doped Zn-CdSeNPs (15%) absorbed at higher wavelength (550nm), high concentration of dopant modifies the electronic properties of nanoparticles due to defects that result from stress, strain, interstitial and vacancies defects [27]. Bulk CdSe absorbed at a wavelength of 690nm, the shift towards the shorter wavelength confirms the formation of nanoparticles. Pure CdSe nanoparticle had the lowest absorption band and it absorbed at the lowest wavelength. Similar results were observed by Ca et al [28]. Table 2 summarizes the absorption peak and absorption edge for each concentration of dopant.
 | Figure 4. UV-Vis spectra of Zn-CdSe nanoparticles |
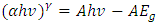 | (5) |
 is absorption coefficient and
  is direct or indirect allowed transition from valence band to conduction band. When
  is 2 it is indirect and when ½ it is direct allowed transition. The plot obtained was extrapolated to intersect the hv axis to obtain the bandgap energy. Figure 5 shows the Tauc’s plot of different concentration of Zinc dopant.
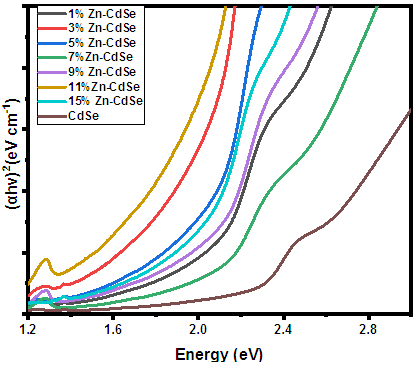 | Figure 5. Tauc’s plot of Zn-CdSe nanoparticles at varying % Zn mol concentrations |
|
4. Conclusions
- Zinc doped Cadmium selenide have been successfully prepared from cadmium chloride and L-cysteine. The XRD results displayed a cubic crystal structure for all the samples. New XRD peaks emerged at higher Zn doping concentrations. The calculated crystallite sizes from the Debye Scherrer generally showed that as the concentration of Zn dopant increase the crystal size decreased from 24.66 to 16.99 nm. The Zinc blende cubic structure of CdSe was retained when dopant was added. The intensity of PL emission was also influenced by doping concentration and the intensity of the peaks decreased with increase in concentration of dopant. The emission wavelength was observed to shift to higher values as the intensity of the peak decreased. 1% zinc doped CdSe nanoparticles had the highest intensity while 15% Zn-CdSe nanoparticles had the lowest PL intensity. The UV-Vis results displayed unique absorption features which varied with changes in the Zn doping concentrations. The bandgap energies obtained from Tauc’s plot varied from 2.23 -1.35 eV and 11% Zinc doped CdSe had the smallest bandgap while 1% Zn dopant had the highest bandgap. The structural and optical properties of CdSe nanoparticles are influenced by concentration of dopant which helps in engineering of the material properties of CdSe NPs for a suitable application.
ACKNOWLEDGEMENTS
- The author wish to thank Murang’a University of Technology for granting me access to synthesis and characterization equipment.
Conflict of Interest
- None.