Musa N.1, Onimisi M. Y.1, 2, Ikyumbur J. T.3
1Department of Applied Physics, Kaduna Polytechnic, Kaduna, Nigeria
2Department of Physics, Nigerian Defence Academy, Kaduna, Nigeria
3Department of Physics, Benue State University, Benue, Nigeria
Correspondence to: Musa N., Department of Applied Physics, Kaduna Polytechnic, Kaduna, Nigeria.
| Email: |  |
Copyright © 2020 The Author(s). Published by Scientific & Academic Publishing.
This work is licensed under the Creative Commons Attribution International License (CC BY).
http://creativecommons.org/licenses/by/4.0/

Abstract
The dielectric constant and loss factor of pure ethanol was analyzed using the Cole-Cole relaxation theory for a temperature range 10°C - 50°C and frequency spectrum of 100kHz to 50MHz, The values obtained were plotted against the frequency and temperature respectively. At the lower rung of the frequency spectrum, the dielectric constant was high and uniformly decreased as the frequency increased until it gets to saturation at 50MHz. The loss factor have peaks of 4.59 at 100kHz and temperature 10°C, 4.38 at 600kHz and temperature of 20°C, 3.97 at 1100kHz and 30°C, 3.68 at 1500kHz and 40°C and 3.40 at 2000kHz and temperature of 50°C. The peaks correspond to the relaxation points at the various frequencies listed. For the temperature dependence, the dielectric constant showed a decrease as the temperature increased for a frequency range of 100 - 500kHz, maintained an almost constant value of dielectric constant for a frequency of 1000kHz then increase weakly as the temperature increased for a frequency range of (2000kHz - 50MHz). The dielectric constant showed a slow response to temperature change while the loss factor showed a quick response to temperature change because it is a temperature sensitive parameter compared to the dielectric constant. An analysis of real and imaginary parts of dielectric permittivity has been elucidated using Cole-Cole plot of the complex permittivity. With the aid of the Cole-Cole plot, the values of static dielectric constant (εs), optical dielectric constant (ε∞) were determined within the frequency and temperature range of interest. The values obtained were in agreement with standard measurements.
Keywords:
Cole-Cole Relaxation Model, Dielectric Constant, Loss Factor, Cole-Cole plot, Frequency Dependence, Temperature Dependence
Cite this paper: Musa N., Onimisi M. Y., Ikyumbur J. T., Frequency and Temperature Dependence of Ethanol Using the Cole-Cole Relaxation Model, American Journal of Condensed Matter Physics, Vol. 10 No. 2, 2020, pp. 44-49. doi: 10.5923/j.ajcmp.20201002.03.
1. Introduction
Over the years, technological and scientific breakthroughs have been recorded in the development of materials that could withstand the complexities of today’s ever evolving world. These changes span different areas such as medicine, security, food, chemicals, drugs, paints, geosciences, to the clothes we wear. Polar protic and polar aprotic solvents are widely used in many manufacturing industries. Food, medical, chemical and pharmaceutical industries use the knowledge of dielectric properties at any stage of their production. Pharmaceutical industries for instance, constantly use water and organic solvents in their production because poorly soluble drugs present a problem in pharmaceutical formulation [6,4].Solvents with high dielectric constants encourage complete dissociation of the electrolytes whereas in solvents of low dielectric constant, considerable ion pairing occur [14]. The behavior of electrolytes in solutions could be strongly affected by the dielectric constant of the medium and this property could be used as a predictive tool in practice. Dielectric constant can be determined by oscillometry, in which the frequency of a signal is kept constant by electrically changing the capacitance between the two parallel plates. The liquid, of which the dielectric constant is being measured, is placed in a glass container between the two plates during the experiment [13].Knowing both the dielectric constant and frequency of materials is useful in engineering applications. A graphical representation of Dielectric constant against frequency gives scientist a broad knowledge of the behaviour of materials to frequency changes. This is called dielectric dispersion [2].An important thing to keep in mind is that microwaves are not forms of heat but forms of energy that are manifested as heat through their interaction with materials. It is as if they cause the materials to heat themselves. The permittivity, ε, of materials sensitive to electric and electromagnetic waves is complex and divided into two parts: the real part, ε‘, the relative dielectric constant and the imaginary part, ε‘’ or loss factor. The imaginary part (ε‘’) is a measure of the heat generated inside a material per unit time when subjected to an electric field.The inability of the Debye model of dielectric dispersion to measure the dielectric dispersion at lower frequencies (radio-waves) and the presence of multiple relaxation times, makes the use of alternative models imperative. The Cole-Cole relaxation model gives very good results for all range of frequencies and relaxation times.
2. Theoretical Background
2.1. The Clausius-Mossotti Relation
Consider the electric field at a molecular position in the dielectric, known as the molecular field or local field Eloc, which is responsible for polarizing a molecule of the dielectric. The molecular field is produced by all external sources and by all polarized molecules in the dielectric except one molecule under consideration.The referenced molecule is imagined to be surrounded by a spherical cavity (known as Lorentz sphere) sufficiently large as compared to the size of the molecule. Therefore, the local field acting on the reference molecule is given by | (1) |
Wherei. E1 is the field between two plates with no dielectric so that,  .ii. E2 is the field due to polarized charges on the plane surfaces of the dielectric facing the capacitor plates and is given by
  .iii. E3 is the field due to polarized charges on the surface of Lorentz sphere and is given by,
  .iv. E4 is the field due to permanent dipoles lying within the Lorentz sphere, let the dielectric be non-polar isotropic one, in that case, E4=0.
 | (2) |
Equation 1 is known as the Lorentz relation. The difference between the Maxwell’s Field E and the Lorentz Field Eloc is as follows: The field E is macroscopic in nature and is an average field. On the other hand Eloc is a microscopic field and is periodic in nature. This is quite large at molecular sites indicating that the molecules are more effectively polarized than they are under the influence of Maxwell’s field E. | (3) |
Eq. 3 is known as the Clausius-Mossotti relation, which relates relative permittivity with polarizability of the dielectric. The total polarizability α can be written as the sum of four terms, representing the most important contributions to the polarization i.e.,  ;Where αe, αi, αd and αs are the electronic, ionic, dipolar and space charge polarizabilities respectively.
2.2. Factors Influencing the Dielectric Properties of Materials
Dielectric properties of materials are those electrical characteristics of poorly conducting materials that determine their interaction with electric fields. These properties are important in any processes involving radio-frequency (RF) or microwave dielectric heating. They determine how well energy can be absorbed from the high-frequency alternating electric fields and thus how rapidly the materials will be heated. The dielectric properties of the load materials are also important in the design of the RF or microwave power equipment needed for the heating process. Since dielectric properties of materials are highly correlated with the amount of water in materials such as solvents, temperature and frequency play a major role in their function [3].Temperature of the material is an important factor, and its influence must be understood in dielectric heating applications. The dielectric properties are also highly variable with the frequency of the alternating fields applied to them [9].
2.3. Cole–Cole Relaxation Equation
Polar dielectrics that have more than one relaxation time do not satisfy Debye equations. They show a maximum value of ε″ that will be lower than that predicted by  . The plot ε″ versus ε′ will be distorted, and Cole–Cole relaxation showed that the plot will still be a semicircle with its center displaced below the ε′ axis. They suggested an empirical equation for the complex dielectric constant as
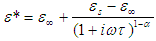 | (4) |
2.4. Mathematical Derivation of the Cole-Cole Relaxation Model
The Cole-Cole relaxation formula takes the form 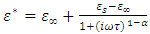 , where
  For
For  eq. 4 becomes the Debye relaxation equation.
 is the mean relaxation time and
  is a constant for a given material.Using the relation
 | (5) |
 | (6) |
Separating eq. 6 into its real and imaginary parts, we’ve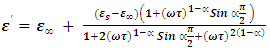 | (7a) |
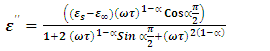 | (7b) |
2.5. Dielectric Relaxation: A Cole-Cole Model Perspective
As earlier said, the dependence of the complex dielectric constant on the angular frequency is better described by the Cole-Cole relation than by the Debye relation. [5]The Cole-Cole plots have been used widely to analyse the results obtained for the dielectric measurements in many polar liquids, there seems to be a dearth of empirical basis for Cole and Cole relation [7].This is an attempt to provide a basis for the Cole-Cole formalism using the circular method.The variation of the complex part of the dielectric constant (ε*) with the angular frequency (ω) is given by the relation: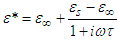 | (8a) |
where the symbols have their usual meanings.The relaxation time,  , is given by the relation:
 | (8b) |
ζ is an internal resistance which was assumed to be proportional to the static viscosity, η of the medium. However at very high frequencies of measurement, visco-elastic relaxation cannot be ruled out and hence the viscosity will lose its static value and become complex governed by the equation: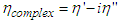 | (9) |
where  in eq. 9 are functions of the angular frequency,
  is called the dynamic viscosity and
 being the phase angle between the stress and strain vectors.From Debye’s assumption, the relaxation time,
  , should be proportional to η complex and the complex relaxation time can be written as
  | (10) |
 in eq. 10 are respectively proportional to
  and
and  and are functions of ω hence
 | (11) |
Substituting this value of  in eq. (8a) we’ve
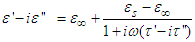 | (12) |
 | (13) |
Recall that  hence eq. 13 becomes
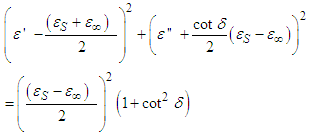 | (14) |
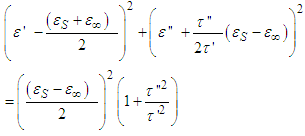
From trigonometric identities, 
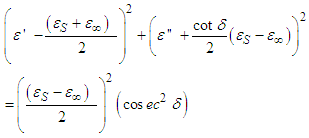 | (15) |
Where  Eq. 15 is an equation of a circle with centre at
 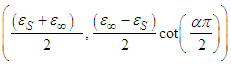 having a radius
  .It can be noticed from eq. 15 that the y coordinate of the centre is negative. This implies that the centre lies below the ε' axis.
3. Methodology
The solvents were chosen because of their wide range of use in pharmaceutical, food, paint and other chemical industries. The static and complex permittivity of ethanol were adapted from the the National Physical Laboratory (MAT-23) [8]. The algorithms were written using an interactive problem-solving environment of Maple-17.For the Cole-Cole relaxation formula, α = 0.5 was adapted to observe the broadness of the curve. The temperature range is from 10°C to 50°C and frequency range from 100kHz to 50MHz.
4. Results and Discussion
4.1. Frequency Dependence
In Fig. 1(a), the dielectric constant of Ethanol is higher at l00kHz i.e. 20.99, 20.47. 19.84, 19.08 and 18.29 at 10°C, 20°C, 30°C, 40°C and 50°C respectively and decreases uniformly as the frequency increased and becomes almost constant at the highest frequency of 50 MHz. The very high values the dielectric constant at the lower rung of the frequency spectrum can be attributed to all the polarization mechanism being present while the behaviour of the dielectric constant at the highest frequency can be characterized as the dielectric relaxation point. Also, Dielectric constant decreases with an increase in frequency because of the stumpy nature of the total polarization. The decrease in the dielectric constant of ethanol is due the space charge and orientation polarizations that could not follow fast changes in the frequency [12].In Fig. 1(b) the values of the loss factor at the initial frequency, 100kHz are 4.67, 3.15, 2.67, 20 and 1.90 at 10°C, 20°C, 30°C, 40°C and 50°C respectively.The loss factor peaks at the following frequencies (4.59, 600kHz); (4.28, 800kHz); (3.97, 1100kHz); (3.68, 1500kHz) and (3.40, 2000kHz) at 10°C, 20°C, 30°C, 40°C and 50°C respectively. This corresponds to the relaxation point of the solvent at that temperature.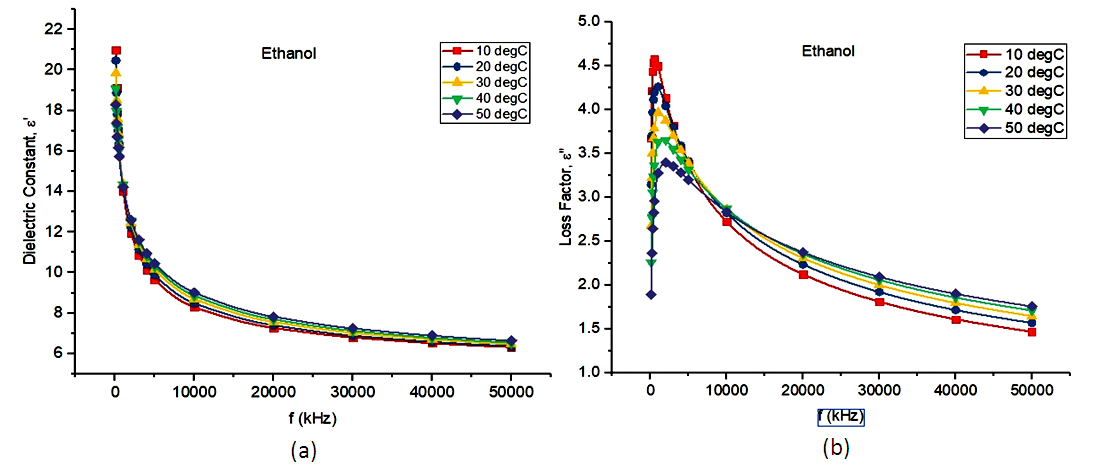 | Figure 1. Graphs of (a) dielectric constant and (b) Loss factor against frequency for ethanol |
4.2. Temperature Dependence
Fig. 2(a) shows a fall in dielectric constant as the temperature rises for the frequency range (100kHz - 500kHz). The decrease in the dielectric constant as temperature increases could be due to the relaxation time which is fast at high temperatures and increases dramatically at low temperatures [1]. At high temperatures, the thermal energy will increase and likely disorient the dipoles. At frequency, 1000kHz, the dielectric constant is almost constant as temperature increases. This constant value of the dielectric constant could be attributed to the slow oscillation of the dipoles as the frequency of the alternating field rises. Beyond 1000kHz, the dielectric constant shows a gradual rise as the temperature increases. This phenomenon may be due to the momentum gain by the dipoles as the frequencies and temperatures change. It also follows the fact that the real part of the dielectric permittivity is more frequency dependent.Fig. 2(b) shows a similar fall in the loss factor as the temperature rises. The frequency range is however longer than that of Fig. 2(a) (100kHz - 5000kHz). The decrease in the loss factor could be attributed to the decrease in viscosity as the temperature increases [11]. Beyond 5000 kHz, the dielectric loss factor rose with an increase in temperature. This rise of the dielectric loss factor with temperature leads to what is called thermal runaway. In this case the operating frequency is either higher or lower than the relaxation frequency.Fig. 2(b) shows a steeper slope for the increase in dielectric loss factor against temperature than that of the dielectric constant. This could be attributed to the increase in ionic conduction at higher temperature that produces additional effect on dielectric loss factor than on the dielectric constant.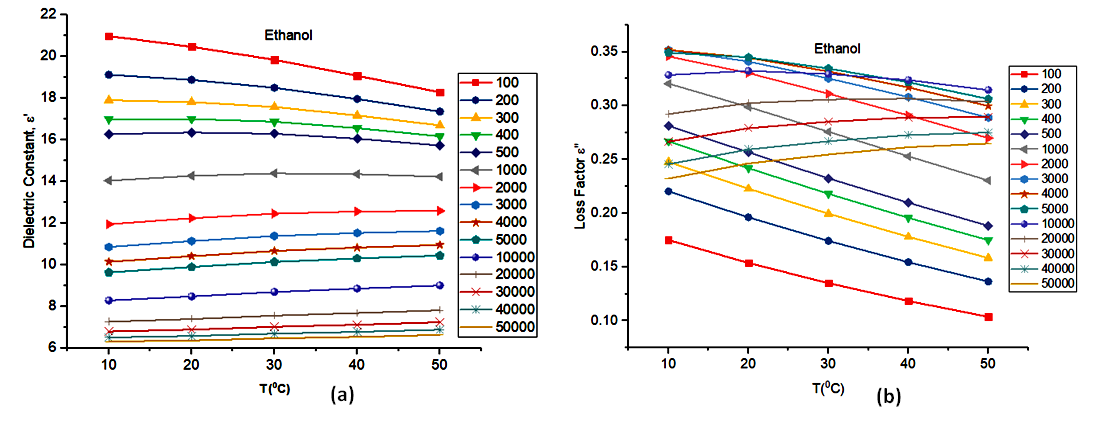 | Figure 2. (a) Dielectric Constant and (b)Loss Factor vs Temperature |
4.3. Cole-Cole Plot
The plot of the real part of the complex permittivity in the x-axis and the imaginary part on the y-axis is known as the Cole-Cole plot. Fig. 3 shows the Cole-Cole plot of pure ethanol for a temperature range between 10°C to 50°C. 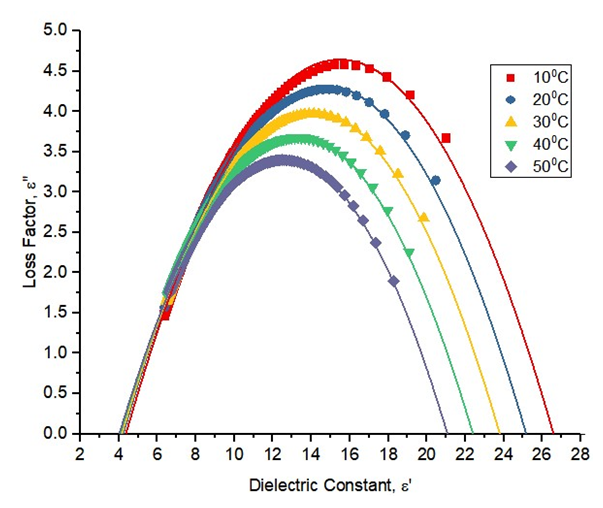 | Figure 3. The Cole-Cole plot for ethanol for temperatures from 10°C to 50°C |
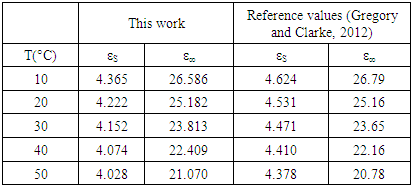
It is plot shows the polynomial fit for the plotted points. For pure solvents, the shape is a depressed circles with their centres below the abscissa. With their centre lying below the real dielectric constant axis showed a non-Debye relaxation behaviour with distributed relaxation times. The depressed circles show an almost common static dielectric constant, εS and a dispersed optical dielectric constant,  . The dispersion at the highest frequency could be attributed to an increase in the degree of freedom of the molecules [11].From the polynomial fit of the plotted graph, the static dielectric constant (εs) and dielectric constant at very high frequencies were measured and tabulated as shown below.
Table 1. Real dielectric constant vs the optical (imaginary) dielectric constant for this work and reference values
 |
| |
|
5. Conclusions
This paper looked at two parameters and their effect on ethanol. Ethanol is widely used in our pharmaceutical industries and even in our local traditional medicines. Between 100kHz and 50MHz and at a temperature range of 10°C to 50°C, numerical calculations were carried out using the Cole-Cole relaxation model. From the data generated for the static and complex permittivities, graphs were plotted for frequency and temperature dependence of the dielectric constant and loss factor.Dielectric constant decreases with an increase in frequency because the dipoles cannot follow the applied external electric field at higher frequencies. The loss factor increases to a maximum within the frequency of 200kHz to 1500kHz and falls rapidly as the frequency increases. This behaviour exhibited by the loss factor is due to the electromagnetic energy of the ethanol changing to heat energy. For temperature dependence the steepness of the slopes from Fig. 2a and 2b shows that as the frequency increases, the dielectric and loss factors both decrease. The dielectric constant, at a frequency of 500kHz, is impervious to the temperature changes. While the dielectric constant showed a noticeably slow downward trend as the temperature rose from 10°C to 50°C. This could be because the electromagnetic energy of the material changes to heat energy. Dielectric constant is more a frequency dependent parameter than the loss factor.The Cole-Cole plot showed depressed circles with their centres below the abscissa. These depressed circles show an almost common static dielectric constant, εS and a dispersed optical dielectric constant,  . The dispersion at the highest frequency could be attributed to an increase in the degree of freedom of the molecules.
References
| [1] | Ahmad, M.M., Yamada, K. (2007). Superionic PbSnF4. A giant dielectric constant material. Appl Phys. Lett. 19(5): 052912-13. |
| [2] | Aly, M.B., Haroun, A.E, and Ibraheim, M.A. (2011). Impacts of Temperature and Frequency on the Dielectric Properties for Insight into the Nature of the Charge Transports in the TI2S Layered Single Crystals. Journal of Modern Physics, 2: 12-25. |
| [3] | Antara, B., Preethi, K.R.S.M and Varma, K.B.R. (2011). Dielectric Relaxation Behaviour of SR2SbMnO6 Ceramics fanricated from nanocrystalline powders prepared by molten salt synthesis. Bull. Mater. Sci. 44(1). |
| [4] | Behera, A.L., Sahoo, S.K., and Patil, S.V. (2010). Enhancement of Solubility; A pharmaceutical Overview. Der. Pharmacia Lett. 2(2): 310-318. |
| [5] | Cole, K.S. and Cole, R.H. (1941). "Dispersion and Absorption in Dielectrics - I Alternating Current Characteristics". J. Chem. Phys. 9: 341- 352. Bibcode: 1941 JChPh...9..341C. doi:10.1063/1.1750906. |
| [6] | Craig, DQ. M. (1995). Dielectric Analysis of Pharmaceutical Systems, Taylor & Francis. London. |
| [7] | Frohlich, H., (1958). Theory of dielectrics, Oxford University Press, Oxford. |
| [8] | Gregory, A.P. and Clarke, R.N. (2012). Tables of complex permittivity of dielectric reference liquids at frequencies up to 5 GHz. NPL Report MAT 23. |
| [9] | Ikyumbur, T.J., Asagha, E.N., Hemba, E.C. and Bash, J.A. (2017) Dielectric Properties of 1-ethyl-4-mrthyl-imazolium Tetrafluoroborate (EMIM-BF4) Using Cole-Cole Relaxation Model. Physical Science international Journal 13(3) 1-6. |
| [10] | Ikyumbur, T.J. (2019). Analysis of the behaviour of the dielectric properties of ethanol used by pharmaceutical industries in Cole-Cole and Debye relaxation models. A paper presented at the Nigerian Institute of Physics conference 2019 Owerri, Nigeria. |
| [11] | Nafees, A., Sinha, A., Rao, N.V.S, Kalita, G., Mohiuddin, G., Paul, M.K. (2016). Design, synthesis and mesomorphic behaviour of four-ring achiral bent-core liquid crystal in nematic phase. RSC. Adv. 6. 43069. DOI: 10.1039/c6ra05125a. |
| [12] | Onimisi, M.Y. and Ikyumbur, T.J (2015). Comparative Analysis of Dielectric Constant and loss factor of Pure Butan-1-ol and Ethanol. AJCMP.; 5(3); 59-75. |
| [13] | Schoemaker, D.P., Garland, C.W., and Nibler, J. W. (1989). Experiments in Physical Chemistry, 5th Ed. McGraw-Hill, New York: 402-418. |
| [14] | Stengele, A., Rey, St., and Leuenberger, H (2001). A novel approach to the characterization of polar liquids. Part I: pure liquids, Int. J. Pharm. 225: 123-134. |

 Abstract
 Reference
 Full-Text PDF
 Full-text HTML