-
Paper Information
- Paper Submission
-
Journal Information
- About This Journal
- Editorial Board
- Current Issue
- Archive
- Author Guidelines
- Contact Us
American Journal of Condensed Matter Physics
p-ISSN: 2163-1115 e-ISSN: 2163-1123
2020; 10(2): 39-43
doi:10.5923/j.ajcmp.20201002.02
Received: Nov. 1, 2020; Accepted: Nov. 22, 2020; Published: Nov. 28, 2020

Study on Conduction Mechanism, Ferrous Ion Concentration, Oxygen Deficiency, and Fermi Energy Determination from a Thermal Variation of Seebeck Coefficient Measurement for Zn0.3Mn0.7+xSixFe2-2xO4 Ferrite Series
 Abstract
 Reference
 Full-Text PDF
 Full-text HTML
Kiran G. Saija1, Pooja Y. Raval2, Nimish H. Vasoya3, Uday N. Trivedi4, Kunal B. Modi5
1Smt. R. P. Bhalodia Mahila College, Upleta, India
2Department of Physics, C. U. Shah University, Wadhwan City, Surendranagar, India
3Department of Balbhavan, Children's University, Sector -20, Gandhinagar, India
4Government Polytechnic, Ahmedabad, India
5Department of Physics, Saurashtra University, Rajkot, India
Correspondence to: Kunal B. Modi, Department of Physics, Saurashtra University, Rajkot, India.
| Email: |  |
Copyright © 2020 The Author(s). Published by Scientific & Academic Publishing.
This work is licensed under the Creative Commons Attribution International License (CC BY).
http://creativecommons.org/licenses/by/4.0/

The compositional and temperature (T = 300 – 525 K) dependence of Seebeck coefficient measurement has been carried out on microcrystalline ferrite samples of Zn0.3Mn0.7+xSixFe2-2xO4 (x = 0.0, 0.1, 0.2 and 0.3) series. The probable conduction mechanism is the exchange of electrons between Fe3+ and Fe2+ ions on the octahedral interstitial site of the spinel structure. The absolute concentration of ferrous and ferric ions has been deduced that used to determine the actual occupancy of metallic cations, oxygen deficiency, and to describe the compositional variation of dc resistivity. Finally, the Fermi energy values at T = 0 K have been derived.
Keywords: Ferrites,Thermoelectric power study, Conduction mechanism, Fermi energy
Cite this paper: Kiran G. Saija, Pooja Y. Raval, Nimish H. Vasoya, Uday N. Trivedi, Kunal B. Modi, Study on Conduction Mechanism, Ferrous Ion Concentration, Oxygen Deficiency, and Fermi Energy Determination from a Thermal Variation of Seebeck Coefficient Measurement for Zn0.3Mn0.7+xSixFe2-2xO4 Ferrite Series, American Journal of Condensed Matter Physics, Vol. 10 No. 2, 2020, pp. 39-43. doi: 10.5923/j.ajcmp.20201002.02.
1. Introduction
- The Seebeck coefficient is also referred to as thermoelectric sensitivity, thermopower, and thermoelectric power. The Hall coefficient and Seebeck coefficient measurements are the most promising characterization techniques to understand responsible mechanisms for electrical conduction in various classes of materials. Regarding low mobility and high resistivity materials, for instance, ferrites, and perovskites, the Hall voltage measurement becomes difficult. The only alternative in such a case is the temperature dependence of Seebeck coefficient measurement. The thermoelectric power measurement is very simple and carrier type (holes or electrons) accountable for the conduction process can be decided without any ambiguity. This is further used to determine many important parameters, charge carrier density, Fermi energy, mobility of charge carrier, oxygen deficiency, activation energy, charge disproportionation, etc., [1-5].Restricted to thermopower study on spinel structured ferrite series, in recent years (2016 - 2020), very limited research communications are available in literature. Polycrystalline sample of magnesium ferrite (MgFe2 O4) synthesized by spark plasma and solid-state reaction sintering processes [6], non-stoichiometric ferrite system, Mg0.5+xCuxZn0.5Fe1.9O4-δ (x = 0.0 - 0.3) [7], Ni2+ - substituted Mg-Cu-Zn ferrites [8], tetravalent Sn4+ substituted copper ferrite [9] and Li0.5 – 0.5xCuxFe2.5 – 0.5xO4 (x = 0.0 -1.0) series [1] have been investigated for their thermoelectric sensitivity. The thermoelectric properties of composites of carbon nanotubes, multiwalled carbon nanotubes, graphene and Mn0.7Zn0.3Fe2O4 spinel ferrite synthesized by spark plasma sintering process have been studied by Zhang et al. [10-12]. Thermopower study has been carried out on nanoparticles of MnxZn1-xFe2O4 (x = 0.0 – 1.0) [13], NiSmxFe2-xO4 [14], CoxMn0.5-xZn0.5Fe2O4 (x = 0.0, 0.1, 0.3 and 0.5) [15], and Li0.15Ni0.5Sm0.1Fe2.15O4 [16] spinel ferrite systems prepared by co-precipitation technique/citrate –gel auto combustion route.In recent years, the structural, microstructural, bulk magnetic, electric and dielectric characteristics of ferrite series, Zn0.3Mn0.7+xSixFe2-2xO4 with x = 0.0, 0.1, 0.2 and 0.3, by means of energy dispersive analysis of X-rays (EDAX), X-ray powder diffractometry (XRD), scanning electron microscopy (SEM), bulk magnetization (Hmax = 2.5 kOe, T = 80 K and 300 K ), temperature dependence of low field (0.5 Oe) ac (263 Hz) susceptibility measurement (T = 300 K – 525 K), temperature dependence of dc resistivity measurement (T = 300 K - 773 K), current versus voltage (I - V) characteristics (T = 300 K – 673 K and V = 0 – 400 V), frequency (f = 20 Hz – 1 MHz) and temperature (T = 300 K – 673 K) dependent permeability and dielectric constants measurements have been investigated [17-23].In this communication, the thermal variation of Seebeck coefficient (
 ) measurement carried out on this well-characterized system, Zn0.3Mn0.7+xSixFe2-2xO4 (x = 0.0 – 0.3), has been reported. The values of α have been used to calculate ferrous ion concentration, oxygen deficiency, and Fermi energy.
2. Experimental Details
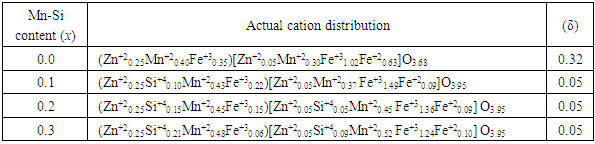
- The technical particulars related to the preparation of four single-phase, microcrystalline compositions of ferrite series, Zn0.3Mn0.7+xSixFe2-2xO4 where x = 0.0, 0.1, 0.2 and 0.3, by high-temperature solid-state reaction method, phase analysis, and structural parameters including cation distribution determination from X-ray diffraction line intensity calculations [20,22] and thermoelectric power measurement are well described in [2-5].
3. Results and Discussion
- The values of the thermoelectric power coefficient
 have been calculated by
  = V/T, where V is the electric potential difference generated as a result of temperature difference (ΔT) between the hot junction temperature (T) and the cold junction temperature (T´). The
  values show small variation ( 1.0%) during the heating and cooling cycles of measurement. In Fig. 1, the
  plots for the system, Zn0.3Mn0.7+xSixFe2-2xO4 (x = 0.0, 0.1, 0.2 and 0.3) are depicted. It is found that for all the compositions
  is negative throughout the temperature range studied. This suggests that electrons are the majority charge carriers or dominant conduction mechanism is n-type in the series. Earlier, Ivanovskaya et al. [24] have shown that Mn-Zn ferrite materials synthesized without controlled parameters (high-pressure preparation of material in an oxygen atmosphere) possess oxygen vacancies, that turns out to be a partial reduction of ferric ion (Fe3+ ) into ferrous ion (Fe2+ ) in the system. The existence of Fe3+ ions in other valance states (Fe2+ or Fe4+ ) results in interesting changes in the electrical characteristics of ferrites [24-26]. At the octahedral (B-) sites of the spinel structure, the exchange of electron takes place between Fe3+ and Fe2+ by the conduction mechanism: Fe2+ ↔ Fe3+ + e-.
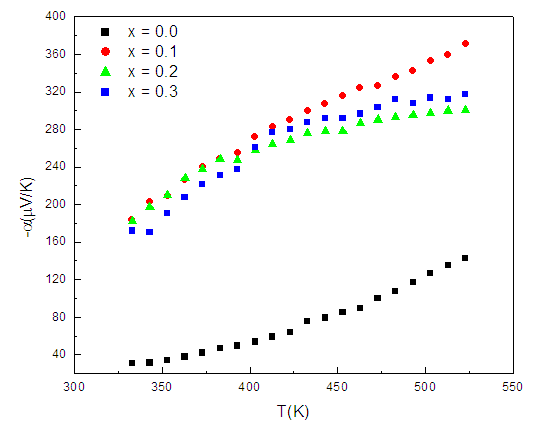 | Figure 1. Seebeck coefficient (α) against hot junction temperature plots for Zn0.3Mn0.7+xSixFe2-2xO4 series |
 ) initially increases rapidly with temperature from T = 300 – 425 K while α increases slowly with a further increase in temperature (T ≥ 425 K) for all the compositions. This observed variation in
  curves can be explained as follows. In n-type semiconducting material, owing to the loss of electrons, the hot surface becomes positively charged while the cold surface becomes negatively charged due to the diffusion of these liberated electrons. The hopping mechanism, Fe2+ ↔ Fe3+ + e-, turns out to be most probable on increasing temperature that produces electrons. The accumulation of such electrons at the cold surface results in the development of potential difference
  thus α increases rapidly during T = 300 – 425 K. The observed small variation in
  with T for T ≥ 425 K is mainly due to the saturation in the generation of electrons and electrons-holes recombination in the system. When valence electrons are given energy equal or greater than the energy band gap, they will be transferred to the conduction band and recombination of an electron-hole occurs. Following the classifications proposed by Bashikiriv et al. [27], the significant variation in
  with T (Fig. 1) suggests that the ferrite materials under investigation are non-degenerate semiconductors.The thermoelectric power
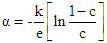
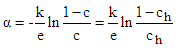
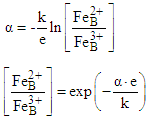
  in the instance of hopping conduction is given by the formula as suggested by Heikes formula [28]:
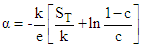 | (1) |
 | (2) |
 | (3) |
 | (4) |
|
|
 and EF are correlated by the relation [34]:
 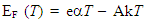 | (5) |
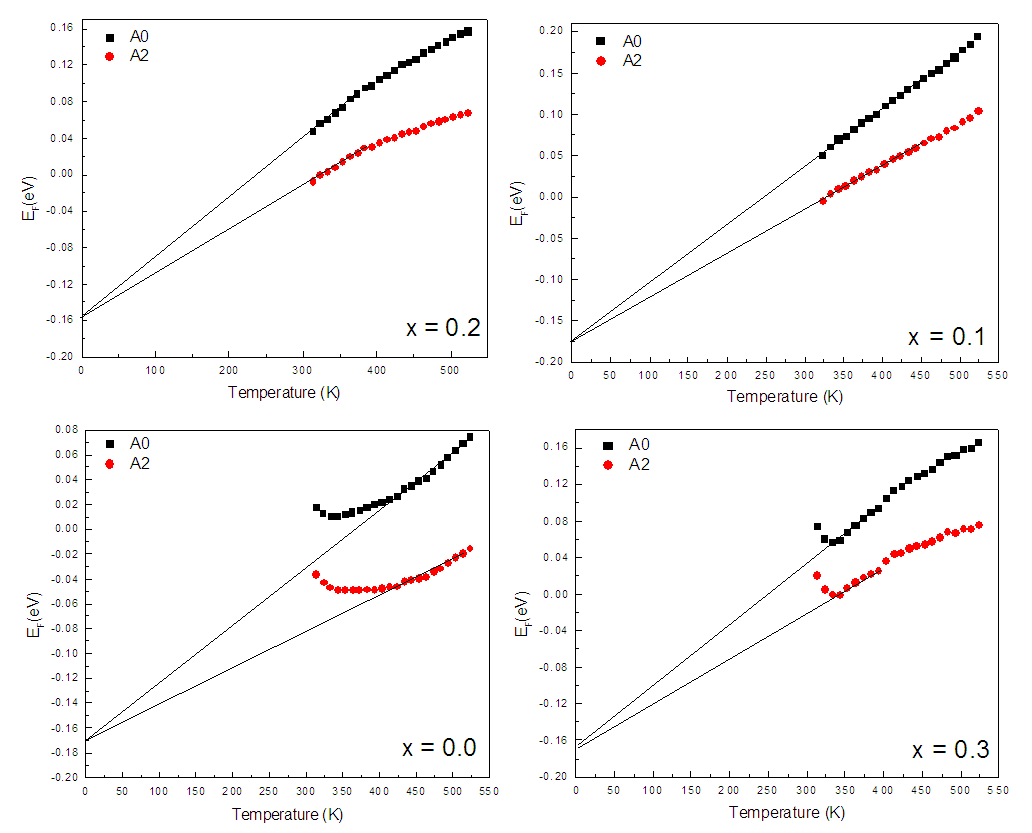 | Figure 2. Thermal variation of Fermi energy for Zn0.3Mn0.7+xSixFe2-2xO4 series |
4. Conclusions
- The following intriguing conclusions are drawn based on the compositional and thermal variation of thermoelectric power study on ferrite series, Zn0.3Mn0.7+xSixFe2-2xO4 (x = 0.0 – 0.3). The ferrites under investigation are non-degenerate semiconducting materials and the exchange of electrons among ferrous (Fe2+) and ferric (Fe3+) ions on the octahedral site is the governing mechanism of electrical conduction. The relative and absolute concentration of ferrous and ferric ions, as well as oxygen deficiency, can be determined from the temperature-dependent thermopower measurement. The Fermi energy shows compositional variation consistent with the variation of Fe2+ - ions in the system.