Nwoke J. E. 1, Onimisi M. Y. 1, Jonah S. A. 2, R. A. Tafida 1
1Department of Physics, Nigerian Defence Academy, Kaduna, Nigeria
2Centre for Energy Research and Training/Amahdu Bellow University, Zaria, Nigeria
Correspondence to: Nwoke J. E. , Department of Physics, Nigerian Defence Academy, Kaduna, Nigeria.
| Email: |  |
Copyright © 2017 Scientific & Academic Publishing. All Rights Reserved.
This work is licensed under the Creative Commons Attribution International License (CC BY).
http://creativecommons.org/licenses/by/4.0/

Abstract
The health effects due to exposure to non-ionizing radiation (electric and magnetic fields) from high tension cables (power lines) around Kaduna metropolis was investigated. A total of 187 measurements each for electric and magnetic fields from 11KV, 33KV, 132KV and 330KV categories of power line from different locations including a power transmission sub-station in Kaduna were taken and analyzed. These measurements were taken at 1m above the ground and at 10m from the base of the power line to about 100m away using Electro smog meter. The maximum measured values were 6.07V/m for electric field and 7.27µT for magnetic field for public exposure. Comparing these values with ICNIRP 2010 guidance level of 5KV/m and 200µT respectively, the measured values are about 0.12% and 3.6% respectively of ICNIRP 2010 guideline. For occupational exposure, the measured values are 7.94V/m and 8.54µT respectively and compared to ICNIRP 2010 values of 10KV/m and 1mT respectively for occupational exposure, the measured values are about 0.08% and 0.85% of ICNIRP2010 guideline.
Keywords:
Non-ionizing radiation, Electric field, Magnetic field, Power line, Kaduna metropolis, ICNIRP 2010 guideline
Cite this paper: Nwoke J. E. , Onimisi M. Y. , Jonah S. A. , R. A. Tafida , Measurement and Analysis of Health Effects Due to Exposure to Non-Ionizing Radiation from High Tension Cables around Kaduna Metropolis, North West, Nigeria, American Journal of Condensed Matter Physics, Vol. 7 No. 3, 2017, pp. 73-80. doi: 10.5923/j.ajcmp.20170703.03.
1. Introduction
Electromagnetic field (EMF) is composed of the electric and the magnetic fields. These fields are time-varying vector quantities which depend on their frequency, phase, magnitude and direction. The electric field is created by the presence of an electric charge, and describes the magnitude and direction of the force it exerts on a positive electric charge. The magnitude of the electric field depends on the difference in potential between charge-carrying bodies (conductors) regardless of the amount of current flowing through the conductor. Conversely a magnetic field is created by the motion of electric charges in form of electric current, and gives the numbers of charges per second passing through the conductor. The magnitude of the magnetic field is proportional to the current flowing in a conductor, regardless of the voltage present. Therefore, wherever electricity is generated, transmitted or used, EMF is generated. This includes electric high tension cables (power lines), which oscillate at 60 cycles per second (power line frequency) transformers, electric panels, service wires, mobile phone, television, electric ovens and cookers, shavers, fans, electric blankets, water bath, food processors, microwave devices. Thus we encounter EMF emissions everywhere in our environment, which can pose health risks, especially when one is in this “unsafe field” on a regular daily basis, like at homes, schools or offices located near power lines and transformers. The concerns on the health risks associated with living near high-voltage power lines were first raised in 1979 in a study by Wertheimer and Leeper, which associated increased risk of childhood leukemia with residential proximity to power lines (Wertheiner 1979). More recent studies by Draper and his group confirmed a reported association between elevated risks of childhood leukemia and proximity to power lines (Draper 2014). Some scientists have argued the physical impossibility of any health effects due to weak ambient levels of electromagnetic fields, while others maintained that the potential health risks should not be dismissed even though the evidence remains equivocal and contradictory. While these arguments about health effects of emission from electromagnetic fields go on, in 2001 and 2011 the World Health Organization (WHO) entered extremely low frequency (ELF), which is the frequency range of electric and magnetic fields; and radio frequency (RF) respectively into the list of possible carcinogenic in human (HREG 2004). Melatonin, a hormone produced by the pineal gland and produced mostly at night, is known to act as a natural anti- cancer agent and its reduced levels in the body have also been linked to increased risk of depression (HREG, 2004). It has been shown that magnetic fields disrupt melatonin production, in a similar way as light does, and that the various illnesses associated with magnetic field could be caused by melatonin disruption (HREG, 2004). According to European Union Report 2013, electric and magnetic fields can induce electric fields in the body which can interfere with the body’s nervous system. Although there are no known health risks that has been conclusively demonstrated to be caused by living near high-voltage power line, however science is unable to prove that the low-level magnetic and electric fields are completely risk free. The research on safety or otherwise in living near power lines is continuous.Transmission lines carry 3-phase electric current from one point to another in an electric power system. The voltages vary from 11 KV to 330 KV in Nigeria. These are transported over long distance via high tension grid. When current goes through a wire, it generates magnetic field, and the field travels far from the line compared to the electric field produced. The field virtually passes through all materials and affects us more compared to electric field (Hal, 1997). Transmission lines are therefore the dominant source of magnetic field in our environment. It has been confirmed that life is not safe under this high HV power lines (Siaka, 2010). Apart from the consequence of electric shock that can happen, the magnetic field created around the wire by the flowing current can have adverse biological effects on human like neurological, cardiovascular disorders and low sperm count in the workers who regularly service the line (Siaka, 2010, Ibrahim M. 2011). To mitigate the effect of electromagnetic (EM) radiation from power line on human beings living/working close to the lines, the authority, Power Holding Company of Nigeria (PHCN) (formally National Electric Power Authority NEPA), makes it clear that any building constructed along the HV lines must give a right-of-way (RoW) of 10m for 11KV and 33KV, 15m for 132 KV and 25m for 330KV lines (NEPA news, 2000, Ibrahim M. 2011). Based on these guide lines, this work focused on the measurement of electric and magnetic fields from high tension cables located close to houses, schools, work places around Kaduna metropolis to determine emission levels of these radiations and the consequences on those living around the areas.
2. Interaction of Human Body with Magnetic Field of Power Line
Exposure to power line results in internal body currents and energy absorption in tissues as a result of thermo-molecular agitation that depends on the coupling mechanisms, the frequency (f) and the electrical conductivity of the medium (σ). In magnetic media, permeability (µ) relates magnetic field intensity (H) to magnetic flux density (B) by | (1) |
From Ohm’s Law, the current density (J) depends upon the magnetic flux density (B), field frequency (f) derived from Faraday’s law of induction and radius of the induction loop (R) (Stuchly and Xi, 1994, Ibrahim, M. 2011) and it can be expressed mathematically as  | (2) |
The magnetically - induced electric currents are greatest at the periphery of the body. The maximum ground level magnetic field strengths associated with overhead transmission lines are of the order of 0.01 - 0.05 mT (it is either on the centre line or under the outer conductors) and are also related to line height. The magnetic flux density decreases in an approximately linear fashion with distance from the conductor (Zaffanella and Deno, 1978). Thus, a magnetic field induces subtle electric current within the body. There are two types of electric current caused by magnetic field induction (Zaffanella and Deno, 1978): circulating current inside the object (eddy current) and current entering/leaving the object. These currents could affect biological processes in the body. The eddy current induced in the body is not conducted to ground and it causes voltage difference within the body which may be as high as 1 mV if the magnetic flux density reaches approximately 0.028 mT (Hauf, 1982, Ibrahim, M. 2011).
3. Materials and Method
The Electro smog meter was used for the measurement of electric and magnetic fields (non-ionizing radiation). It is a portable device of 247x60x67mm dimension and 250g weight designed for safe measurement of EMF characteristics by isotropic method. It is a 4 digit liquid crystal detector (LCD) with 0.55 update equipped with 3 - channel sensor which allows measuring on three axes X, Y, Z simultaneously, with calibration setting range from 0.20 to 5.00. It measures magnetic and electric fields in units of mA/m, µA/m and mV/m, V/m respectively at measurement cycle of 60 seconds with measuring ranges of 53µA/m to 288.4 mA/m for magnetic field and 20mV/m to 108 V/m for electric field and absolute error of ± 1.0 dB. There is the overload limit of 200V/m which is signified by the in- built alarm threshold and memory function. Values are displayed in instantaneous value, maximum value, average value or maximum average value. The device has data memory of 99sets, storage temperature range of 0°C to 50°C and relative humidity range of 25% to 75%. Apart from electric and magnetic fields, Electro smog meter can also be used to measure EM radiations from wireless communications, radio stations, micro waves, Wi-Fi, television and other sources of high frequency electromagnetic radiation.The calibration factor CAL serves to calibrate the result display. The field strength value measured internally is multiplied by the value of CAL that has been entered and the resulting value is displayed. The CAL setting range is from 0.20 to 5.00. The CAL factor is often used as a means of entering the sensitivity of the field sensor in terms of its frequency response in order to improve measurement accuracy. The range of frequency of fields measured in this work has calibration factor of 1. The calibration factor was selected and also to set the meter at X, Y and Z axes. The meter was kept at 1m above the ground, positioned facing the source of field and held steady during the measurement to avoid display of excess field value that does not reflect the actual field condition, which is caused by electrostatic charges. The manual data reading mode was set and the stop clock switched on to time 60 seconds after which the reading was viewed in turn. Measurement was taken at the base of each power line and then at 10 m from the base up to about 100 m in units of V/m and mA/m for electric and magnetic field respectively. Electro smog meter measures magnetic field strength (H) in mA/m, so the values were converted to the magnetic flux density (B) in tesla (T) using the relation B = µH where µ is given as 4πx10-7NA-2.
4. Results and Discussion
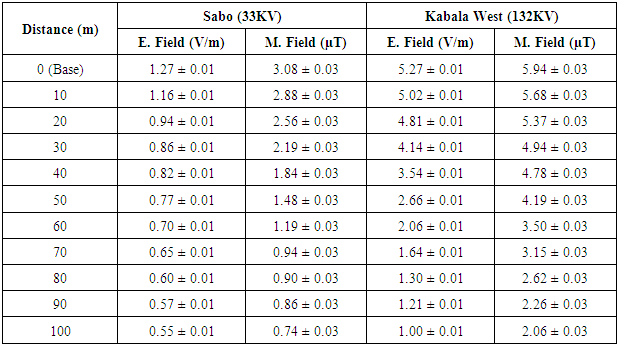
The results of the electric and magnetic fields from different capacities of power lines in different locations in Kaduna metropolis are shown in the Tables 1-4 below:Table 1. Measured Data from Sabo and Kabala West locations
 |
| |
|
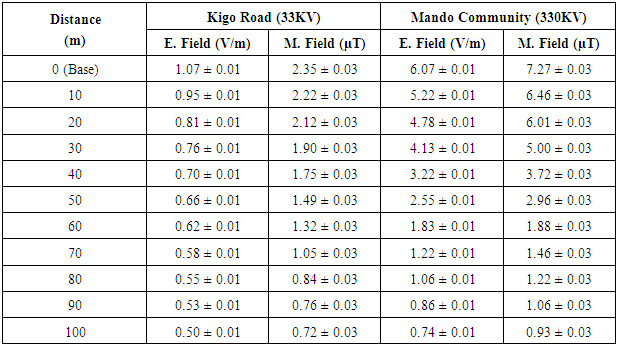
Table 2. Measured Data from Kigo Road and Mando Community locations
 |
| |
|
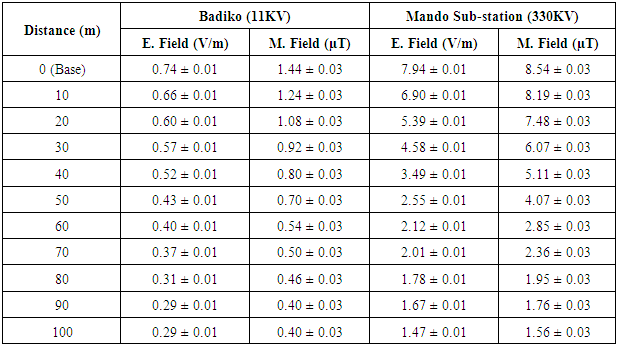
Table 3. Measured Data from Badiko and Mando Sub-station locations
 |
| |
|
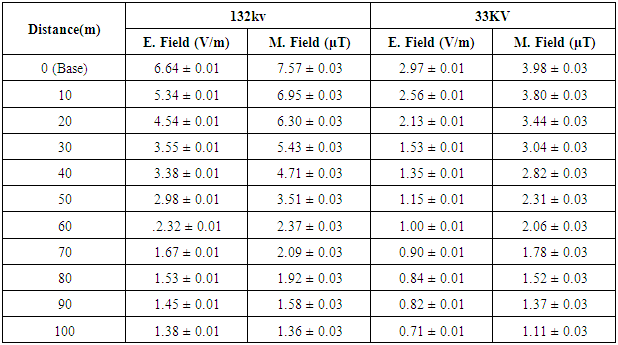
Table 4. Measured Data from Mando Power Sub- Station
 |
| |
|
The transmission sub-station is where the electric power at high voltage, from the generating station (Kainji Dam) is transmitted to Kaduna for distribution. The power is stepped down at the sub-station and then transmitted to the various sub-units in the state, where it is further stepped down through transformers before distributing to communities in the state. So the fields at the sub-station are very high compared to other areas.
4.1. Graphical Analysis of Measured Data
Figures 1-8 depict graphical display of the electric and magnetic fields as a function of distance from the base of the power lines.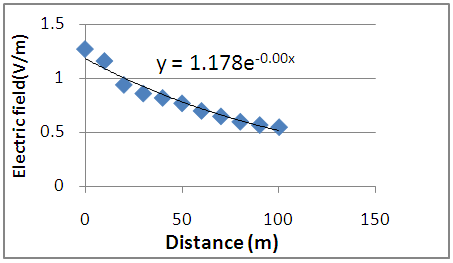 | Figure 1(a). Graphs of Electric fields from 33KV Power line at Sabo as a function of horizontal Distance |
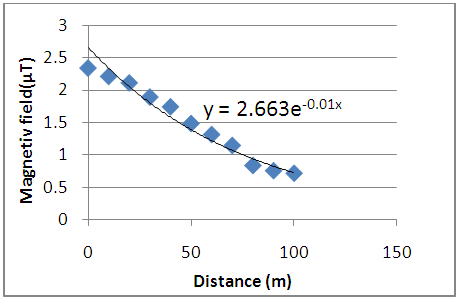
YE = 1.178e-0.006X where YE is the electric field and x is the horizontal distance from the base of the power line. Thus at 10m (RoW for 33KV), the electric field will be about 1.11V/m which compare to ICNIRP 2010 value of 5Kv/m is about 0.02% of the ICNIRP data.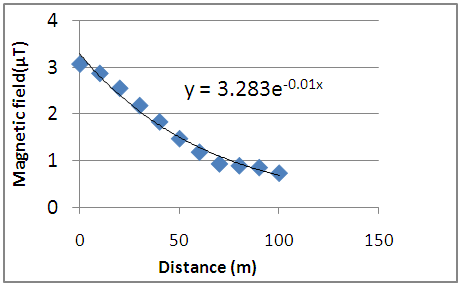 | Figure 1(b). Graph of Magnetic field from 33KV Power line at Sabo as a function of horizontal Distance |
Figure 1(b) shows magnetic field YM = 3.2833e-0.016X, so that at 10m distance (X) the magnetic field will be about 2.79µT which compare to ICNIRP 2010 value of 200 µT, is about 1.4% of the ICNIRP data.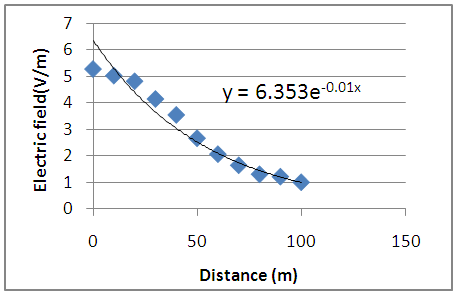 | Figure 2(a). Graph of Electric field from 132KV Power line at Kabala West as a function of horizontal Distance |
Figure 2(a) shows YE = 6.3538e-0.016X so that the field at 15m (RoW for 132KV), is about 4.98V/m, about 0.1% of the ICNIRP data.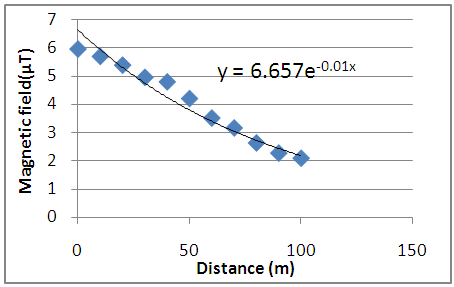 | Figure 2(b). Graph of Magnetic field from 132KV at Kabala West as a function of horizontal Distance |
Figure 2(b): YM = 6.6579e-0.011X and at 15m distances, the field is about 5.65µT about 2.83% of the ICNIRP value.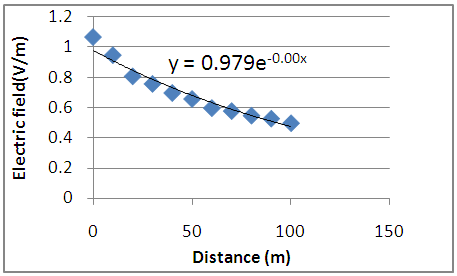 | Figure 3(a). Graph of Electric field from 33KV Power line at Kigo Road as a function of horizontal Distance |
 | Figure 3(b). Graph of Magnetic field from 33KV Power line at Kigo Road as a function of horizontal Distance |
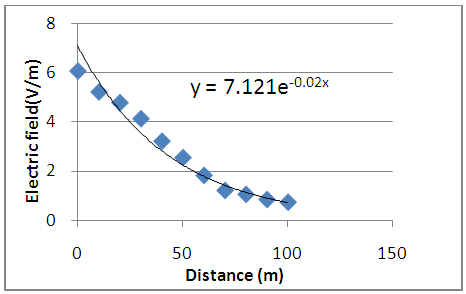 | Figure 4(a). Graph of Electric field from 330KV Power line at Mando Community as a function of horizontal Distance |
Figure 4(a) shows YE =7.1215e-0.025X so that the field at 25m (RoW for 330KV), is about 3.81V/m, about 0.08% of the ICNIRP value.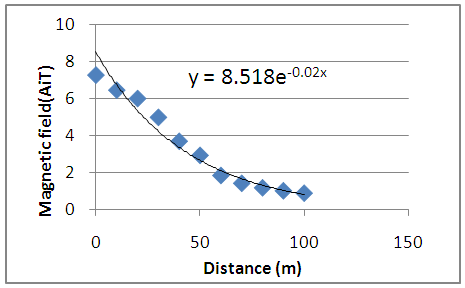 | Figure 4(b). Graph of Magnetic field from 330KV at Mando Community as a function of horizontal Distance |
YM = 8.5188e-0.025X, thus at 25m, the magnetic field is about 4.56µT, about 2.28% of the recommended value.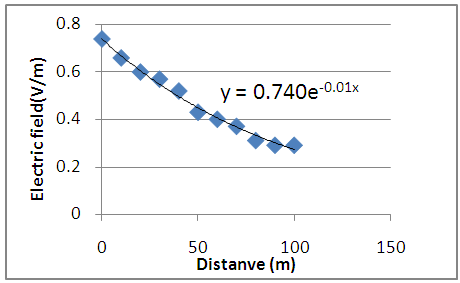 | Figure 5(a). Graph of Electric field from 11KV Power line at Badiko as a function of horizontal Distance |
 | Figure 5(b). Graph of Magnetic field from 11KV Power line at Badiko as a function of horizontal Distance |
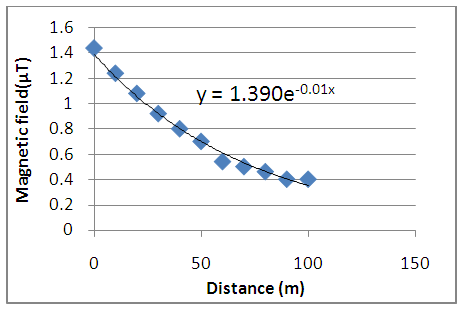
The magnetic field as seen in figure 5(b) falls sharply with distance, also YM = 1.390e-0.014X so that the field at 10m is about 1.21µT which is about 0.6% of the ICNIRP value.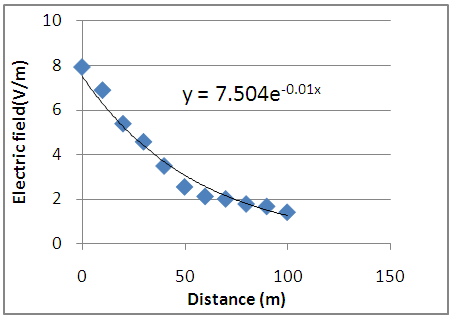 | Figure 6(a). Graph of Electric Field from 330KV at Mando Sub–Station as a function of horizontal Distance |
YE = 7.5049e-0.018X so that at 25m (RoW for sub-station power lines), the electric field is about 4.79V/m which compare to ICNIRP 2010 value of 10Kv/m for occupational exposure, is about 0.05% of the ICNIRP value.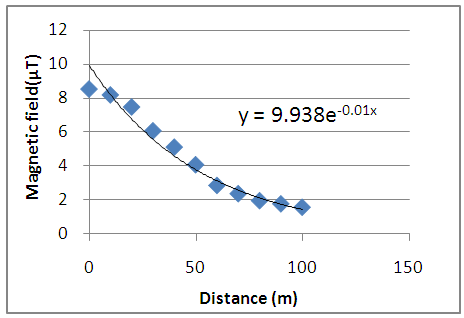 | Figure 6(b). Graph of Magnetic Field from 330KV Power line at Mando Sub–Station as a function of horizontal Distance |
YM = 9.9385e-0.019X so that the magnetic field at 25m is about 6.18µT about 0.62% of the recommended value.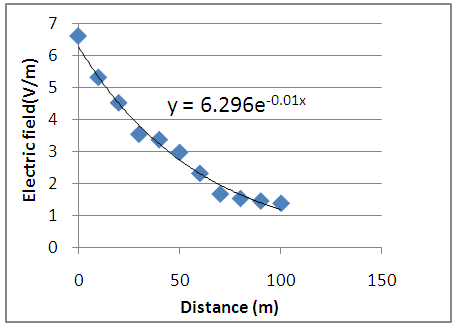 | Figure 7(a). Graph of Electric Field from 132KV Power line at Mando Sub–Station as a function of Distance |
YE = 6.2965e- 0.017X so that electric field at 25m is about 4.12V/m which is about 0.04% of the ICNIRP value.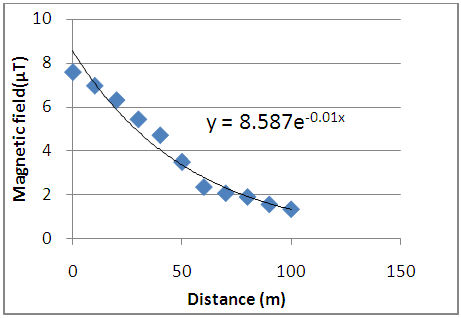 | Figure 7(b). Graph of Magnetic Field from 132KV Power line at Mando Sub–Station as a function of horizontal Distance |
YM = 8.5871e-0.019X so that at 25m, the magnetic field is about 5.34µT which compare with ICNIRP 2010 value of 1mT for occupational exposure, is about 0.53% of the ICNIRP value.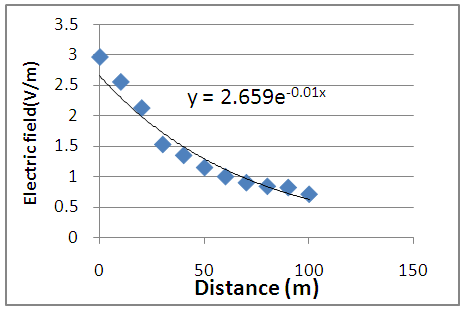 | Figure 8(a). Graph of Electric Field from 33KV Power line at Mando Sub –Station as a function of horizontal Distance |
In figure 8(a), YE=2.6596e-0.014X so that at 25m the field is about 1.87V/m.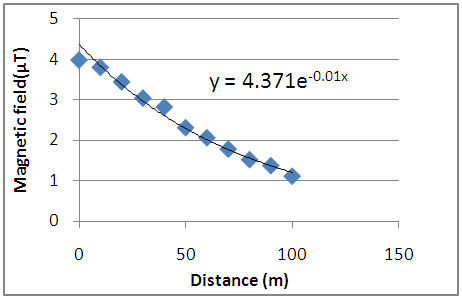 | Figure 8(b). Graph of Magnetic Field from 33KV Power line at Mando Sub- Station as a function of Distance |
Figure 8(b) shows YM = 4.371e- 0.013X so that the field at 25m is about 3.16µT. As can be seen from figures 1-8, both electric and magnetic fields can be represented by exponential expressions. On the basis of these expressions, the value of electric and magnetic fields at any point from the base of the power line can be determined.
4.2. Analysis of Measured Data by Bar Chart
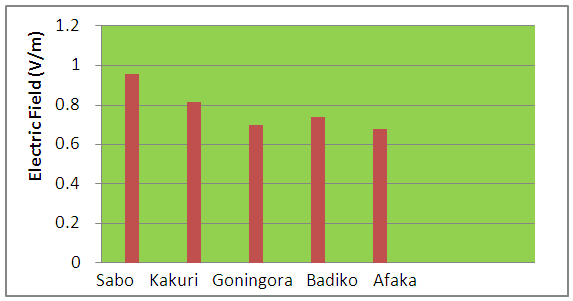 | Figure 9 (a). Variation of Electric Field from different locations for 11KV Power line |
The result from figure 9(a) shows the highest value of electric field for 11KV power line is for Sabo with 0.98V/m followed by Kakuri with 0.82V/m and the lowest is Afaka with 0.68V/m.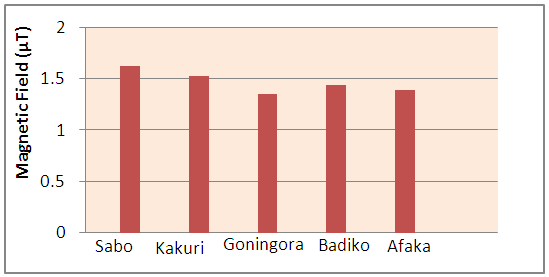 | Figure 9(b). Variation of Magnetic Field from different locations for 11KV Power line |
The highest value of magnetic field for 11KV power line, from figure 9(b) is for Sabo with 1.63µT and the lowest is Goningora with 1.36µT. This differs slightly with that of the electric field for which Afaka has the lowest value. This can be explained from the fact that some factors such as, buildings, trees and iron roofs absorb electric field so that the field is less in densely populated areas than scarcely populated areas. These factors have no effect on magnetic field.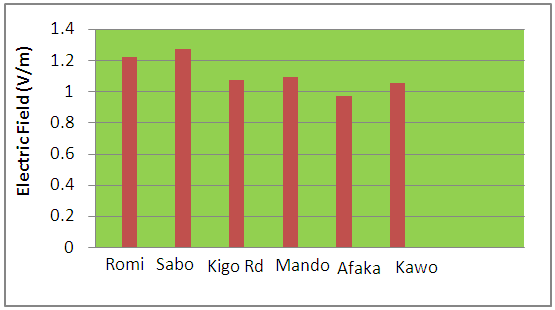 | Figure 10(a). Variation of Electric Field from different locations for 33KV Power line |
Examining figure 10 (a), the highest value of electric field for 33KV power line is from Sabo with 1.27V/m and the lowest is Afaka with0.97V/m.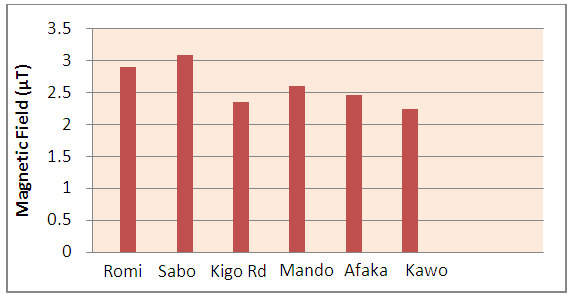 | Figure 10(b). Variation of Magnetic Field from different locations for 33KV Power line |
The highest value of magnetic field for 33KV power line as shown in figure 10 (b) is from Sabo with 50.83 µT, followed by Romi with 41.87µT and lowest is Kawo with 27.79µT.The variation of electric and magnetic fields from power lines of the same capacity from different locations arise from the variation in capacities of the transformers from where the electrical power is fed to the power lines at various locations. Also loss of electrical power in the form of heat along the power lines due to distance of location contribute to the variation of the fields.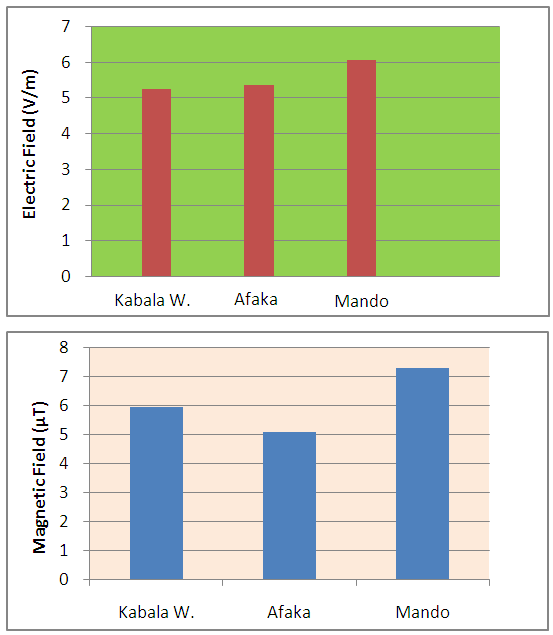 | Figure 11. Variation of Electric and magnetic Fields from different locations for 132 and 330KV Power line |
5. Conclusions
Comparison of the measured data with ICNIRP data showed that the highest measured value of magnetic field is less than ICNIRP data by about 96.4%, which means that the 330KV line poses no magnetic field hazard. The highest measured electric field is about 98.45% less than the ICNIRP data from 330KV power line, indicating no electric field hazard from the power line. The results of the measured data also shows that the electric and magnetic fields values at the right of way (RoW) distances of 10m for 11KV and 33KV, 15m for 132KV and 25m for 330KV power lines as stipulated by the NEPA (PHCN) in Nigeria are well below the recommended values for the general public. For occupational exposure, the highest measured electric and magnetic field values are about 0.08% and 0.9% of ICNIRP guideline respectively. Thus electric and magnetic fields in Kaduna pose no hazard to the public and workers at PHCN RoW distances.
References
| [1] | Beauty, H. Power System Analysis and Design Engineering (15th Edition) McGraw-Hill, N Y 2007. |
| [2] | Draper G, Vincent T, Kroll M.E and Swanson J. (2005): “Childhood Cancer in relation to distance from high Voltage Power lines in England and Wale”. British Medical Journal, 3 June. |
| [3] | Draper G, Vincent T, Kroll M.E and Swanson J. (2010): “The magnetic field Result paper”. British Journal of cancer. |
| [4] | Draper G, Vincent T, Kroll M.E and Swanson J. (2014): “Follow – on – Study 2014”. |
| [5] | Human Radiation Effects Group (HREG) 2014. H.H. Wills Physics Laboratory, Tyndall Avenue United Kingdom. |
| [6] | Ibrahim M. (2011): Analysis of Magnetic field pollution due to 132 and 330 KV. |
| [7] | International Commission on non-ionizing Radiation Protection, ICNIRP Guidelines 2010. |
| [8] | Mohr, Peter (2008): CODATA Recommended Values of Fundamental Physical Constants, 2008. |
| [9] | Wertheimer and Leeper, “Risk of Childhood Leukemia in Association with Proximity to Power line”, 1979. |

 Abstract
 Reference
 Full-Text PDF
 Full-text HTML