-
Paper Information
- Paper Submission
-
Journal Information
- About This Journal
- Editorial Board
- Current Issue
- Archive
- Author Guidelines
- Contact Us
American Journal of Condensed Matter Physics
p-ISSN: 2163-1115 e-ISSN: 2163-1123
2017; 7(3): 57-66
doi:10.5923/j.ajcmp.20170703.01

Thermodynamic and Surface Properties of Cr-X, (X = Mo, Fe) Liquid Alloys
 Abstract
 Reference
 Full-Text PDF
 Full-text HTML
Y. A. Odusote, A. I. Popoola
Department of Physics, The Federal University of Technology, Akure, Nigeria
Correspondence to: Y. A. Odusote, Department of Physics, The Federal University of Technology, Akure, Nigeria.
| Email: |  |
Copyright © 2017 Scientific & Academic Publishing. All Rights Reserved.
This work is licensed under the Creative Commons Attribution International License (CC BY).
http://creativecommons.org/licenses/by/4.0/

Thermodynamic and surface properties of Cr-Mo and Cr-Fe liquid alloys were studied using a simple scheme based on the formation of self-associates in conjunction with a statistical model founded on the concept of the layered structure near the interface. The phase-segregation tendencies in these liquid alloys were analyzed through the study of surface properties (surface tension and surface composition), transport properties (diffusion and viscosity) and microscopic functions (concentration fluctuations in the long-wavelength limit, Scc(0) and chemical short-range order parameter, α1). The positive deviation of the properties of mixing of the two liquid alloys from ideality has been discussed. Results show that the degree of phase-separation in Cr-Fe, as gauged by the Scc(0) and α1, is less than in Cr-Mo. The theoretical analysis reveals that the rate at which Cr-atoms segregate at the surface is higher in Cr-Fe, than in Cr-Mo alloys for all bulk concentrations.
Keywords: Modelling, Segregation, Cr-Mo, Cr-Fe, Thermophysical properties
Cite this paper: Y. A. Odusote, A. I. Popoola, Thermodynamic and Surface Properties of Cr-X, (X = Mo, Fe) Liquid Alloys, American Journal of Condensed Matter Physics, Vol. 7 No. 3, 2017, pp. 57-66. doi: 10.5923/j.ajcmp.20170703.01.
Article Outline
1. Introduction
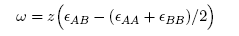
- Metal alloys in general offer some benefits over convention metals due to their increased mechanical strength, heat and chemical resistance, and reduced production costs. From technological viewpoints, binary and ternary alloy systems containing chromium such as Cr-Mo, Cr-Fe, Cr-Al, Cr-Mo-Al, Cr-Nb-Re and Cr-Fe-Mo-C etc., represent a class of alloy systems with excellent high-temperature strength, high ductility, good corrosion and oxidation resistance. These properties make them sought after in a wide range of applications from steel production and Ni-based super alloys to surgical implants [1, 2], including aerospace and automobile industries [3], structural materials for nuclear power plants [1, 4], complex bulk metallic glasses [5], heat-resistant and corrosion-resistant protective coatings [2, 6]. In order to enhance the tribological, structural and mechanical properties of chromium-based alloys to suit diverse service conditions, alloying with other elements such as molybdenum (Mo) has shown to be effective in improving the toughness and tribological properties of Cr-N coatings [7-11]. On the other hand, the ability of Mo to form Magnli phase oxides can be used to prepare materials with solid lubricant potential, which considerably reduce the coefficient of friction [12, 13]. The present work is motivated by the controversial and divergent results in literature concerning chromium-based alloys. For instance, thermodynamic measurement performed on solid Cr-Mo alloys in the temperature range of 1471 - 1773 K [14-17] showed that the data of Dickson et al. [17] are at variance with those of others. While negative deviations from ideality was reported for components activity coefficients of Cr-Mo alloys at 1673 K using the Knudsen effusion technique by Dickson et al. [17]. The measured activity of Cr in solid Cr-Mo alloys at 1873 K by Jacob and Kumar [14], the results of Laffitte and Kubaschewskil [15], and that of Kubaschewski and Chart [16] on the other hand, indicated positive deviations from ideality. Similarly, Cr-Fe has been studied widely both experimentally and theoretically by many authors [1, 18-27]. However, a recent review by Xiong et al. [26, 27] indicated that the commonly accepted result due to Andersson and Sundman [23] requires further thermodynamic reassessment in many aspects, among which is precise locations of the corresponding phase boundaries of the solidus and liquidus lines on its phase diagram [1]. At low temperatures, Cr-Mo and Cr-Fe alloys are endowed with miscibility gap of the body centered cubic (bcc) in the solid phase. Alloys within the miscibility gap tend to separate or decompose into a Cr-rich bcc phase (α’), Mo-rich bcc phase (α) and/or an Fe-rich bcc phase (α) [27, 28]. This phenomenon of phase separation in Cr-based alloys, known generally as the “475° embrittlement” has resulted in increased hardness and reduced ductility in these alloys with aging [20, 28, 29]. Also, Quintela et al. [30] recently observed that even a very small addition of only ≈ 1% of Mo or W to Cr-based coating alloys, lead to a spontaneous phase segregation. Consequently, attempts are being made by researchers to combine all available experimental information to achieve a consistent description of the phase equilibria and thermodynamics of the phases involved in Cr-Mo and Cr-Fe alloy systems [27, 31, 32]. The amount of research on Cr-based (both binary and higher order alloys in recent times, has being on steady increase due to its various industrial applications and the use of atomistic approaches in investigating their structural behaviour [1, 27, 28]. However, measurement of thermodynamic and thermophysical quantities of alloy systems containing elements such as Cr, which is a strongly electropositive metal like Mg, and often acts as a strong reducing agent are difficult. In particular, concerning the data of transport and surface properties of ternary Cr-based and its binary alloys, only the surface tension data of their pure components have been well documented [33]. Since, a systematic measure of both thermodynamic and thermophysical data over the whole range of composition and temperature can be almost impossible to perform. It is therefore expected that most of the missing thermodynamic value on binary and multi-component systems will come within theoretical framework, rather than from direct experiment. For the design and development of reliable materials for high-temperature applications, the knowledge of thermodynamic and thermophysical quantities of these alloys is important in gaining qualitative insight into their mixing behaviour as well as aid in elucidating the energetics and structure at atomistic level in the melts and how they are coupled. The nature of the atomic interactions and structural re-adjustment of the constituent atoms in liquid Cr-Mo and Cr-Fe alloys can be gauged from the values of Hume-Rothery empirical factors such as electronegativity difference (ECr-EMo = -0.20, and ECr-EFe = -0.20) [34], the size ratio, VMo/VCr ≈ 1.30 and VFe/VCr ≈ 0.98 [35], and valency difference (=0 or =2) [35], respectively. Obviously, these factors can only provide partial information and are not sufficient to completely characterize the mixing behaviour in these alloys. In the present study, a simple scheme developed by Singh and Sommer [36] for studying liquid alloy systems with miscibility gap tendencies has been utilized to model liquid Cr-Mo and Cr-Fe alloys at 1471 K and 1600 K, respectively. We intend to explain the energetic effects on these systems in terms of the interaction energy parameter W, that reproduces as closely as possible their various concentration dependent properties with a view to understand alloying nature of ordering or segregation tendencies in the molten alloys. Afterwards, the transport properties (diffusion and viscosity), microscopic functions (concentration-concentration fluctuations in the long-wavelength limits, Scc(0) and chemical short-range order parameter, α1) and surface properties (surface concentration and surface tension) were studied from a theoretical viewpoint with the aim of correlating the properties of the liquid alloys in the bulk and at the surface. Both Cr-Mo and Cr-Fe liquid alloys exhibited positive deviations from ideal mixture behaviour with positive energy parameters, W at the respective temperatures. The positive signs of energy parameters for Cr-Mo and Cr-Fe alloys imply repulsive interactions between constituents of the alloys, and further indicate that there is a general tendency for homo-coordination of atoms in both liquid alloy systems [36].The theoretical formulations of the model based on the formation of self-associates in binary liquid alloys as related to the various thermodynamic quantities, microscopic functions, transport and surface properties are presented in the next section. This is followed by results and discussion in section 3, and conclusion in the last section.
2. Theoretical Formulation
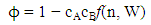
- Let a liquid binary alloy consists of NA = NcA atoms of element A and NB = NcB atoms of element B located at equivalent lattice sites, where the total number of atoms N = NA + NB and form of a polyatomic matrix, leading to the formation of like-atom cluster or self-associates of the type Aµ and Bν, i.e
 | (1) |
2.1. Thermodynamic and Microscopic Functions for the Bulk
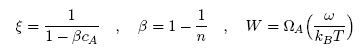
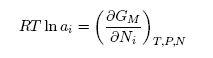
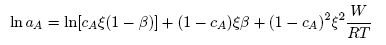
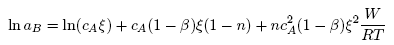
- Based on the assumption of self-associates, the standard expression for the Gibbs free energy of mixing, GM for demixing liquid binary alloys which is dependent on the number of self-associates, n = µ/ν can be expressed as [36]:
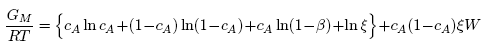 | (2) |
 | (3) |
 | (4) |
 | (5) |
 | (6) |
 | (7) |
 | (8) |
 | (9) |
 | (10) |
 | (11) |
 | (12) |
 | (13) |
 | (14) |
 | (15) |
2.2. Transport Properties: Diffusion and Viscosity
2.2.1. Diffusion
- The formalism that relates diffusion and Scc(0) combines Darken’s thermodynamic equation for diffusion with basic thermodynamic equation in the form [36, 39]:
 | (16) |
2.2.2. Viscosity
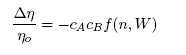
- Taking into account the Strokes-Einstein type relation for liquid alloys, the viscosity, η is related to the Scc(0) and DM (Eq.(16), by [42-43]:
 | (17) |
 | (18) |
 | (19) |
 | (20) |
 | (21) |
2.3. Surface Properties: Surface Concentration and Surface Tension
- The grand partition functions set up for the surface layer and that of the bulk provides a link between the bulk and the surface properties within the frame of the statistical mechanical approach through the concept of layered structure near the interface [46, 47]. This linkage connects the surface,
 and bulk,
  concentrations in terms of surface tension, σ via a pair of net equation:
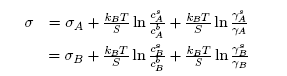 | (22) |
 | (23) |
 and
and  refer to the concentration and activity coefficient of the ith component at the surface, respectively.
  and
and  are related by:
 | (24) |
3. Results and Discussion
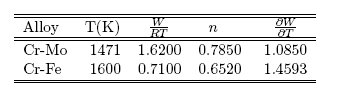
- The thermodynamic data used for the modelling of the bulk thermodynamic properties of liquid Cr-Mo and Cr-Fe alloys at 1471 K and 1600 K, respectively, were taken from [14, 22]. The basic inputs for the computation of the bulk properties are the interaction energy parameter, W, its temperature dependence ∂W/∂T, and the number of self-associates, n, all listed in Table 1 for each of the two liquid alloys investigated. The values of these parameters (W, ∂W/∂T and n) were adjusted by the method of successive approximation to give the concentration dependence of activity, ai, GM/RT, HM /RT, SM/R and Scc(0) that reproduces fairly well the corresponding thermodynamic data as shown in Figs. 1 to 6. The interaction energy parameters for liquid Cr-Mo and Cr-Fe alloys, expressed in RT units, are W = 1.6200 and 0.7100, in that order, and remain invariant in all calculations.
|
3.1. Thermodynamic Properties: ai, GM, HM and SM
- Figs. 1 and 2 show the plot of the calculated component activities of each liquid alloys studied compared with the respective experimental data. In Fig. 1, activity of Cr was compared at two different temperatures 1471 K [14] and 1873 K [22] for which experimental values exists in the literature. It can be noticed that there are fairly reasonable agreement between the calculated and experimental data especially below 0.7 atomic faction of Mo in Cr-Mo at 1471 K, while aCr in Cr-Mo has better agreement below 0.5atomic faction at 1471 K and also at cCr > 0.5 for aCr at 1873 K in Cr-Mo liquid alloys (Fig. 1). Above these concentrations, the calculated values show some form of disagreement with experimental data. Since activity is one of the thermodynamic functions that can be measured directly from experiment, the inconsistencies observed could suggest further assessment of thermodynamic activity data of Cr-Mo liquid alloys. On the other hand, Fig. 2 shows excellent agreement with experimental data of component activities of Cr and Fe in Cr-Fe liquid alloys at 1600 K, with the activity values very close to ideal behaviour for aCr and aFe, respectively, [1, 14].
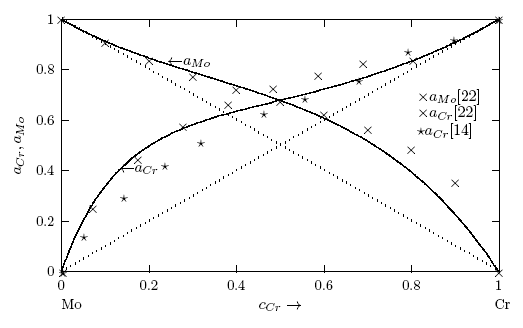 | Figure 1. Concentration dependence of component activities aCr and aMo in Cr-Mo liquid alloys computed using Eqs. (11) and (12) at 1471 K, respectively. ⋆ ⋆ . . .and x x. . . are measured activity data at 1873 K and 1471 K, respectively. The solid lines denote calculated values. cCr is the bulk concentration of Cr in the alloy |
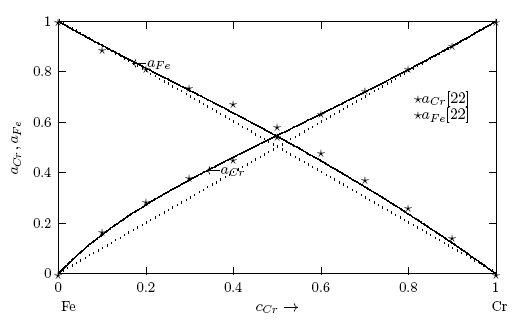 | Figure 2. Concentration dependence of component activities aCr and aFe in Cr-Fe liquid alloys computed using Eqs. (11) and (12) at 1600 K, respectively. Symbol ⋆⋆. . . measured activity data at 1471 K. The solid lines denot calculated values. cCr is the bulk concentration of Cr in the alloy |
 = -0.3419 RT) is higher than in Cr-Fe with (
 = -0.5773 RT). The excellent agreement between the two sets of data also suggests that the choice of n and W used for the model calculations is quite reasonable.
 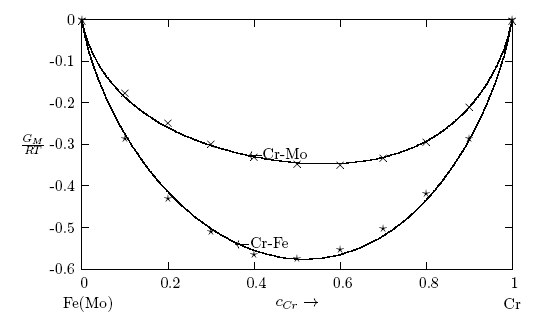 | Figure 3. Concentration dependence of free energy of mixing, GM/RT of Cr-Fe and Cr-Fe liquid alloys at 1471 K and 1600 K, respectively. The solid line denotes theoretical values, while times and stars denote experimental data [22] for Cr-Mo and Cr-Fe at respective temperatures. cCr is the bulk concentration of Cr in the alloy |
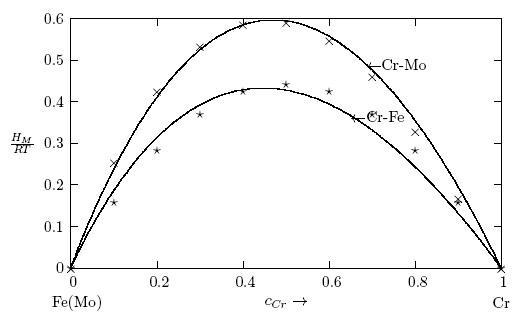 | Figure 4. Concentration dependence of enthalpy of mixing, HM/RT of Cr-Fe and Cr-Fe liquid alloys at 1471 K and 1600 K, respectively. The solid line denotes theoretical values, while times and stars denote experimental data [22] for Cr-Mo and Cr-Fe at respective temperatures. cCr is the bulk concentration of Cr in the alloy |
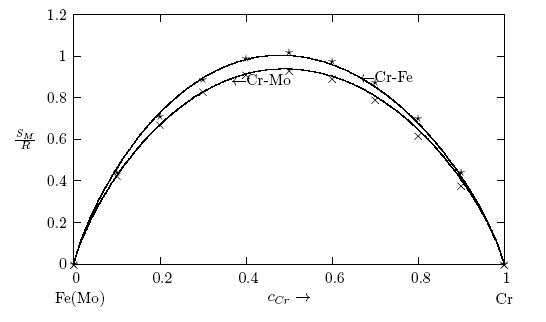 | Figure 5. Concentration dependence of entropy of mixing, SM/R of Cr-Fe and Cr-Fe liquid alloys at 1471 K and 1600 K, respectively. The solid line denotes theoretical values, while times and stars denote experimental data [22] for Cr-Mo and Cr-Fe at respective temperatures. cCr is the bulk concentration of Cr in the alloy |
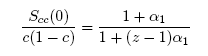
3.2. Microscopic Functions: Scc(0) and α1
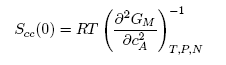
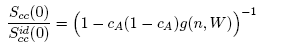
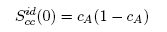
- The concentration-concentration fluctuations in long-wavelength limits, Scc(0) has emerged as a very useful thermodynamic function to investigate the atomic order in a binary liquid alloy. The deviation of Scc(0) from the ideal values
 (Eq. 8) can be used as a measure of the nature of atomic order and the stability of the mixture at a given composition. If at a given composition,
  , there is a tendency of segregation. On the contrary,
  refers to hetero-coordination. The theoretical values of Scc(0) are computed via Eq.(6) using the same interaction parameters used to compute GM. The measured Scc(0) were determined from the experimental Gibbs free energy of mixing data taken from [14] when Eq.(5) is solved numerically. The results are shown in Fig. 6. From the figure, it is evident that the computed
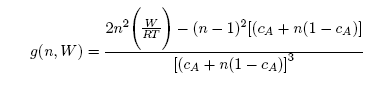
  across the entire concentration range of Cr for both Cr-Mo and Cr-Fe liquid alloys at 1471 K and 1600 K, respectively. This suggests that both Cr-Mo and Cr-Fe are segregating liquid alloys. The degree of deviation observed around the equiatomic composition in Cr-Mo is about 62% higher than that of Cr-Fe. That is to say that homo-coordination of atoms (preference for like atoms to be paired as nearest-neighbours) exists in these molten alloy systems, which is consistent with positive values of the interaction energy parameter, W. Also from Table 1, it can be observed that when n and W are less than 1 for Cr-Fe alloys, the Scc(0) exhibits symmetrical behaviour at equiatomic composition with cCr = 1/2, whereas, Cr-Mo liquid alloys with n < 1 and W > 1, exhibits asymmetry and positive deviation in Scc(0) as expected as a function of both n and W. However, the positive deviation observed in Scc(0) behaviour for Cr-Fe liquid alloys at 1600 K in this work contrast sharply with the results of Novakovic and Brillo [1] who used the quasi-chemical approximation for regular alloys and reported that Cr-Fe alloys exhibited negative deviation with
  at 1873 K.
 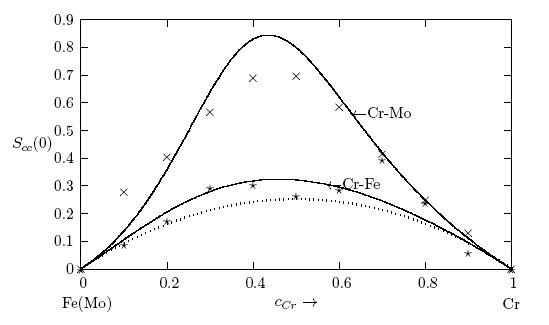 | Figure 6. Concentration-concentration fluctuations at long wavelength limits, Scc(0) as a function of concentration for Cr-Mo and Cr-Fe liquid alloys at 1471 K and 1600 K, respectively. The solid line denotes theoretical values, while times and stars denote experimental data [22] for Cr-Mo and Cr-Fe at respective temperatures. The dots denote the ideal values of Scc(0). cCr is the bulk concentration of Cr in the alloy |
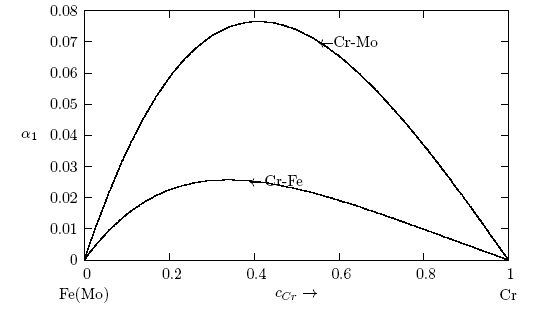 | Figure 7. Warren-Coyley Short-range order parameter, (α1), computed using Eq. (9) versus concentration for Cr-Mo and Cr-Fe liqud alloys at 1471 K and 1600 K, respectively. cCr is the bulk concentration of Cr in the alloys |
3.3. Diffusion and Viscosity
- The calculated values of Scc(0) are used in Eq.(16) to assess the ratio of the mutual and self-diffusion coefficients, DM/Did. The values of DM/Did are found to be less than 1 across the concentration range as presented in Fig. 8. This also indicates that the segregating feature of Cr-Mo and Cr-Fe liquid alloy as observed in Scc(0) and α1. Since DM/Did sharply reduced to very small values in the region around cCr ≈ 0.41 and 0.34 with distinct asymmetric features, where Cr-Mo and Cr-Fe liquid alloys have their minima values, respectively. The phase separating tendency in Cr-Mo and Cr-Fe liquid alloys at 1471 K and 1600 K is maximum at the intermediate composition.
 | Figure 8. Diffusion coefficients, DM/Did, computed using Eq.(16) versus concentration for Cr-Mo and Cr-Fe liquid alloys at 1471 K and 1600 K, respectively. cCr is the bulk concentration in the alloys |
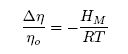
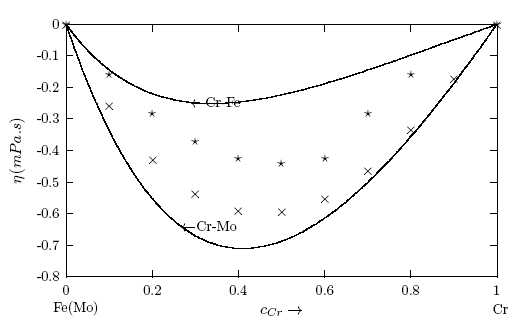 | Figure 9. Concentration dependence of viscosity, η for Cr-Mo and Cr-Fe liquid alloys calculated using Eq. (20) at 1471 K and 1600 K, respectively. The solid line denotes theoretical values, while times and stars denote –HM/RT used as experimental data [22] via Eq. (21) for Cr-Mo and Cr-Fe liquid alloys at respective temperatures |
3.4. Surface Properties
- Using the parameters given in Tables 1 and 2 as input and the required activities as obtained from the relevant expressions in the model, the surface concentration of Cr has been computed by solving Eq. (22) simultaneously. These surface concentrations were used to evaluate the surface tension as a function of bulk concentration, ci (i = Cr) for Cr-Mo and Cr-Fe liquid alloy at the working temperatures.
|
 | (25) |
 | (26) |
 remain constant at about 0.11% up till about 40% bulk concentration when it begins to rise sightly with increasing bulk concentration. At 96.5% and 98.9% bulk concentrations, the surface concentrations are 17.56% and 53.42%, respectively. This is an indication that in the alloy there are more atoms of component with bigger atomic size (i.e. Mo-atoms with atomic size of 9.38 [59], compared to Cr with 7.23 [59]) at the surface. Hence, at the surface of Cr-Mo, more Mo-atoms segregate at the surface in preference to Cr-atoms up to around 98.9% bulk concentration.On the other hand, the calculated values of surface concentration,
  , in Cr-Fe liquid alloys (Fig. 10) suggest the segregation of Cr-atoms to the surface as the bulk concentration increases. The rate at which Cr- atoms segregates to the surface is nearly proportional to the rate at which it segregates to the bulk surface with the surface isotherm curve for Cr- Fe liquid alloys almost close to ideal mixture behaviour. This implies that Cr-atoms with lower value of surface tension with respect to Fe-atoms tend to segregate to the surface, while the Fe-atoms with higher surface tension value prefer to remain in the bulk in the molten alloy. A closer look at the surface isotherm curve also reveals that Cr-Fe liquid alloy exhibits a slight positive to negative deviations with respect to the ideality
  . It may be point out here that when there is a significant difference in surface tension values between the solvent and solute, the mixing shows strong segregation of the component with lower surface tension at the surface and the other in the bulk [6, 60].
 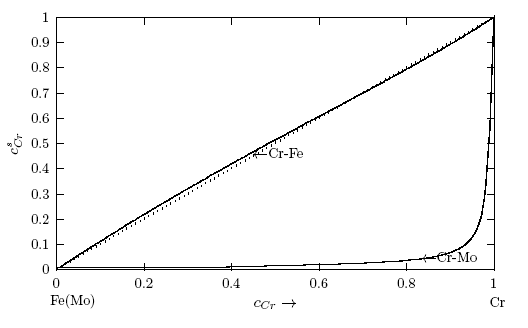 | Figure 10. Computed values of the surface concentrations of Cr in Cr-Mo and Cr-Fe liquid alloys at 1471 K and 1600 K, respectively. The curves were computed via Eq. (22). The dots denote the ideal values of the surface concentration,  computed from: computed from:  . cCr is the bulk concentration of Cr in the alloys . cCr is the bulk concentration of Cr in the alloys |
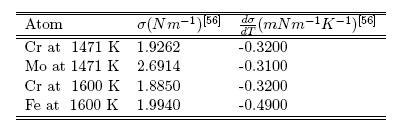
 values, W, surface coordination fractions (p and q), mean atomic surface area (S) and surface tension data of pure components (σA and σB) into Eq. (22). Surface tension data of pure Cr, Mo and Fe metals were taken from [56]. The surface tension isotherms of Cr-Mo and Cr-Fe liquid alloys exhibit negative deviations from corresponding ideal mixture isotherms as shown in Figs. 11 and 12, respectively.
 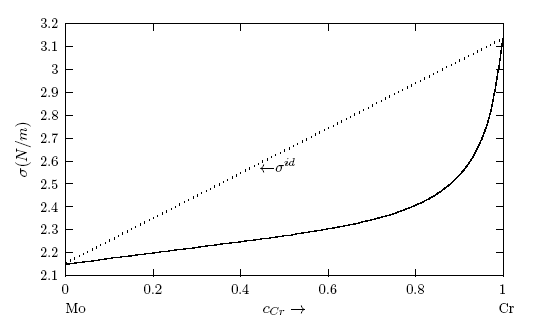 | Figure 11. Computed values of the surface tension, σ for Cr-Mo liquid alloys at 1471 K, computed via Eq. (22). The dots labelled  denote the ideal values of the surface tension obtained from the relation: denote the ideal values of the surface tension obtained from the relation: 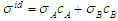 . cCr is the bulk concentration of Cr in the alloy . cCr is the bulk concentration of Cr in the alloy |
 | Figure 12. Computed values of the surface tension, σ for Cr-Fe liquid alloys at 1600 K, computed via Eq.(22). The dots labelled  denote the ideal values of the surface tension obtained from the relation: denote the ideal values of the surface tension obtained from the relation:  . cCr is the bulk concentration of Cr in the alloy . cCr is the bulk concentration of Cr in the alloy |
4. Concluding Remarks
- The theoretical study shows positive deviation in the mixing properties from the ideal mixture behaviour indicating segregation in Cr-Mo and Cr-Fe liquid alloys. The degree of segregation is more in Cr-Mo alloy at 1471 K than in Cr-Fe system at 1600 K as evident in their investigated bulk properties. It was pointed out that when there is a significant difference in surface tension values between the solvent and solute, the mixing shows strong segregation of the component with lower surface tension at the surface and the other in the bulk. The surface tension study also reveals that addition of Cr-atoms leads to increase in surface tension of Cr-Mo and Cr-Fe liquid alloys across bulk concentration expect for bulk concentration < 70% in Cr-Fe, where σ decreases with increasing bulk concentrations. The decrease in σ of Cr- Fe alloys for bulk concentration in the range of 0 ≤ cCr ≤< 0.7 indicates that more atoms of components with bigger atomic size (i.e. Cr-atoms) segregates at the surface in preference to Fe-atoms. In addition, the rates at which Cr-atoms segregate at the surface of Cr-Fe liquid alloys is more than the rate at which Cr-atoms segregate at the surface in Cr-Mo liquid alloys for all bulk concentrations. This segregation of the components may result from the differences in atomic size, surface tension and electron configuration between the components of an alloy. The possible roles of the entropic and enthalpic effects on the phase-segregation observed in the two liquid alloys have been explained in terms of the bulk and surface properties.