-
Paper Information
- Paper Submission
-
Journal Information
- About This Journal
- Editorial Board
- Current Issue
- Archive
- Author Guidelines
- Contact Us
American Journal of Condensed Matter Physics
p-ISSN: 2163-1115 e-ISSN: 2163-1123
2017; 7(2): 33-40
doi:10.5923/j.ajcmp.20170702.01

Temperature Dependence of the Structural Properties of Liquid Cu, Au and Fe Metals via RMC Method
 Abstract
 Reference
 Full-Text PDF
 Full-text HTML
Yisau A. Odusote1, Lateef O. Mustapha2
1Condensed Matter Physics Research Group, Department of Physics, Federal University of Technology, Akure, Nigeria
2Department of Physical Sciences, Al-Hikmah University, Ilorin, Nigeria
Correspondence to: Yisau A. Odusote, Condensed Matter Physics Research Group, Department of Physics, Federal University of Technology, Akure, Nigeria.
| Email: |  |
Copyright © 2017 Scientific & Academic Publishing. All Rights Reserved.
This work is licensed under the Creative Commons Attribution International License (CC BY).
http://creativecommons.org/licenses/by/4.0/

The structures of liquid metals of Cu, Au and Fe have been studied at temperatures close to their melting points and a few higher temperatures by reverse Monte Carlo (RMC) method using X-ray diffraction data. In each case, the positions of 4096 atoms placed in a configuration box were altered until the experimental diffraction data of the static structure factor S(Q) was in agreement with the corresponding model static structure factor within the errors. From the simulations, useful information on the temperature dependence of the pair distribution function g(r), the structure factor, S(Q), the cosine of the bond angle distribution, bcos θ and the average coordination number, Nc, were extracted. Analysis of the results reveals that the structure of the liquids remains nearly close-packed as the density decreases. The calculated results agree quite well with the experimental S(Q) data. It is reported that there is a gradual structural change from a more close-packed to a less close-packed structure in investigated liquid metals. Hence, the study indicates that as temperature increases many atoms have a small number of neighbours (i.e. atoms move further apart), showing that they are on the surface of clusters or on ‘pathways’ between them thereby causing a decrease in the average coordination number, Ncof the central atom.
Keywords: Temperature, Structure factor, Coordination number, X-ray diffraction, Liquid metals
Cite this paper: Yisau A. Odusote, Lateef O. Mustapha, Temperature Dependence of the Structural Properties of Liquid Cu, Au and Fe Metals via RMC Method, American Journal of Condensed Matter Physics, Vol. 7 No. 2, 2017, pp. 33-40. doi: 10.5923/j.ajcmp.20170702.01.
1. Introduction
- The use of X-ray diffraction methods to describe the atomic structure of liquid metals and alloys in material science and, by extension, interpreting the experimental results are still complicated problems [1]. The knowledge of the detailed atomic structure of modern materials is the key to understanding their macroscopic properties and various kinds of techniques such as X-ray, neutron and electron diffractions have been proposed and used to obtain the structure of non-crystalline materials using both reflection and transmission experiments. It is widely acknowledged that the most efficient direct method of structural investigations is neutron diffraction with isotopic substitution. Unfortunately, this tool has proved to be prohibitively expensive and coupled with difficulty associated with the structural analysis of the diffraction data for liquid metals and binary liquid mixtures by way of separating the partial structure factors from the experimental total structure factor. To overcome these challenges one has to rely on the results of different experimental techniques as extended X-ray absorption fine structure (EXAFS), X-ray and neutron diffractions. A number of recent studies [2-5] have confirmed that the reverse Monte Carlo technique provides a suitable framework for combining the information content of many different sorts of data.Many studies of the potential based methods [6-9] reveal that a better understanding of the structure of liquid metals and alloys is essential for exact theoretical analysis of physicochemical properties like electron transport properties, atomic transport properties, to mention a few. This has prompted us to employ the reverse Monte Carlo method(RMC) of simulation which has proved very useful in a number of cases [10-14] to model the structure of liquid copper, gold and iron at different temperatures close to their melting points and from a practical point of view find out how the properties of these liquid metals are affected with changes in density for some worthwhile reasons: firstly, liquid metals are two component systems, which are composed of valence electrons and ions and there is a strong correlation between electrons and ions. Secondly, the structural and electronic properties of liquid metals is strongly a function of the density due to the screening effect of conduction electrons [15], and it is believed that fluctuations in density are important in determining the physical properties of metals in the critical region [16]. Most metals have their critical point at such extremes of temperature and pressure, where the temperature is too high to permit a liquid to be in stable state, and the pressure too high to sustain a gas and under such conditions it is very difficult to make accurate measurement of any steady-state properties. These are reasons why liquid metals are known to exhibit a number of distinguishing features in a wide range of density. It is also important to note that apart from the commercial values of these classes of materials, the unique chemical and physical properties offered by them are increasingly being studied in a growing number of applications. For instance, gold is used in the fields of nanotechnology and medicine for productions of smart cards, automotive, electronics, sensors, medical implants and drug delivery systems [17]. In addition, liquid metals are of practical importance from technological point of view, as liquid silver is being used as a doping agent in glassy semiconductor As2Se3 to make it an ionic conductor [18].The RMC method [9] provides a general way of producing three dimensional structures of disordered materials on the atomic level based on experimental data. No input interatomic potential is required and the simulation can be performed to minimize the difference between calculated and measured total structure factors, instead of minimizing the system energy as is the case in Metropolis Monte Carlo (MMC) method [11, 19].Although, the RMC method was initially developed for application to the structures of liquids and glasses, it has however been successfully applied to crystalline and magnetic structures [11, 19-21]. In the present study, the experimental structure factors taken from [22] are used as input data and the RMC method was used to give more detailed information on the structural properties of the selected liquid metals than can be obtained from pure structural measurements. The interesting results obtained from the simulations were analyzed for the pair distribution function, g(r), the structure factor S(Q), the ‘bond-angle’ distribution bcos θ and the average coordination number, ⟨Nc⟩.The layout of the paper is as follows: in section 2, a brief description of the RMC method algorithm is given. This is followed by results and discussion in section 3 and finally end the paper with the concluding remarks.
2. RMC Method
- A brief description of the algorithm is given here, while details of the RMC method can be found in [10, 19, 23].1. Starts with an initial configuration of N atoms placed in a cubic box of side L with periodic boundary conditions, that is, the box is surrounded by images of itself. The atomic number density ρ is expressed as:
 | (1) |
 , for this old configuration is calculated by:
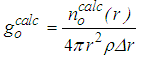 | (2) |
 is the number of atoms at a distance between r and r + Δr from a central atom, averaged over all atoms as centers. Subscript o means ‘old’ and its significance will become clear in the following steps.3. Fourier transform of
  to obtain the total structure factor:
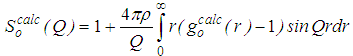 | (3) |
 | (4) |
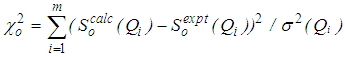
 and total structure factor,
  such that
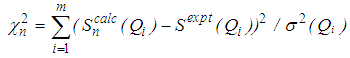 | (5) |
 , the move is accepted and the new configuration becomes the old configuration.If
  , then move is accepted with probability
 . Otherwise, it is rejected.6. Repeated from step 4 until χ2 becomes small enough.As the number of accepted atom moves increases, χ2 will initially decrease until it reaches an equilibrium value, about which it will then oscillate. The resulting configuration for which Scalc(Qi) agrees with Sexpt(Qi) within the limits of experimental error should be a three dimensional structure.
3. Results and Discussion
- The calculations in the present work were performed with a recent version of the RMC code [24]. The simulation box contained 4096 atoms at each temperature and density of the liquid metals studied as presented in table 1. In each case, the atoms are arranged at random in a cubic box, but moved a minimum distance apart, corresponding to the closest approach of two atomic centers. The positions of atoms in the configuration box obeying periodic boundary conditions are altered until they give good agreement with experimental data.
|
 and
and  as well as the positions of the first and second minima in g(r),
  and
and  used in the modelling, respectively, with the average coordination numbers ⟨Nc⟩ obtained. ⟨Nc⟩ is the average number of atoms within a distance
  (position of first minimum in g(r)) from a central atom and it was calculated using the conventional method [22], that is the first peak area of 4πr2g(r) up to the first minimum.
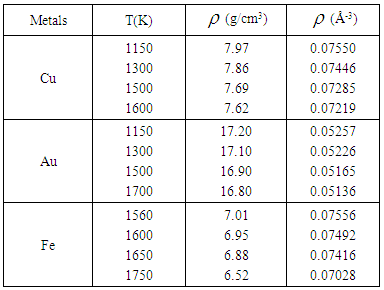
  | Figure 1. Temperature variation of g(r) with r(˚A) as obtained for liquid Cu from the RMC |
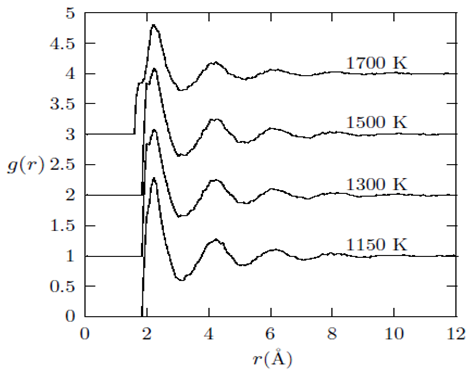 | Figure 2. Temperature variation of g(r) with r(˚A) as obtained for liquid Au from the RMC |
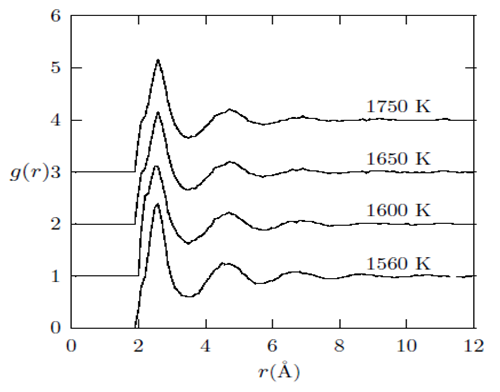 | Figure 3. Temperature variation of g(r) with r(˚A) as obtained for liquid Fe from the RMC |
 and
and  are 1.7 Å, 2.4 Å and 3.4 Å, respectively for liquid copper from Fig. 1 and these values are fairly constant despite considerable change in temperature. The lack of a significant change in the peak positions
  indicates that the nature of the metallic bonding remains the same as temperature increases.It is also noted that the heights of the first, second and third peaks of g(r) practically do not differ as the densities of the liquid is lowered. However, one observes that only the positions of the first, second and third peaks shift towards increasing r values from about 2.4 Å to 4.7 Å and to 6.6 Å for the first, second and third peaks, respectively (see table 2).
 and
and  , the positions of the first and second minima given as
  and
and  with the average coordination number, ⟨Nc⟩ as obtained from the RMC
 in g(r) also remains fairly constant. Nonetheless, the slight observable shoulders on the left-hand side of the first peaks of the g(r) at temperatures < 1600 K from the RMC simulations for the liquid metals would have been improved by increasing the cut-off by 0.05- 0.1 Å. The first peaks are very well separated from the remainder of g(r)′s and this, in principle, makes it possible to accurately calculate the average coordination number. A more careful perusal of table 2 reveals that the cut-off distances rc somehow decrease for liquid gold as temperature is increased and has fairly constant first peak
  and second peak
  heights (Fig. 2), while the positions of the first minimum
  and second minimum
  slightly vary with increasing temperature. Moreover, the cut-off distances, rc for liquid iron show a slight variation as temperature increases. The heights of first peak
  and second
  are almost constant (Fig. 3), whereas the positions of the first minimum
  and second minimum
  in g(r) were found to vary with increase in temperature. With regards to the structure of g(r), the general effect of an increase in temperature in decreasing the heights of the first peak in g(r) and reducing the depth of the first minimum is reproduced for all the liquid metals studied.A comparison of our results with the RMC modelling of expanded liquid Cs, [25] reveals that Cs has a fairly constant first peak and first minimum in g(r), with
  = 5.5 Å and
  = 7.5 Å (the
  at the highest temperature of 1650°C is 7.8 Å). This simply implies that the metallic bond has a mean bond length of 5.5 Å and a maximum length of 7.5 Å. Therefore, the investigated liquid metals Cu, Au and Fe can be said to have their metallic bond lengths approximately within the range of 2.4 to 3.4 Å, 2.5 to 3.9 Å and 2.2 to 3.5 Å, respectively. In addition, we also compare the g(r) obtained in the present study for liquid Cu at 1500 K with the result from the ab initio MD studies of Kresse et al., [26] and Pasquarello et al., [27] which further confirms that the heights of their first peaks agree well with our g(r). But their peak positions are shifted slightly to the left of ours (ours is at 2.4 Å).The curves in Figures 4, 5 and 6 show the quality of the RMC fits to the experimental S(Q)’s data for the liquid Cu, Au and Fe, at respective investigated temperatures. As it can be seen from the figures, the calculated S(Q) from RMC compares well with the experiment at all values of Q such that it is almost impossible to distinguish between the RMC fits and the experimental data. This agreement gives us confidence to use the configuration files to extract information on the atomic arrangements for the liquid metals. Investigation by previous studies of a number of pure liquid metals and alloys [28, 29] has shown that the S(Q)’s curves obtained in the present study are reliable and follow the general trend in that variation of the sample temperature is accompanied mainly by change in the amplitude of the peaks, while the position of the peaks practically does not change with respect to Q [1].
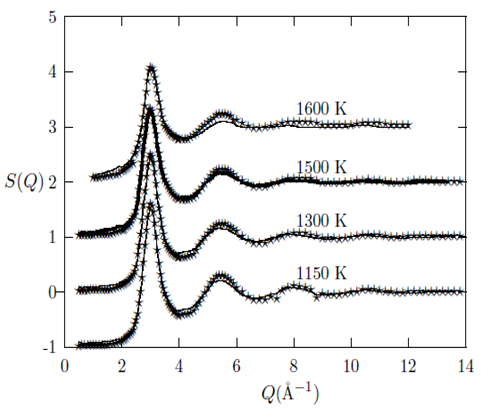 | Figure 4. Temperature variation of the static structure factor, S(Q), as obtained for liquid Cu from RMC. The solid line denotes theoretical models and the stars denote experimental data. The experimental S(Q) were taken from [22] |
 | Figure 5. Temperature variation of the static structure factor, S(Q), as obtained for liquid Au from RMC. The solid line denotes theoretical models and the stars denote experimental data. The experimental S(Q) were taken from [22] |
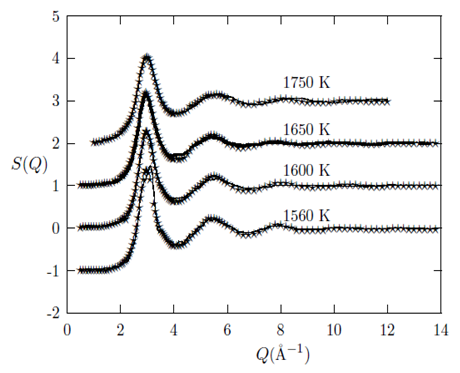 | Figure 6. Temperature variation of the static structure factor, S(Q), as obtained for liquid Fe from RMC. The solid line denotes theoretical models and the stars denote experimental data. The experimental S(Q) were taken from [22] |
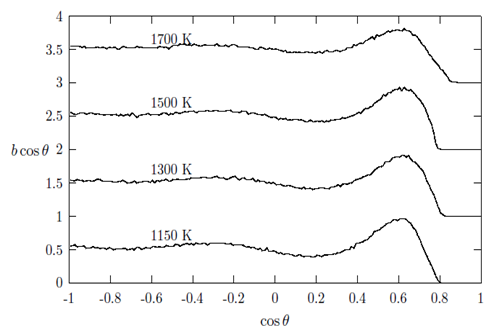
 from a central atom forming an angle θ with the central atom. For this reason the bond-angle distributions for liquid Cu, Au and Fe were calculated by using the results of the RMC simulations which are shown in Figures 7, 8 and 9. As seen from the figures, each of the liquid metal exhibits existence of two peaks irrespective of the cut-off radius rc, one ranging between cos θ ≈ -0.241 to -0.406 and other between cos θ ≈ 0.569 to 0.620, as seen in Table 3.
|
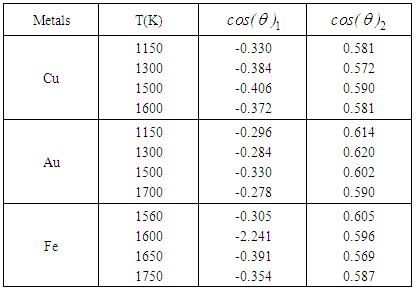
 , in g(r) (see Table 2).In addition, bcos θ looks very similar for all the liquid metals studied with some variation in the heights of the main peak with a distinct well pronounced maximum at cos θ in the range of 0.569 to 0.620. These features indicate a presence of a bond-angle of nearly 60 degrees. This angle (θ ≈ 60°) is characteristic of close-packed bonding in the systems. Since bcos θ provides valuable information regarding local structural units and their connectivity in the liquid structures. The distribution for the central atom of an ideal 13-atom icosahedra cluster shows peaks at 63.4°, 116.4° and 180.0° [6]. Other crystallographic clusters, like hcp, fcc and bcc, we see peaks at 60°, 90° and 120°. Angels around 60° indicate nearly equilateral triangles that may well belong to tetrahedral. One might feel that the existence of 60° peaks is indicative of triplets of Cu, Au and Fe hard spheres, respectively. An interesting question pose here is whether triplets with a bond angle of 60° really exist naturally for these liquid metals. However, it is important to note that the experimental data allows a diversity of bond angles and coupled with the fact that RMC simulation always produces the structure with the highest degree of disorder that a particular set of data allows. Therefore, the clear peaks around 60° in all the metals investigated is presumed to indicate a close packed bonding, a feature typical of simple liquid structure [30]. The overall similarity in g(r), S(Q) and bcos θ shows that the local structure of the liquids may be described as a distortion of the bcc crystal structures of the liquids at their melting points and temperatures above the melting points [6, 8]. It is also observed that the bond angle distribution curves obtained in this work are similar to that obtained by Howe et al., [30] for molten Rb, which further corroborates our submission of possibility of the local structure of the liquid metals being that of distorted bcc crystals.
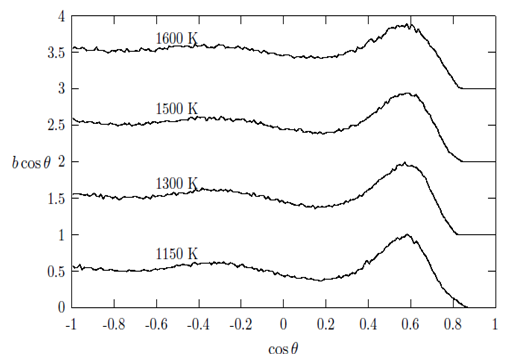 | Figure 7. The bold-angle distribution, bcos θ against cos θ as obtained for liquid Cu at 1150 K, 1300 K, 1500 K and 1600 K, respectively |
 | Figure 8. The bold-angle distribution, bcos θ against cos θ as obtained for liquid Au at 1150 K, 1300 K, 1500 K and 1700 K, respectively |
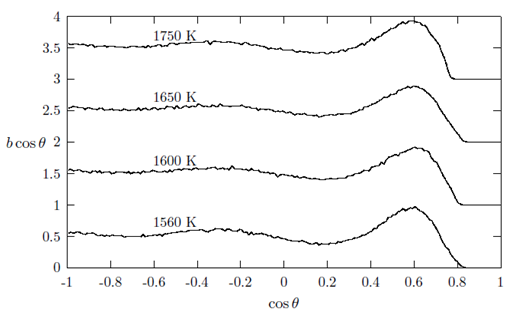 | Figure 9. The bold-angle distribution, bcos θ against cos θ as obtained for liquid Fe at 1560 K, 1600 K, 1650 K and 1750 K, respectively |
4. Conclusions
- Structural properties of three liquid metals Cu, Au and Fe at various temperatures close to their melting points and above, have been carried out using the reverse Monte Carlo method. The results obtained gave useful insights into the atomic configurations of the liquid metals studied. The study confirms the general trend that variation of the sample temperature is accompanied mainly by change in the intensity of the diffraction peaks, while the position of the peaks practically does not change. The overall agreement between the modeled data and experiment is good enough for a better understanding of the three dimensional structures of liquid metals, but not their dynamic properties. In addition, the observed similarity in g(r), S(Q), bcos θ and ⟨Nc⟩ have been discussed. It is observed that the average coordination number changes directly with density throughout the whole of the density regions investigated. Therefore, it can be concluded that the position of the first peak in g(r) and ⟨Nc⟩ indicate that the local structures in the liquid metals change from the high-coordinated state to the low-coordinated state as density decreases, and hence, there is a gradual change from a close-packed structure to a less close-packed structure in the systems investigated.
ACKNOWLEDGEMENTS
- One of the authors Y. A. is grateful to Prof. O. Akinlade, Department of Physics, Federal University of Agriculture, Abeokuta, Nigeria for the data used in this study.
References
| [1] | I. Kaban, W. Hoyer, A. Il’inskii, O. Slukhovskii and S. Slyusarenko, Short-range order in liquid Silver-tin alloys, J. Non-Cryst. Solids 331 (2003) 254-262. |
| [2] | A. Mellergard and R. L. McGreevy, Reverse Monte Carlo modelling of neutron powder diffraction data, Acta Crystallogr. A 55 (1999) 783. |
| [3] | T. Petkova, P. Petkov, P. Jóvári, I. Kaban, W. Hoyer, A. Schps, A. Webb and B. Beuneu, J. Non-Cryst. Solids 353 (2007) 2045. |
| [4] | P. Jóvári, I. Kaban, J.Steiner, B. Beuneu, A. Schöps and A. Webb, ‘Wrong bonds’ in sputtered amorphous Ge2Sb2Te5, J. Phys.: Condens. Mat. 19 (2007) 335212. |
| [5] | K. Saksl, P. Jóvári, H. Franz, Q. S. Zeng, J. F. Liu and J. Z. Jiang, Atomic structure of Al89La6Ni5 metallic glassJ. Phys.: Condens. Mat. 18 (2006) 7579-7592. |
| [6] | P. Ganesh and M. Widom, Signature of nearly icosahedral structures in liquid and supercooled liquid copper, Phys. Rev. B 74 (2006) 134205. |
| [7] | T. Tomida and T. Egami, Molecular-dynamics study of orientational order in liquids and glasses and its relation to the glass-transition, Phys. Rev. B 52 (1995) 3290-3308. |
| [8] | P. R. ten Wolde, M. J. Ruiz-Montero and D. Frenkel, Numerical calculation of the rate of crystal nucleation in a Lennard-Jones system at moderate undercooling, J. Chem. Phys. 104 (24) (1996) 9932. |
| [9] | T. Itami, S. Munejiri, T. Masaki, H. Aoki, Y. Ishii, T. Kamiyama, Y. Senda, F. Shimojo and K. Hoshino, Structure of liquid Sn over a wide temperature range from neutron scattering experiments and first-principles molecular dynamics simulations: A comparison of liquid Pb, Phys. Rev. B 67 (2003) 064201-12. |
| [10] | R. L. McGreevy and L. Pusztai, Reverse Monte Carlo simu lation: A new technique for the determination of disordered structures, Mol. Sim. 1 (1988) 359-367. |
| [11] | R. L. McGreevy, M. A. Howe and J. D. Wicks, RMCA Version 3.14, A General Purpose Reverse Monte Carlo Code, June, 2005. |
| [12] | M. A. Howe and R. L. McGreevy, Determination of three body correlations in liquid by RMC modeling of diffraction data. I. Theoretical tests. Phys. Chem. Liq. 24 (1991) 1-12. |
| [13] | P. Jóvári, L. Pusztai, Structure of disordered forms of selenium close to the melting point, Phys. Rev. B 64 (2001) 014205. |
| [14] | P. Jóvári, R. G. Delaplane and L. Pusztai, Structural models of amorphous selenium, Phys. Rev. B 67 (2003) 172201. |
| [15] | K. Hoshino and F. Shimojo, Structure and electronic states of expanded and compressed liquid alkali metals by ab initio Molecular dynamics Simulation, High Temp. Mater. Processes 18(1-2) (1999) 79-85. |
| [16] | V. M. Nield and P. T. Verronen, The structure of expanded mercury, J. Phys.: Condens. Mat. 10 (1998) 8147-8153. |
| [17] | M. Mahladisa, L. Ackermann and P. E. Ngoepe, Structural properties of gold clusters at different temperatures, South African J. Sci. 101 (2005) 471. |
| [18] | I. Kaban, W. Hoyer, T. Petkova, B. Beuneu, A. Schöps and A. Webb, Atomic structure of As34Se51Ag15 glass, J. Ovonic Research 3 (4) (2007) 67-70. |
| [19] | G. Evrard and L. Pusztai, Reverse Monte Carlo modelling of the structure of disordered materials with RMC++: a new implementation of the algorithm in C++, J. Phys.: Condens. Mat. 17 (2005) S1-S13. |
| [20] | R. L. McGreevy, RMC – progress, problems and prospects. Nucl. Instrum. Methods Phys. Res., A, Accel. Spectrum. Detect. Assoc. Equip., 354 (1995) 1–16. |
| [21] | R. L. McGreevy, Computer Modelling in Inorganic Crystallography ed C. R. A. Catlow (New York: Academic) p151, 1997. |
| [22] | Y. Waseda, The Structure of Non-Crystalline Materials, McGraw-Hill, New York, 1980. |
| [23] | R. L. McGreevy, Reverse Monte Carlo modelling, J. Phys.: Condens. Mat. 13 (2001) R877. |
| [24] | O. Gereben, G. Evrard, L. Pusztai, RMC++ version 2 (2005); available at: http://www.szfki.hu/nphys/rmc++/opening.html |
| [25] | V. M. Nield, M. A. Howe and R. L. McGreevy, The metal-non metal transition in expanded cesium. J. Phys: Condensed Matter 3 (1991) 7519-7525. |
| [26] | G. Kresse and J. Hafner, Ab initio molecular dynamics for open-shell transition metals, Phys. Rev. B 48 (1993) 13115. |
| [27] | A. Pasquarello, K. Laasonen, R. Car , C. Lee and D. Vanderbilt, Ab initio Molecular Dynamics for d - Electron Systems: Liquid Copper at 1500 K, Phys. Rev. Lett. 69 (1992) p1982. |
| [28] | A. Il’inskii, I. Kaban, S. Slyusarenko, W. Hoyer, Phys. Met. 14 (8) (1995) 927. |
| [29] | A. G. Il’inskii, I. G. Kaban, S. I. Slyusarenko, W. Hoyer, Metallofizika 15 (8) (1993) 42. |
| [30] | M. A. Howe, R. L. McGreevy, L. Pusztai and I. Borzsak, Determination of three body correlations in simple liquids by RMC modelling of diffraction data. II. Elemental liquids, Phys. Chem. Liq. 25 (1993) 204. |
| [31] | A. Il’inskii, S. Slyusarenko, O. Slukhovskii, I. Kaban, W. Hoyer, Structural properties of liquid Fe-Si alloys, J. Non-Crystal. Solids 306 (2002) 90-98. |
| [32] | M. M. G. Alemany, J. L. Martins and B. J. Costa Cabral, First-principles molecular dynamics of liquid rubidium at low density, J. Non-Cryst. Solids 347 (2004) 100. |