-
Paper Information
- Paper Submission
-
Journal Information
- About This Journal
- Editorial Board
- Current Issue
- Archive
- Author Guidelines
- Contact Us
American Journal of Condensed Matter Physics
p-ISSN: 2163-1115 e-ISSN: 2163-1123
2016; 6(2): 36-40
doi:10.5923/j.ajcmp.20160602.03

Characterization of Cracks in Tubular Anodic Aluminum Oxide Membrane
 Abstract
 Reference
 Full-Text PDF
 Full-text HTML
Jafar Khan Kasi, Ajab Khan Kasi, Muzamil Bokhari, Muhammad Sohail
Department of Physics, University of Balochistan, Quetta, Pakistan
Correspondence to: Jafar Khan Kasi, Department of Physics, University of Balochistan, Quetta, Pakistan.
| Email: |  |
Copyright © 2016 Scientific & Academic Publishing. All Rights Reserved.
This work is licensed under the Creative Commons Attribution International License (CC BY).
http://creativecommons.org/licenses/by/4.0/

Tubular anodic aluminium oxide membrane is an attractive structure used for variety of applications. One of the main issues in the fabrication process of tubular membrane is the generation of cracks. In this research the crack at the external surface of the tubular membrane has been studied. Different diameter of aluminium tubes were used in this work, it was observed that more cracks produce in smaller diameter tube than larger diameter. The results also showed that the number of cracks produces at the surface of tubular membrane is directly proportional to the thickness of the membrane. Varying the anodization conditions crack free tubular membrane was fabricated successfully. A mathematical relation was developed on the basis of statistical model using various parameters such as number of cracks, tube diameter and anodization time.
Keywords: Cracks, Tubular membrane, Anodization, Statistical model
Cite this paper: Jafar Khan Kasi, Ajab Khan Kasi, Muzamil Bokhari, Muhammad Sohail, Characterization of Cracks in Tubular Anodic Aluminum Oxide Membrane, American Journal of Condensed Matter Physics, Vol. 6 No. 2, 2016, pp. 36-40. doi: 10.5923/j.ajcmp.20160602.03.
Article Outline
1. Introduction
- In this miniaturization era of science and technology, the researchers are trying to replace the conventional lithographic processes by self-organized processes avoiding the complexity and labour. Anodic aluminium oxide (AAO) membrane is also a self-organized hexagonal closed pack nanostructure produce from aluminium (Al). In this electrochemical process oxide layer is formed on the aluminium surface through self-assembly. AAO (alumina) is a hexagonal closed packed ceramic structure consists of oxides cell in a very regular arrangement [1]. In the early twentieth century, the anodization was used for industrial scale applications such as protection of seaplane parts from corrosive seawater [2]. Growth rate of the alumina is the function of temperature; however at higher temperature the pore regularity is affected. The suitable temperature for the oxide growth is 0°C. Earlier AAO planer membrane was fabricated using one step of anodization [3]. To improve the pore regularity and alignment researchers’ introduced two steps (first step follow by etching and cleaning then second step) of anodization in 1996 [4]. They obtained well aligned nanoporous hexagonal AAO structure. Alumina has many potential applications in various devices such as filters [5], sensors [6], photonics [7], hemodialysis [8], drug delivery [9], synthesis of carbon nanotube [7], making mask [10], and semiconductor industries [11]. Mainly there are two types of anodization including hard anodization (HA) and mild anodization (MA). For commercial purposes, where pore regularity is not very important, hard anodization is used because of higher anodization growth rate. The disadvantage of the hard anodization was the irregularity and formation of cracks at the surface of alumina [12]. To overcome the cracking issue Lee et al. developed a method called pulse anodization (PA), where they combined the two main processes of anodization (MA and HA) in 2006 [13]. However MA is used for research purposes, because it provides more regularity to pore structure. Among many theories put forwarded about the formation of self-organized hexagonal structure, mechanical stress theory is more acceptable. According to this theory Jessensky et al. suggest the volumetric expansion produce during oxide formation from Al, as a consequence it produces mechanical stress between the nanopores which is responsible for the hexagonal structure [14]. However the researchers have not agreed on a single point yet about the formation of pores and its hexagonal formation. The alumina membrane has well aligned pores, penetrate through the whole thickness with uniform density. The pores size is easily managed from few nanometers (~5nm) to several hundred (~300nm) nanometers [15]. New techniques such as template-directed growth [16], nano-imprinting [17] and multiple beam interference lithography [18] are outstanding candidate for the fabrication of three dimensional (3D) nanostructures. Tubular membrane is more practicable and stronger than planar membrane because it is more useful for separation and filtration purposes [19]. For stronger membrane ultimately researchers need to increase thickness of the membrane but it may cause hindrances in the fluid applications due to high aspect ratio of the pores. Different methods were adopted for making tubular membrane. Kasi et al. reported a method in which tubular membrane was made exploiting the cracks on the surface [20]. Yoo argued that the cause of the radial cracks is the expansion in the Al oxide layer which creates a tensile stress in the aluminium / aluminium- oxide interface and thus cracks arise for the release of tension [21]. One of the ways to overcome the cracks on the external surface is to fabricate large diameter tube. In thick tubular membrane cracks are unavoidable. In this research characterization of cracks in AAO tubular membranes is reported. Using the experimental data a statistical model is proposed which tells us the safe limit of tubular membrane fabrication. In this research crack free tubular membrane from 2 mm to 19 mm diameter were fabricated successfully.
2. Experimental
2.1. Materials
- Pure (99.56%) aluminium tubes of 2mm to 19mm of diameter from Nilaco (Japan) were used as testing materials for the fabrication of tubular alumina. Prior to anodization all samples (aluminium tubes) were washed in acetone and deionized water.
2.2. Fabrication
- AAO membranes were fabricated by two electrodes setup [22]. Cooling system of the setup maintained the temperature of the chamber 0°C -2°C. For better pore regularity two steps anodization was implemented for all tubular membranes used in the research. Initially annealing of all the Al tubes were made at 400-450°C in the presence of nitrogen gas in order to improve the crystal structure of Al tubes and sheet. Annealing also removed the mechanical stress came in tubes due to cutting and shaping. Subsequently ultrasonically cleaned and degreased in acetone for about 10min, later the same cleaning process was repeated in the DI water in order to remove the acetone residual from samples. For getting mirror finishing surface all Al tubes were electro-polished in 4:1 volume ratio ethanol and perchloric acid for 5 min applying potential difference of 20 volts. As high density current (0.5-1A/cm2) was provided for electro-polishing. All the samples were electro polished one by one observing the current level and temperature of the electrolyte. To clean the samples from electropolishing chemicals again cleaning process was done as mentioned above. After electropolishing and de-blurring all the tubes mild anodization process was started. In the first step of anodization seven different diameter tubes were fixed together as shown in Fig. 1 and connected with anode in one set of experiment. Oxalic acid (0.3 M) electrolyte was used for anodization applying 40 volts potential difference between cathode and anode.
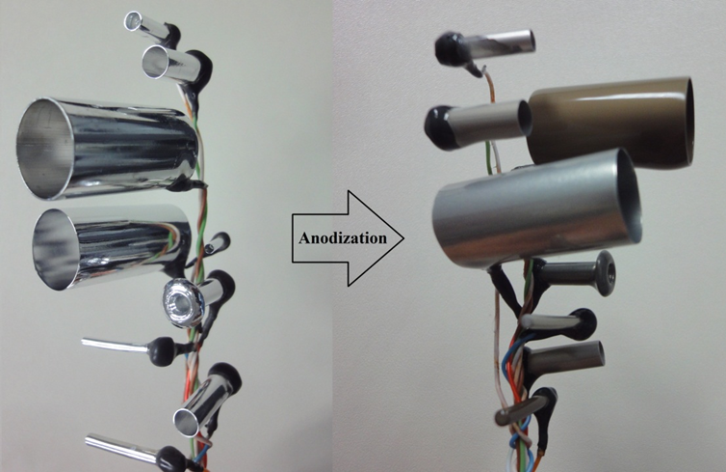 | Figure 1. Set of Al tubes consist of different diameter tubes before and after anodization |
2.3. Characterization of Membrane
- Field emission scanning election microscope (FE-SEM) was used to examine and analyze the crack formation, surface morphology, pore size, pore regularity, cell size, and shape. Prior to FE-SEM characterization, all pieces of samples were separated from tubular membrane and made gold sputtering. Digital images were made through optical microscope and digital camera in order to observe the crack at the surface of tubular membrane.
3. Result and Discussion
- The formation of cracks in the tubular membrane after anodization is shown in the figure 2. The FE-SEM and optical images depict the cracks at the external structure of AAO tubular membrane.
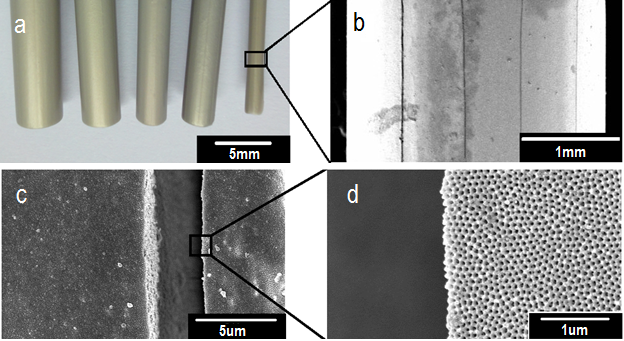 | Figure 2. Formation of Cracks in Al tubes. (a) Optical image of different diameter tubes (b) FE-SEM image of tubular membrane cracks (c) Depth and width of crack, and (d) AAO structure at the edge of the crack |
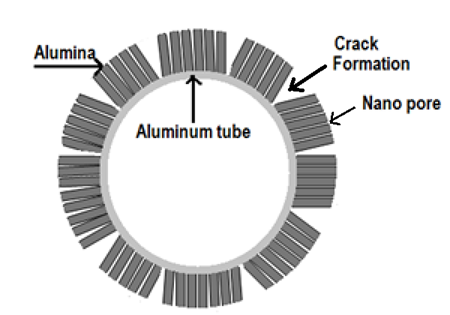 | Figure 3. Schematic for the formation of cracks in tubular AAO membrane |
|
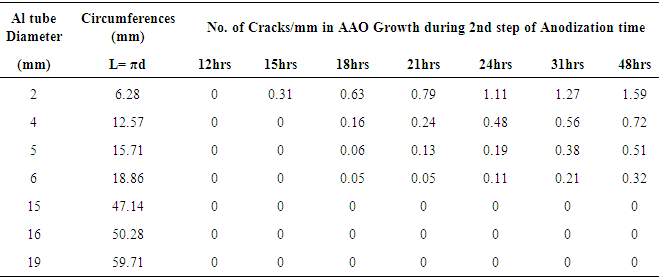
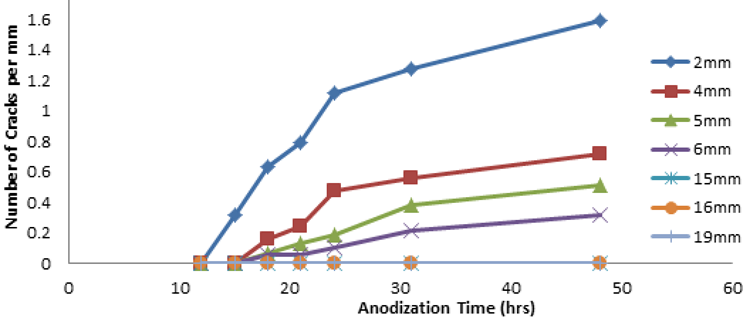 | Figure 4. Graphical representation of number of cracks and anodization time in various tubular membranes |
3.1. Statistical Analysis
- Nonlinear regression model was used to find equation which would predict number of cracks in tubular membrane fabricated at different processing conditions. Mathematical relation for dependant variable (y) of cracks/ mm was achieved on the basis of nonlinear regression model. y = ax1b x2cHere x1 and x2 represent independent variable of time and diameter of tube. The non-linear regression model was selected on the bases of best R2 (goodness of fit) that was 0.91, model significance and model complexity. The parameters ‘a’ represents regression coefficient, ‘b’ represents exponent of time and ‘c’ represents exponent of diameter. 11% of standard error was estimated in the used statistical model. For these experiments we set α = 0.05 and found that the model’s F-ratio statistically significant, because the estimated value such as p-value and 95% confidence interval.Figure 5 illustrates graphical representation of statistical model. A large area of the predicted values covers the number of cracks per mm with small error, black arrow are over fitted while red arrows show the under fitted.
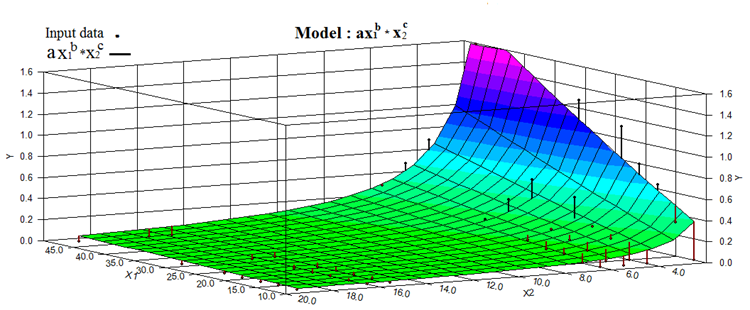 | Figure 5. Graphical illustration of statistical model. A large area of the predicted values covers the number of cracks per mm, black arrow are over fitted while red arrows show under fitted |
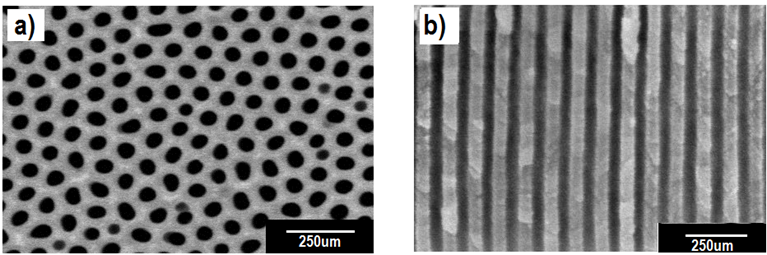 | Figure 6. SEM images of the nanopores and nanochannels formed in the AAO membrane |
4. Conclusions
- In this paper we described characterization of cracks in AAO tubular membrane considering oxalic acid as electrolytic solution. For the characterisation of cracks in the tubular membrane various condition were studied. To overcome the generation of cracks in the tubular membrane different technique were adapted. Different diameter of aluminium tubes were used in this work, it was observed that more cracks produce in smaller diameter tube than larger diameter. The results also showed that the number of cracks produces at the surface of tubular membrane is directly proportional of thickness of the membrane. Varying the anodization conditions crack free tubular membrane was fabricated successfully. A relation was developed on the basis of statistical model using various parameters such as number of cracks, tube diameter and anodization time. In the future work we will extend our research involving other electrolytes such as sulfuric, phosphoric and malonic acids. Besides the used parameters (number of crack per millimeter, anodization time and tube diameters) another important parameter ‘growth rate’ will also be involved in the statistical model which may provide more opportunities to researcher in the field for selecting correct anodizing conditions.