M. Y. Onimisi1, J. T. Ikyumbur2
1Department of Physics, Nigerian Defence Academy, Kaduna, Nigeria
2Department of Physics, Federal College of Education, Pankshin, Nigeria
Correspondence to: M. Y. Onimisi, Department of Physics, Nigerian Defence Academy, Kaduna, Nigeria.
| Email: |  |
Copyright © 2015 Scientific & Academic Publishing. All Rights Reserved.
Abstract
The Debye relaxation equation and its derivatives were used to analyze the experimental permittivity data of high purity Butan-1-ol and Ethanol over the frequency up to 10GHz and temperature range of 10°C to 50°C. The plots of dielectric constant  and loss factor
  against the frequency were found useful in determining how well experimental data fits the Debye equation and these methods were also found capable of reproducing good results for both coaxial cell (i.e. reflection and 14mm-transmission cell) and the results fitted using single-Debye, Debye-Г or double-Debye. The dielectric constant of Ethanol was found decreasing as the temperature increases beyond 10°C but that of Butan-1-ol showed an increase at temperature 20°C before decreasing as the temperature increased beyond 20°C. The loss factor on the other hand was found decreasing as the temperature increases for both Butan-1-ol and Ethanol. However, Butan-1-ol has the highest loss factors and the least dielectric constants as compared with Ethanol within the frequency and temperature range studied in this work.
Keywords:
Debye relaxation, Dielectric constant, Loss factor, Butan-1-ol and Ethanol
Cite this paper: M. Y. Onimisi, J. T. Ikyumbur, Comparative Analysis of Dielectric Constant and Loss Factor of Pure Butan-1-ol and Ethanol, American Journal of Condensed Matter Physics, Vol. 5 No. 3, 2015, pp. 69-75. doi: 10.5923/j.ajcmp.20150503.02.
1. Introduction
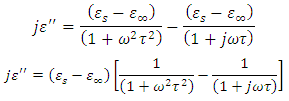
Most industries need a better knowledge of the materials they are working with to shorten design cycles, improve incoming inspection, process monitoring, and quality assurance. Every material has a unique set of electrical characteristics that dependent on its electric properties. Accurate measurements of these properties can provide scientists and engineers with useful information to properly incorporate the material into its intended application for solid designs or to monitor a manufacturing process for improved quality control.A dielectric materials measurement can provide critical design parameter information for many electronics applications. For instance, the loss of a cable insulator, the impedance of a substrate, or the frequency of a dielectric resonator can be related to its dielectric properties. According to Agilent Basics of measuring the dielectric properties of materials the information on electric properties of materials is also useful for improving ferrite, absorber and packaging designs. Today the knowledge of dielectric properties can be apply in areas such as aerospace, automotive, food and medical industries. The knowledge of dielectric properties of materials is important because the data if properly interpreted will provide information on the electrical properties of the sample and can be used as an analytical tool whereby the dielectric data is related to other properties such as changes in crystal structure or gel morphology [1].Atoms, molecules, and defects available in materials re-adjust in equilibrium in response to an applied electric field. This re-adjustment of atoms, molecules, and defects in materials in response to an electric field is known as dielectric relaxation. The relaxation behaviour depends on the lattice properties, frequency, and the temperature [2]. Dielectric relaxation is a many particle phenomenon; it can be used as suitable tool to insight into specific molecular interactions in polar liquids [3, 4]. Dielectric constant among other applications can be used to distinguish non-polar solvents from polar solvents. For instance, solvents with a dielectric constant less than 15 are generally considered nonpolar while those with dielectric constant more than 15 are known as polar solvents. Technically, the dielectric constant measures the solvent’s ability to reduce the field strength of the electric field surrounding a charged particle immersed in it. This reduction is then compared to the field strength of the charged particle in a vacuum. In layman’s terms, dielectric constant of a solvent can be thought of as its ability to reduce the solute’s internal charge. Dielectric relaxation can also be used for the study of H-Bonded liquids [5]. The polarity, dipole moment, polarizability and hydrogen bonding of a solvent determines what type of compounds it is able to dissolve and with what other solvents or liquid compounds it is miscible. As a rule of thumb, polar solvents dissolve polar compounds best and nonpolar solvents dissolve nonpolar compounds best. The dielectric constant and loss factor of Butan-1-olhas been fitted by Gregory and Clarke [6] using Debye-Г, and double-Debye depending on the temperature and that of Ethanol was also fitted by the same authors using Debye-Г in the frequency range of  . The mathematical expression of these two Debye models is given in equations (1) and (2) below.
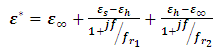 | (1) |
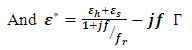 | (2) |
Equations (1) and (2) are called double-Debye (5 parameters) containing two dielectric relaxations and Debye-Г (4 parameters) with a single relaxation [6]. However, in this work, attempt have been made to fit the same dielectric constant and loss factor using Debye and its derivatives as used by Kuang and Nelson [7] and the results generated by this method shall be compared with the coaxial cell and work done using double-Debye and Debye-Г.
2. Mathematical Derivation of the Debye Equations
Let us consider a capacitor that consists of two plane parallel electrodes in a vacuum having an applied alternating voltage as: | (3) |
Where  is the instantaneous voltage,
  is the maximum instantaneous,
  and
and  is the angular frequency in radian per second.Let us also assume that the current passing through the capacitor is given by:
 | (4) |
 is maximum current and is defined as
 | (5) |
Where  is the impedance and if
  , then
 | (6) |
Substituting equation (6) into equation (5), we have | (7) |
In equation (7)  is the vacuum capacitance, sometimes referred to as the geometric capacitance.In an ideal dielectric the current leads the voltage by
  and there is no component of the current in phase with the voltage. If a material of dielectric constant
  is placed between the plates the capacitance increases to
  and the current is given by:
 | (8) |
Where  is the loss angle
 | (9) |
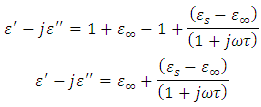
The dielectric constant is a complex quantity and it is represented by: | (10) |
 is the real part while
  is the imaginary part of the complex dielectric constant,
  in an alternating dielectric field. The component in the phase with the applied voltage gives rise to dielectric loss
  which is the loss angle and given by:
 | (11) |
Where  the loss is angle and
  is the loss factor. The horizontal component; is the current which is given by:
 | (12) |
But | (13) |
Substituting equation (13) into (12) gives  | (14) |
The electric field can also be defined by: | (15) |
 | (16) |
We also defined current density as: | (17) |
Now, substituting equation (16) into equation (17), we obtain | (18) |
The alternating current conductivity is given by | (19) |
Where  | (20) |

 | (21) |
When  very small, equation (21) becomes
 | (22) |
And the total conductivity is given by | (23) |
Where  is the direct current conductivity
3. Polarization Build up
When a dc voltage is applied to a polar dielectric, then, the polarization builds from zero to the final value. Referring to the exponential law, we can write our polarization as function of time as: | (24) |
Where  the polarization at time is,
  is the relaxation time and it is the function of temperature and independent of the time.If
  ; then differentiating equation (24) with respect to time t using product rule. i.e.
 We let
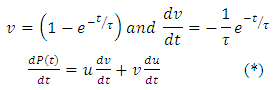 Substituting the above expression into equation (*), we have
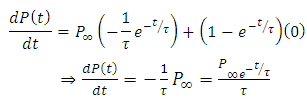 | (25) |
Expanding the right hand side of equation (24), we have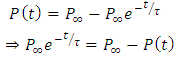 | (26) |
Dividing equation (26) both sides by  , we have
 | (27) |
Substituting equation (27) into equation (25), we obtain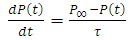 | (28) |
We can now express our total polarization as: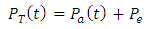 | (29) |
Where  is the atomic polarization and
  is electronic polarization. The final value attained by the total polarization is given by:
 | (30) |
 | (31) |
Where  and
and  are the dielectric constant under direct voltage and at infinity frequency respectively.The
  is defined in Maxwell’s relation as:
 | (32) |
Substituting equations (30) and (31) into (29), we have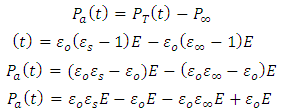 | (33) |
 | (34) |
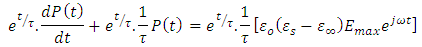
Representing the alternating electric field as: | (35) |
Substituting equation (34) into equation (28), we have | (36) |
Substituting equation (35) into equation (36), we have
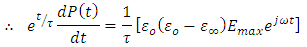
 Adding on both sides of the expression
  , we have
 | (37) |
Solving equation (37) using integration by factor; let the integrating factor be  , where

 Multiplying equation (37) by
  , we have
 Note that the left hand side of the above expression is the derivative of

 Taken the integral both sides, we have
 | (38) |
Note: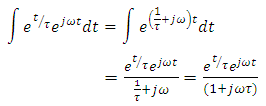 | (39) |
Substituting equation (39) into equation (38), we have
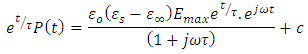 Dividing the above expression by the factor
  , we have
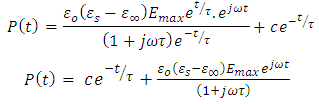 | (40) |
Where  is a constant and if time t is sufficiently large when compared with
  , then the first term on the right hand side of equation (40) becomes so small that it can be neglected and we get solution for
  as:
as: | (41) |
Substituting equation (41) into equation (39), we get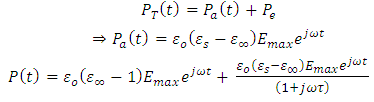 | (42) |
Simplifying equation (42), we obtain | (43) |
Equation (43) shows that  is a sinusoidal function with the same frequency as the applied voltage. The instantaneous value of the flux density D is given by:
 | (44) |
The flux density is equal to | (45) |
Equating equation (44) with equation (45), we have | (46) |
Substituting equation (43) into equation (46) and simplifying it, we get | (47) |
Dividing equation (47) by the factor  , we have
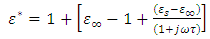 | (48) |
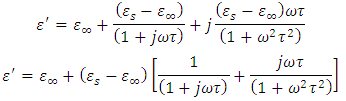
Equating equation (10) with equation (48), we have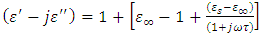 | (49) |
Solving for real and imaginary parts of equation (49), we have
 This gives
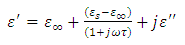 | (50) |
Now setting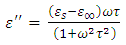 | (51) |
Substituting equation (51) into equation (50), we have
 Taking the LCM of the above expression and cancelling out common terms gives
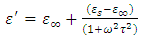 | (52) |
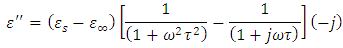
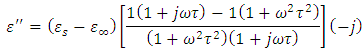
To obtain  , we again consider the imaginary part of equation (49), i.e.
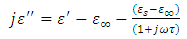 | (53) |
Substituting equation (52) into equation (53), we have
 Dividing the above expression by
  , we have
 Taking the LCM of the above expression, we obtain
 Simplifying the above expression yields
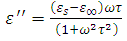 | (54) |
Equations (52) and (54) are known as the Debye equations [7] and they describe the behaviour of polar dielectric at various frequencies. The temperature enters the discussion by way of the parameter known as the relaxation time,  In this work, the value of relaxation time,
  is obtained using the relationship below
  Equations (52) and (54) were used to compute the values of the dielectric constant, loss factor, and relaxation time respectively. The values of the complex permittivity
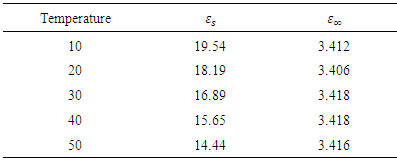
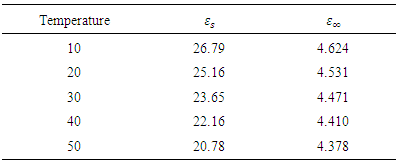
  and static permittivity
  used in this work were adapted from National Physical Laboratory Report MAT 23 [6] as shown in tables (1) and (2) below. Maple-13 has been used to generate the results used in this work as shown in the Appendix A below.
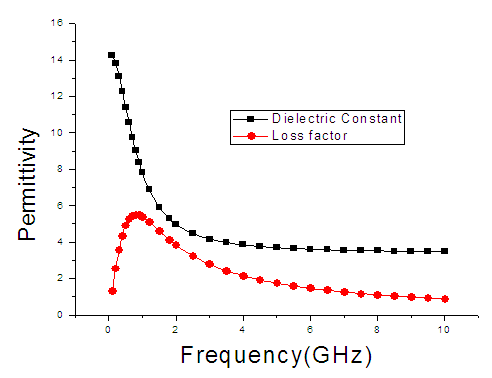
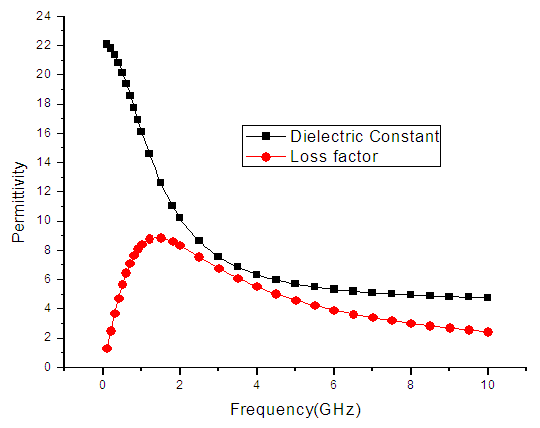
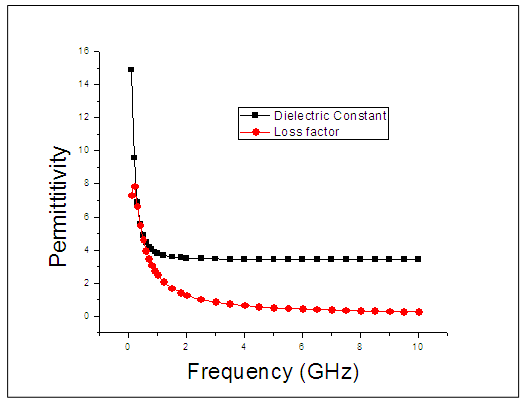 | Figure 1. The graph of permittivity of Butan-1-ol at 10°C against the frequency |
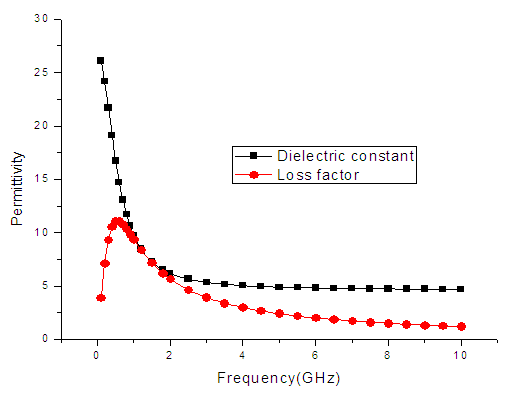
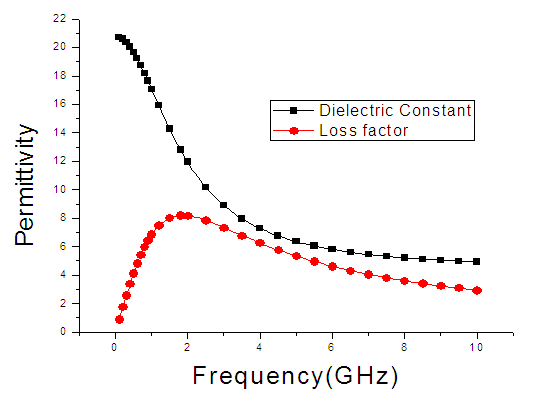
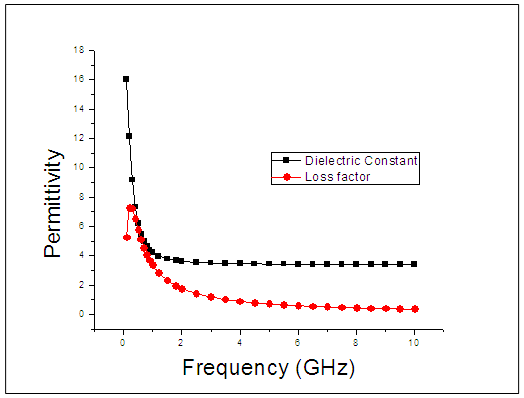 | Figure 2. The graph of permittivity of Butan-1-ol at 20°C against the frequency |
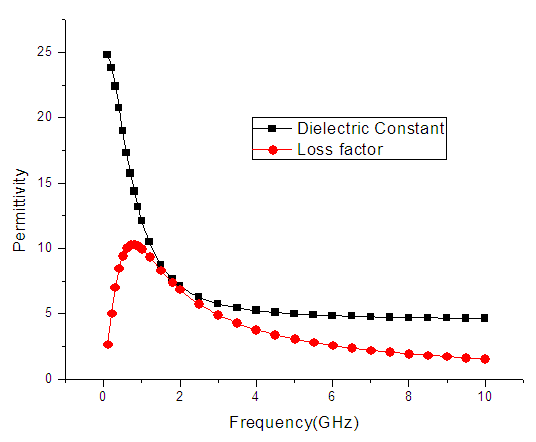
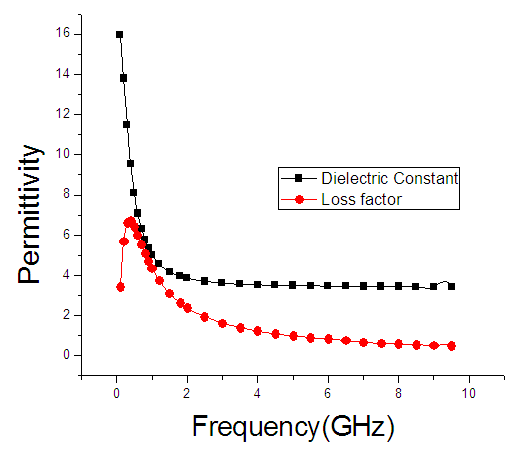 | Figure 3. The graph of permittivity of Butan-1-ol at 30°C against the frequency |
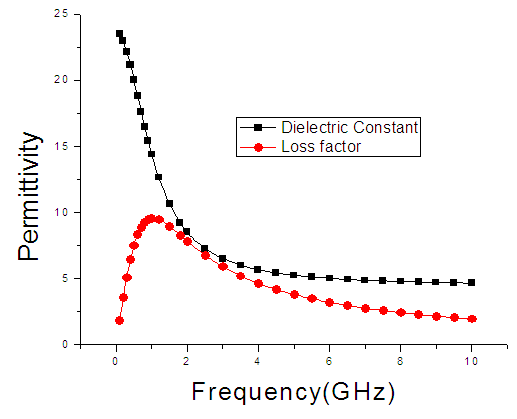
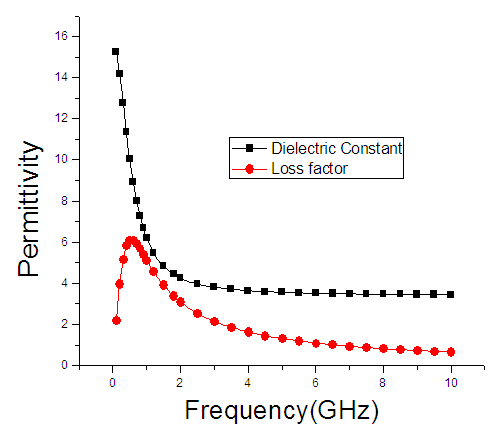 | Figure 4. The graph of permittivity of Butan-1-ol at 40°C against the frequency |
 | Figure 5. The graph of permittivity of Butan-1-ol at 50°C against the frequency |
 | Figure 6. The graph of permittivity of Ethanol at 10°C against frequency |
 | Figure 7. The graph of permittivity of Ethanol at 20°C against frequency |
 | Figure 8. The graph of permittivity of Ethanol at 30°C against frequency |
 | Figure 9. The graph of permittivity of Ethanol at 40°C against the frequency |
 | Figure 10. The graph of permittivity of Ethanol at 50°C against the frequency |
Table 1. Parameters for Butan-1-ol
 |
| |
|
Table 2. Parameters for Ethanol
 |
| |
|
4. Discussion
The dielectric constant and the loss factor of Butan-1-ol, and Ethanol were computed using Debye relaxation method. The results revealed that the dielectric constant  is higher at low frequencies for both Butan-1-ol and Ethanol. However, as the temperature increases the dielectric constant of Ethanol was found decreasing. Unlike that of Butan-1-ol which has its highest dielectric constant at temperature 20°C. This decreased in the dielectric constant as the result of increased in the temperature may be due to the relaxation time which has been found to be fast at high temperatures and increases dramatically at low temperatures, suggesting a freezing of electric dipoles at low temperatures [8]. The loss factor on the other hand was found decreasing throughout in our calculation. However, Butan-1-ol has the highest value of the loss factor.The higher value of dielectric constant
  at low frequencies may be due to the effect of ionic conductivity which varies inversely proportional to the frequency. Butan-1-ol has the least dielectric constant and high value of the loss factor as when compare to Ethanol for all frequencies and temperatures considered in this work. It is also observed that Butan-1-ol recorded its highest dielectric constant value at 20°C. This also implies that Butan-1-ol is better solvent at the temperature 20°C. The higher value of dielectric constant
  as observed in this work at low frequencies may be to the overall conductivity which consists of different conduction mechanisms. The most prevalent one in moist materials is the ionic conductivity.The graphs of dielectric constant
  and loss factor
  against the frequency in gigahertz at various temperatures revealed that the dielectric constant
  for both Butan-1-ol and Ethanol studied in this work have higher value of dielectric constant
  at low frequencies then decreased sharply with increasing frequency and after that it remains almost constant over the entire frequency. The loss factor
  which is believed to be dominant by the influence of electrolytic conduction caused by free ions which exist in the presence of a solvent behave very similar in nature like the dielectric constant
  . The loss factor
  on the other hand decreased rapidly and becomes almost constant afterwards as shown in the above graphs. According to Karmakar et al [9] this behaviour indicates a normal behaviour of the dielectric.The decrease of dielectric constants in higher frequency range for both Butan-1-ol and Ethanol studied in this work may be due to the fact that the dipoles cannot follow up the fast variation of the applied field. The higher values of
  and
and  at lower frequencies may be due to the contribution from all the four types of polarization (i.e. space charge, dipole, ionic and electronic polarization). Salman et al [10] Observed that at higher frequencies, only the ionic and electronic polarizations contribute to the values of dielectric constant of materials. The decrease of dielectric constant
  with increasing frequency means that, the response of the permanent dipoles decreases as the frequency increases and the contribution of the charge carriers (ions) towards the dielectric constant decreases [11, 12].
5. Conclusions
The Debye equation and its derivatives have been used to compute the dielectric constant and loss factor of both Butan-1-ol and Ethanol. The results revealed that within the frequency range of  Ethanol has the highest values of the dielectric constant and least value of the loss factor. This mean that Ethanol is better solvents when compare with Butan-1-ol for those temperatures. On the other hand Butan-1-ol has highest value of the dielectric constant at temperature 20°C which implies that Butan-1-ol is the better solvent at this temperature. This showed that the Debye relaxation method and its derivative are capable of mimicking good results for both the coaxial cells and work done using Debye-Г or double-Debye.
References
| [1] | Duncan Q. M Craig (2005). Dielectric Analysis of Pharmaceutical Systems. Published by Taylor & Francis e-Library: 1-2. |
| [2] | Thakur, K.P, Thakur, O.P and Dwary, B.D (1990). Pressure dependence of thermodynamic properties of NaBr, NaI and AgCl. Pramana-J.Phys. 35(3): 567-577. |
| [3] | Lone B.G, Undre P.B, Patil, S.S, Khirade P.W &Mehrotra S.C (2008). Dielectric Study of Methanol- Ethanol Mixtures using TDR method. J. Molecular Liquids141; 47-53. |
| [4] | Mianmian H (2011). Dielectric properties of Ionic Liquids. A Dissertation Submitted to the Faculty of Chemistry and Biochemistry, Ruhr University Bochum. |
| [5] | Petong, P, Pottel, R and Kaatze, U (1999). Dielectric Relaxation of H- Bonded liquids. Mixtures of Ethanol and n-Hexanol at Different compositions and Temperatures. J. Phys. Chem. A1999, 103: 6114-6121. |
| [6] | Gregory, A.P and Clarke, R.N (2012). Tables of the Complex Permittivity of Dielectric Reference Liquids at Frequencies up to 5GHz. NPL REPORT MAT 23. |
| [7] | Kuang, W and Nelson, S.O (1997). Dielectric Relaxation Characteristics of Fresh Fruits and Vegetables from 3 to 20GHz. J. of Microwave Power and Electromagnetic Energy. 32(2): 114-122. |
| [8] | Ahmad, M.M and Yamada, K (2007). Superionic PbSnF4: A giant dielectric constant material, Appl. Phys. Lett. 19(5): 052912-3. |
| [9] | Karmakar, A, Mitra, U.K, Dutta, K, Sit, S.K & Acharyya, S (2006). Dielectric relaxation Phenomena of some aprotic polar liquids under gigahertz electric field. Indian J. of Pure & Appl. Phys. 44: 856-866. |
| [10] | Salman, F, Khalil, R and Hazaa, H (2014). Dielectric Studies and Cole-Cole plot Analysis of Silver-ion conducting glasses. Adv. J. Phys. Sc. 3(1): 1-9. |
| [11] | Bergo, P, Pontuschka, W.M and Prison, J.M (2007). Dielectric Properties of  glasses containing glasses containing  . Solid State Communicaions. 141(10): 545-547. . Solid State Communicaions. 141(10): 545-547. |
| [12] | Graca, M, Valente, M.A, Ferreira da Silva, M.G (2003). Electrical Properties of lithium niobium silicate glasses. J. Non-Cryst. Solids. 325(1-3):267-274. |
 Abstract
 Reference
 Full-Text PDF
 Full-text HTML