-
Paper Information
- Paper Submission
-
Journal Information
- About This Journal
- Editorial Board
- Current Issue
- Archive
- Author Guidelines
- Contact Us
American Journal of Condensed Matter Physics
p-ISSN: 2163-1115 e-ISSN: 2163-1123
2015; 5(1): 10-18
doi:10.5923/j.ajcmp.20150501.02
Praseodymium Ion Doped Sodium Borosilicate Glasses: Energy Interaction and Radiative Properties
 Abstract
 Reference
 Full-Text PDF
 Full-text HTML
Y. K. Sharma, R. K. Singh, Sudha Pal
Department of Physics, S.B.S. Govt. Post Graduate College, Rudrapur, India
Correspondence to: Y. K. Sharma, Department of Physics, S.B.S. Govt. Post Graduate College, Rudrapur, India.
| Email: |  |
Copyright © 2015 Scientific & Academic Publishing. All Rights Reserved.
Sodium borosilicate glasses of the final composition (in wt.%) 68.94 SiO2 -22.55 Na2O- 1.91 CaO -4.96 K2O – 0.85 B2O3 -0.29 As2O3- x Pr6O11 (where x = 0.1,0.3 and 0.5) have been prepared by melt quenching technique. The absorption and fluorescence spectra have been recorded at room temperature. Energy interaction parameters i.e. Slater-Condon, Racah, Nephelauxetic ratio (β′) and bonding parameters (b1/2) have been computed from observed energy band to study the nature of bonding in doped glasses. The intensities of the 4f↔4f transitions in the absorption spectra have been analyzed by the Judd-Ofelt theory. Using the fluorescence data and JO parameters, various radiative properties for different emission lines have been computed. The values of A, β and σp for 3Po →3H4 and 3Po→3F2 transition are maximum, suggesting that they can be used as a most probable laser transitions. The values of σp for the transition 3Po→3F2 is high due to the presence of As2O3 in glass.
Keywords: Sodium borosilicate glass, Absorption spectrum, Fluorescence Spectrum, Energy Parameters, Judd-Ofelt Parameters and Radiative Properties
Cite this paper: Y. K. Sharma, R. K. Singh, Sudha Pal, Praseodymium Ion Doped Sodium Borosilicate Glasses: Energy Interaction and Radiative Properties, American Journal of Condensed Matter Physics, Vol. 5 No. 1, 2015, pp. 10-18. doi: 10.5923/j.ajcmp.20150501.02.
Article Outline
1. Introduction
- Spectral studies of rare-earth ions in glass systems are of considerable interest [1] due to their potential applications in lasing materials, fiber optics materials and wavelength converting devices. The laser potential can be evaluated from small sample by obtaining related information, such as covalence of doped ions, radiative and non-radiative properties, branching ratios and stimulated emission cross section. It is possible to improve the laser transitions of the ionic level by the proper choice of the host materials. In recent years [2], much attention has been focused on the search for new rare earth doped materials to be used as hosts for optical devices. Rare earth doped heavy metal fluoride glasses are transparent from ultraviolet to the infrared region. They can be easily prepared and a range of concentration of transition metal and rare earth ions can be incorporated into the glass. Fluoride [3-5] glasses have smaller multiphonon emission rates and are chemically stable. They are also stable against atmospheric moisture [4, 6-8]. Praseodymium ion is considered to be serious contender for laser applications due to its large number of available transitions in the UV, visible and NIR regions. Laser action in praseodymium doped crystalline hosts has been demonstrated [9, 10].In this paper, a new kind of praseodymium doped sodium borosilicate glasses has been prepared. The spectral analysis of praseodymium doped sodium borosilicate glasses has been investigated. From the observed absorption band Slater-Condon, Racah, nephelauxetic ratio and bonding parameters have been computed to study the nature of bonding in doped glasses. Judd-Ofelt theory has been applied for the f ↔ f transitions of praseodymium ions to evaluate Judd – Ofelt intensity parameters, Ωλ (λ = 2,4,6), which in turn have been used to calculate various radiative properties like, spontaneous transition probability (A), fluorescence branching ratio (β), radiative life time (τ) of various excited states and stimulated emission cross - section (σp) of various emission lines.
2. Experimental Procedure
- Sodium borosilicate glasses of the final composition (in wt.%) 68.94 SiO2-22.55 Na2O - 1.91 CaO - 4.96 K2O – 0.85 B2O3 - 0.29 As2O3 - x Pr6O11 (where x = 0.1,0.3 and 0.5) have been prepared by the melt quenching technique [11] from reagents of analytical grade in 10 g batches. The rare-earth oxides (99.99% pure) were obtained from the Indian Rare Earth Ltd. Batches containing 0.0, 0.1, 0.3 and 0.5 mol.% of Pr3+ in the base glass materials were mixed in an agate pestle mortar for two hours and were thermally treated for 6 h in an alumina crucible up to 950±25C. Homogeneity of the melt was ensured by stirring the melt with an alumina rod from time to time. The melt was quenched by pouring it into a rectangular shaped brass mould placed on a pre heated (200C) heavy copper plate. The glass specimens so prepared were taken away after 24 h and annealed for three hours at 300C so as to remove stresses and to give them thermal stability and strength. Samples of the size 15 x 10 x 1.5 mm3 were cut and polished on all sides to make the faces flat and parallel. The initial and final polishing of the samples was done with the help of fine powder of cerium oxide. These samples were again annealed at 250C for further removing mechanical stresses developed during polishing. The glass samples so prepared were of good optical quality and were transparent. X-ray diffractogram of the glass sample was studied with “RIGAKU X-ray diffractometer Geigerflex D/max-B” system. The X-ray diffractogram showed no prominent peaks indicating the absence of a crystalline phase (Fig.1).
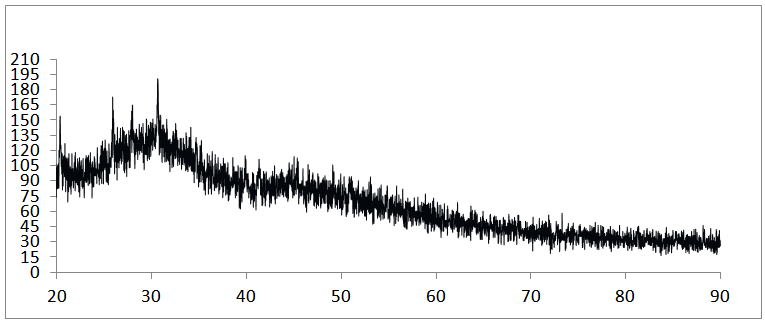 | Figure 1. XRD of sodium borosilicate glass specimen |
3. Results and Discussion
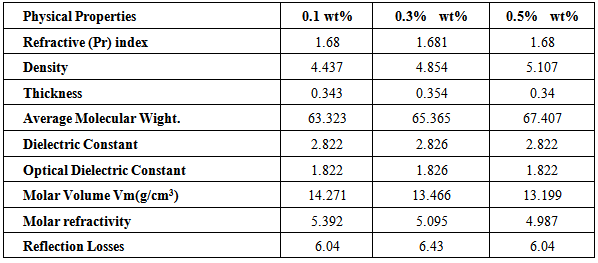
- Physical Properties:Various physical properties of praseodymium doped sodium borosilicate glasses for different concentration were measured and collected in table 1. Density and average molecular weight increases with increasing concentration of praseodymium ion. The relation of Refractive index, Dielectric constant, Optical dielectric constant and Reflection losses for different concentration of praseodymium ion is 0.1 wt.% = 0.5 wt.% < 0.3 wt.% in Table 1.
|
 | Figure 2(a). Absorption spectrum of Pr3+ (0.5wt%) doped sodium borosilicate glass in the range 350 to 700nm |
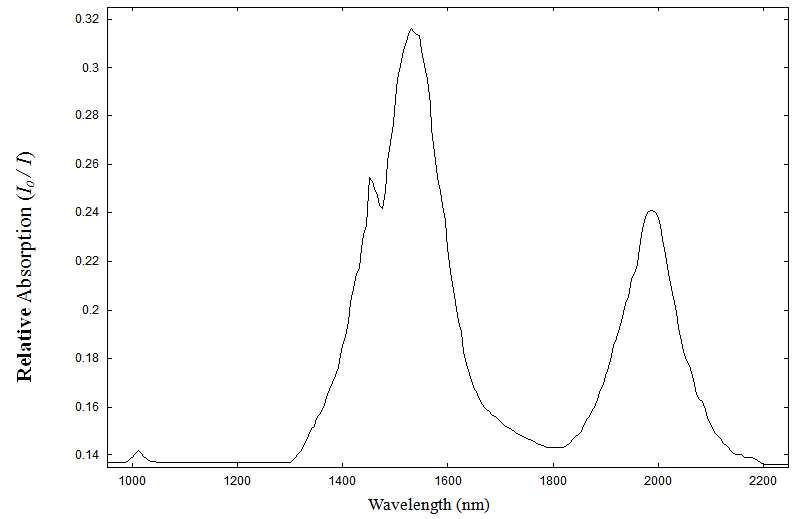 | Figure 2(b). Absorption spectrum of Pr3+(0.5 wt%) doped sodium borosilicate glass in the range 1000 to 2200nm at room temperature |
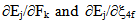
 f can be expanded as a Taylor series expansion for a small variation of the energies. In the first order approximation the energy Ej of the jth level is given [13, 14] by
 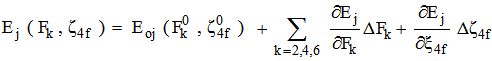 | (1) |
 for the observed levels of Pr3+ calculated by Wong [13, 14] and collected in Table 2. The values of
  have been computed using Eq.1 by partial regression method. The values of
  are then evaluated using equations
 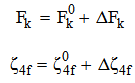 | (2) |
 are zero order values of corresponding parameters.
|
 | (3) |
 | (4) |
 | (5) |
 | (6) |
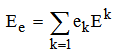
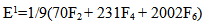
 parameters. The root mean square (r m s) deviation (σ) between calculated (Ecal) and experimental (Eexp) energies of the levels has been calculated which is defined by
 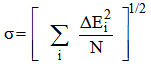 | (7) |
 | (8) |
 is less than one, it indicates covalent bonding, while greater than one indicates ionic bonding. Henrie and Choppin [24] have defined another bonding parameter b1/2 in terms of
  , given by
 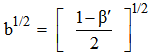 | (9) |
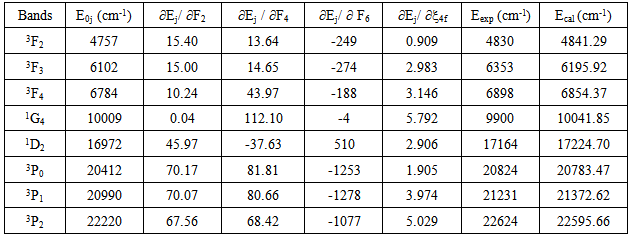
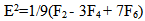
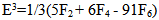
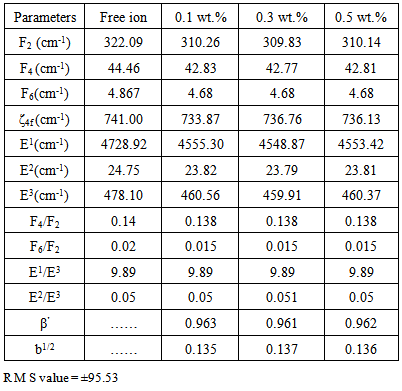
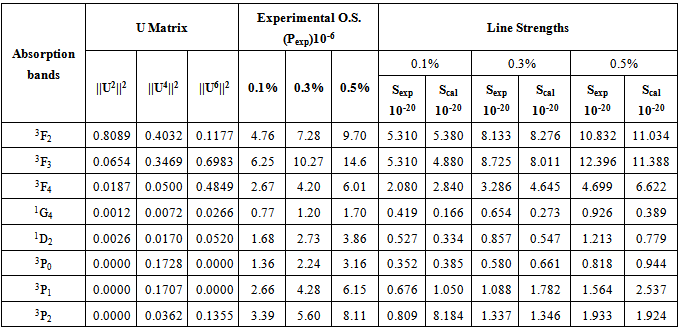
 parameters have been computed by using eqs.1-7 the observed energies of the bands, the values of zero order energies (E0j) and partial derivatives by the help of partial regression and least square method. The partial derivatives for praseodymium ion and observed energy of absorption band with their assignment have been collected in Table 2.Zero order parametersF2 = 305.0 cm-1, F4 =51.88 cm-1, F6 = 5.321 cm-1, ξ4f = 730.5 cm-1.The values of Fk, Ek and
  parameters have been collected in Table 3. In the present glass specimens, the relation among different Fk parameters found as F2 > F4 > F6. It is interesting to note that the observed values of F4/F2 ~ 0.138 and F6/F2 ~ 0.015 are nearly same as calculated considering radial eigen function to be hydrogenic (F4/F2 ~ 0.14 and F6/F2 ~ 0.015) [26]. The Ek parameters have been given in Table 3, deduced from Fk parameters. The ratio of E1/E3 and E2/E3 are about 9.890 and 0.052 respectively, which are almost equal to the hydrogenic ratio. The values of nephlauxetic ratio (β′) and bonding parameter (b1/2) are 0.964 and 0.133 respectively (Table 3). The values of
  and b1/2 is indicating covalent bonding. R.M.S deviation (σ) values is ±95.53. It’s indicating that energies are justifying Taylor series expansion.
|
 | (10) |
 | (11) |
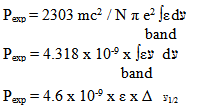
 is half band width. However, for a solid material it is generally expressed in terms of line strength Sexp which is related to oscillator strength Pexp by
  | (12) |
 is the average energy of the transition in cm-1, J is the total angular momentum of the initial level, the factor ( n2 + 2 )2 / 9 represents the local field correction for an ion embeded in a dielectric medium of refractive index, n, under the tight binding approximation and the other symbols have their usual meaning. The oscillator strength, Pexp, of these transitions may be due to electric dipole, magnetic dipole or electric quadrupole or contribution from more than one of these modes. Thus the oscillator strength of the observed absorption band is given by
 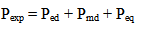 | (13) |
 Similar selection rules are followed by electric quadrupole transitions. Since both these modes have very small values of oscillator strength, it is clear that the contribution is mainly from electric dipole mode. However, for true electric dipole transitions the initial and final levels should have different parity, whereas no parity change is involved in f-f transitions. Hence for f-f transitions, though electric dipole transitions are forbidden, both magnetic dipole and electric quadruple transitions are allowed ones. Considering the observed intensities of these bands it is proposed that the induced electric dipole transitions may be operative.The basic idea of Judd – Ofelt theory is that the intensity of the forbidden f-f electric dipole transition can arise from the admixture of opposite parity configuration into the 4fn configuration, thus relaxing the parity restricted selection rule. The odd part of the crystal field potential is considered as a perturbation for mixing states of different parity into the 4fN configuration. In simple form the line strength (Scal) of an electric dipole transition between initial J manifold
 and terminal J′ manifold
 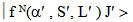 is given by
 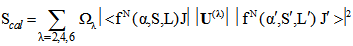 | (14) |
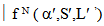
 are the basis states in the LS coupling scheme and α represents an extra quantum number that might be necessary to describe the states completely, U(λ) are the unit tensor operators of rank
  which are doubly reduced to yield the matrix elements
  in the intermediate coupling [29], and Ωλ are the phenomenological Judd - Ofelt intensity parameters which specify the electric dipole moment between any two electronic levels and contain implicitily the odd symmetric crystal field terms, radial integrals, and perturbation denominators. An attempt has been made by Quimby and Miniscalco [30] to further modify the theory, though the basic consideration remains the same.In order to test the validity of Judd-Ofelt approach, employed to interpret the spectral intensities, a reduced chi –square test between Sexp and Scal values has been performed. The reduced chi –square is given [31] by
 | (15) |
|
|
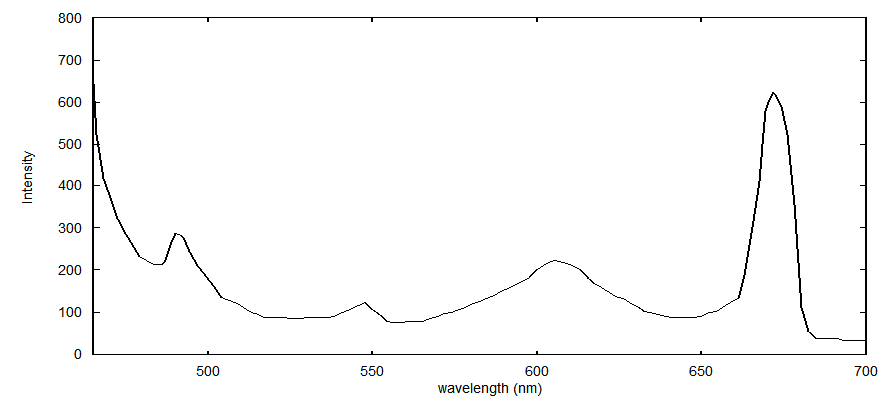 | Figure 3. Fluorescence spectrum of Pr3+ (0.5 wt%) doped sodium borosilicate glass specimen and excitation wavelength 445 nm |
|
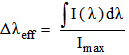
4. Radiative Properties
- The radiative properties of rare earth ions have been theoretically studied by Krupke [38] and Jacob and Weber [39] in relation to Judd - Ofelt intensity parameters in absorption spectra and fluorescence spectra. These properties are often called laser parameters.Spontaneous emission probability (A)The spontaneous emission probability from an initial manifold
 to a terminal manifold
 is given by
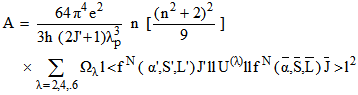 | (16) |
 is defined as
  | (17) |
 . It is given by
  | (18) |
 to a terminal J manifold
  , having a probability A is expressed as
 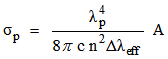 | (19) |
 | (20) |
5. Conclusions
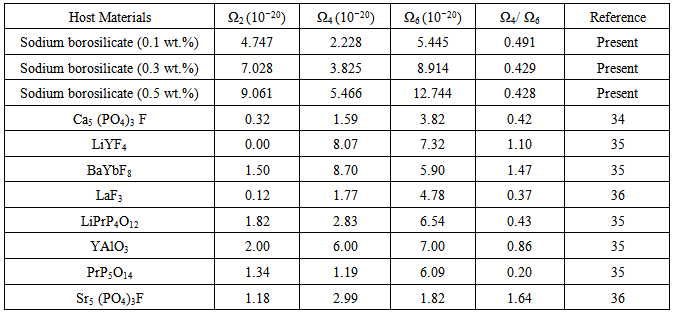
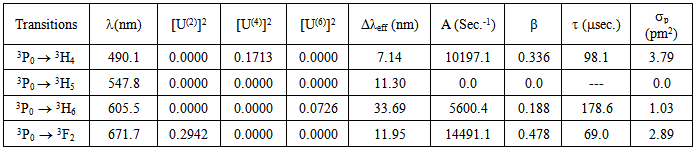
- In this paper we have calculated various physical properties of sodium borosilicate glass with different concentrations. The absorption spectra of Pr3+ ions doped glasses have been analyzed on the basis of energy interaction and Judd-Ofelt theory. Eight absorption bands have been observed in the visible and IR region. The relation among different Slater –Condon (Fk) parameters found as F2 > F4 > F6. It is interesting to note that the observed values of F4/F2 ~ 0.138 and F6/F2 ~ 0.015 are nearly same as calculated considering radial eigen function to be hydrogenic. Racah (Ek ) parameters deduced from Fk parameters. The values of nephlauxetic ratio () and bonding parameter (b1/2) are less than 1. This suggest that the values of and b1/2 is covalent bonding. R.M.S deviation () values is ±95.53. It is justifying Taylor series expansion. Judd-Ofelt parameter increases on increasing concentration of Pr3+ ion. The trends of Ωλ parameters is found to be Ω2 > Ω4 < Ω6. Ω4 and Ω6 are structure dependent parameters. Spectroscopic quality factor (Ω4 / Ω6) in the present glass is 0.429. Compare the values of Ω4/ Ω6 with reported laser crystals and found results in between. This indicates that the present glass is fairly rigid. They are more stable and rigid as compared to florophosphate and tellurites glasses. The low value of the goodness of fit (0.17) shows the applicability of Judd-Ofelt theory. The values of A, β, τ and σp computed for the transitions 3Po → 3H4, 3Po → 3H6 and 3Po → 3F2 . The values of A, β and p for 3Po → 3H4 and 3Po→3F2 transition are maximum, suggesting that they can be used as a most probable laser transitions. The values of p for the transition 3Po→3F2 is high due to the presence of As2O3 in glass. In the present glass system Pr3+ gets surrounded by [AsO4]3- in the second coordination sphere. Since the negative charge of [AsO4]3- tetrahedral is not properly compensated by the positive charge of alkali ion, [AsO4]3- tetrahedral provide a fluorine type structure in the glass network thereby decreasing the covalent character between the Pr3+ and oxygen atoms provided by [SiO4] tetrahedra. With the decrease in covalency, 6 parameter increases because of the inverse relationship between the two and as a consequence of it, σp for the transition 3Po→3F2 increases.
ACKNOWLEDGMENTS
- The authors are thankful to Director, Laser Science and Technology Center, Metcalfe House, Delhi for providing laboratory facilities for recording the spectra. Thanks are also due to Director, U-COST, Govt. of Uttarakhand, Dehradun and UGC, New Delhi for financial support to Y.K.S.