-
Paper Information
- Paper Submission
-
Journal Information
- About This Journal
- Editorial Board
- Current Issue
- Archive
- Author Guidelines
- Contact Us
American Journal of Condensed Matter Physics
p-ISSN: 2163-1115 e-ISSN: 2163-1123
2013; 3(5): 151-162
doi:10.5923/j.ajcmp.20130305.06
First Principles Study of Structural, Electronic and Optical Properties of the Fluoroperovskite RbCaF3 Crystal
 Abstract
 Reference
 Full-Text PDF
 Full-text HTML
Ahmad. A. Mousa1, Jamil M. Khalifeh2, Nada T. Mahmoud2, Hassan K. Juwhari2
1Middle East University, 11831- Amman, P.O. Box 383, Jordan
2Physics Department, The University of Jordan, 11942-Amman, Jordan
Correspondence to: Ahmad. A. Mousa, Middle East University, 11831- Amman, P.O. Box 383, Jordan.
| Email: |  |
Copyright © 2012 Scientific & Academic Publishing. All Rights Reserved.
The structural, electronic, and optical properties of crystalline fluoroperovskites RbCaF3 were investigated using full potential linearized augmented plane wave (FP-LAPW) method with the generalized gradient approximation (WC-GGA), generalized gradient approximation (PBE-GGA), and the local density approximation (LDA).A detailed comparison between pre-existing calculated values, experimental measurements, and results obtained from previous theoretical studies is provided. The contribution of the electronic states to simplify the optical properties is discussed. In these calculations, it is shown that this structure has indirect energy band-gap (M-Γ). A theoretical study of the high hydrostatic pressure dependence of the electronic properties of the fluoroperovskites RbCaF3 is also presented here. The dielectric function, the refractive index, the absorption coefficient, and the reflectivity are calculated and presented as well.
Keywords: The Fluoroperovskite, DFT, GGA, Optical Properties, Band Gap
Cite this paper: Ahmad. A. Mousa, Jamil M. Khalifeh, Nada T. Mahmoud, Hassan K. Juwhari, First Principles Study of Structural, Electronic and Optical Properties of the Fluoroperovskite RbCaF3 Crystal, American Journal of Condensed Matter Physics, Vol. 3 No. 5, 2013, pp. 151-162. doi: 10.5923/j.ajcmp.20130305.06.
Article Outline
1. Introduction
- The prototype compound of the perovskite structure is XIICa2+ VITi4+ O2-3. The structure is cubic, space group
 with one formula unit per unit cell. It is very clear that the two cations are of different covalencies and sizes with the oxygen ions bonding to both. The perovskite structure like many other structures is extremely tolerant of many types of ionic substitution with only requirement that the local charge balance be maintained[1,2]. In the present work, the fluoroperovskite is derived by replacing the O2- ions by the F- ions. The unbalanced negative charge is compensated by completely replacing all of the smaller 12 coordinated Ca and larger 6 coordinated Ti cations by the mono- and divalent Rb and Ca cations, respectively[3].Compounds with this structure have received recently increased attention from the scientific community because of their relatively simple crystal structure accompanied by astonishing desired physical properties. Perovskite materials exhibit many interesting and intriguing properties from both the theoretical and application point of view including Colossal magnetoresistance, ferroelectricity,superconductivity, charge ordering, spin dependent transport, high thermo-power and the interplay of structural, magnetic and transport properties that are commonly observed in this family. These compounds are frequently utilized as sensors and catalyst electrodes in certain types of fuel cells, candidates for memory devices and spintronics applications, and a multitude of dielectric properties which are of great importance in the microelectronics and telecommunication industries[4-6].The compound can be synthesized, as proposed by Bouamrane et al[7], by mixing alkali metal and alkaline earth metals with fluorine through the following reaction:
 Another method, proposed by Ludekens et al[8], includes mixing metal halide with alkaline metal oxides as summarized by the following equation:
 Where A and B are the alkali metals and alkaline earth metals, respectively.The wide-band-gap fluorides are one of the most promising candidates. They offer the possibility of being alloyed to form complex materials with lattice-matched crystal structures and wide band gaps, hence allowing for band-gap engineering and lattice matching[3]. As the growth of high-quality bulk fluoride crystals has been successfully demonstrated in LiCaAlF6, KMgF3, and LiBaF3[9-11], it is only reasonable to extend an investigation to explore the possibilities of actual band structure design with the appropriate lattice-matched substrate selection using ab initio calculations within the local density approximation (LDA)[3].This paper is organized in four sections. Section 2 is devoted to the method of calculation, section 3 deals with the results and discussion, and in section 4 we present the conclusion.
 2. Computational Method
- We performed a total energy calculation for the fluoroperovskite, RbCaF3, cubic structure which contains only one molecule composed of four atoms in its unit cell. The Rb, Ca and F atoms are positioned at 1a (0, 0, 0), 1b (½, ½, ½) and 3c (0, ½, ½) sites of Wyckoff coordinates, respectively. Figures 1 (a and b) show a unit cell and the first Brillouin zone of RbCaF3, respectively.
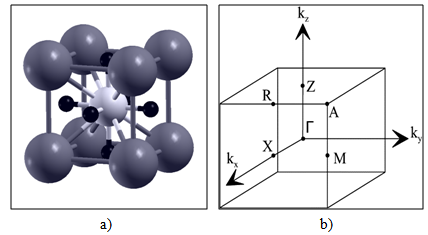 | Figure 1. a) Crystal structures of RbCaF3 (Rb: dark gray, Ca: gray and F: black). b) Brillouin zone of a simple cubic lattice |
 | (1) |
 | (2) |
 | (3) |
 | (4) |
 | (5) |
 | (6) |
3. Results and Discussions
3.1. Structural Properties
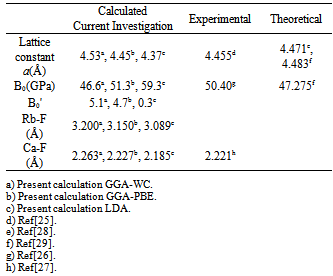
- In this subsection we aim to calculate the total energy as a function of unit-cell lattice parameter around the equilibrium cell lattice parameter a0. In Figure 2, we presented the relation between the energy change and the lattice parameter a0. The calculated total energies versus lattice parameter were fitted using Murnaghan’s equation of state[17] to determine the other different important structural and ground state properties such as the bulk modulus B0, the pressure derivative B'o of the bulk modulus, and bond lengths. The calculated ground-state parameters (a0, B0, and B`) for crystalline RbCaF3 are listed in Table 1 along with previous theoretical[25-27] and experimental values[28, 29].
|
3.2. Electronic Properties
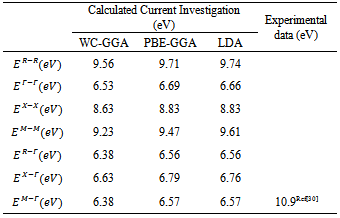
- The band structure of the fluoroperovskite, RbCaF3, is predicted along the high symmetry directions in the first Brillouin zone, as shown in Figure 1.b, where symmetry points are Γ (0, 0, 0), X (1, 0, 0), M (1, 1, 0) and R (1, 1, 1).We calculated the band structure along these high symmetrical directions in the first Brillouin zone at the calculated equilibrium lattice parameter as shown in Figure 3. One can see that the valence band maximum lies at M symmetry point of the first Brillouin zone while the conduction band minimum lies at Γ symmetry point of first Brillouin zone, resulting in an indirect band gap (M- Γ).The calculated values of the band gap width (Eg) is 6.57 eV when using WC-GGA and LDA, but when using PBE-GGA the Eg is found = 6.38 eV. The previous experimental measurement for the Eg of RbCaF3 was 10.9 eV[30]. A quick comparison between our calculated Eg value and the previously published one (10.9 eV) shows that the experimental value is 40% higher using PBE-GGA, WC-GGA and LDA approximations. This discrepancy can be related to insufficient accuracy in reproducing both exchange – correlation energy and its charge derivative. To the authors’ best knowledge, the literature does not contain any theoretical results for Eg. Therefore, the calculated band gaps using PBE-GGA, WC-GGA and LDA are compared with the available experimental data and listed in Table 2.
|
3.3. Pressure Dependence of Band Gaps
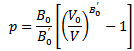
- In this subsection, we investigate the hydrostatic pressure effect on the energy gap and on the electronic properties of the semi-conductors. The pressure changes induced within the interatomic distances lead to changes in the covalent-bands charge-distributions and consequently affect all important parameters including the compounds’ energy gaps.The Murnaghan equation of state[17] was used to compress the unit cell. The variation of the lattice parameter with pressure is given by the equation:
 Where
Where  is the bulk modulus,
  is the unit cell volume at ambient pressure, and
  represents the derivative of
  with respect to pressure.
|
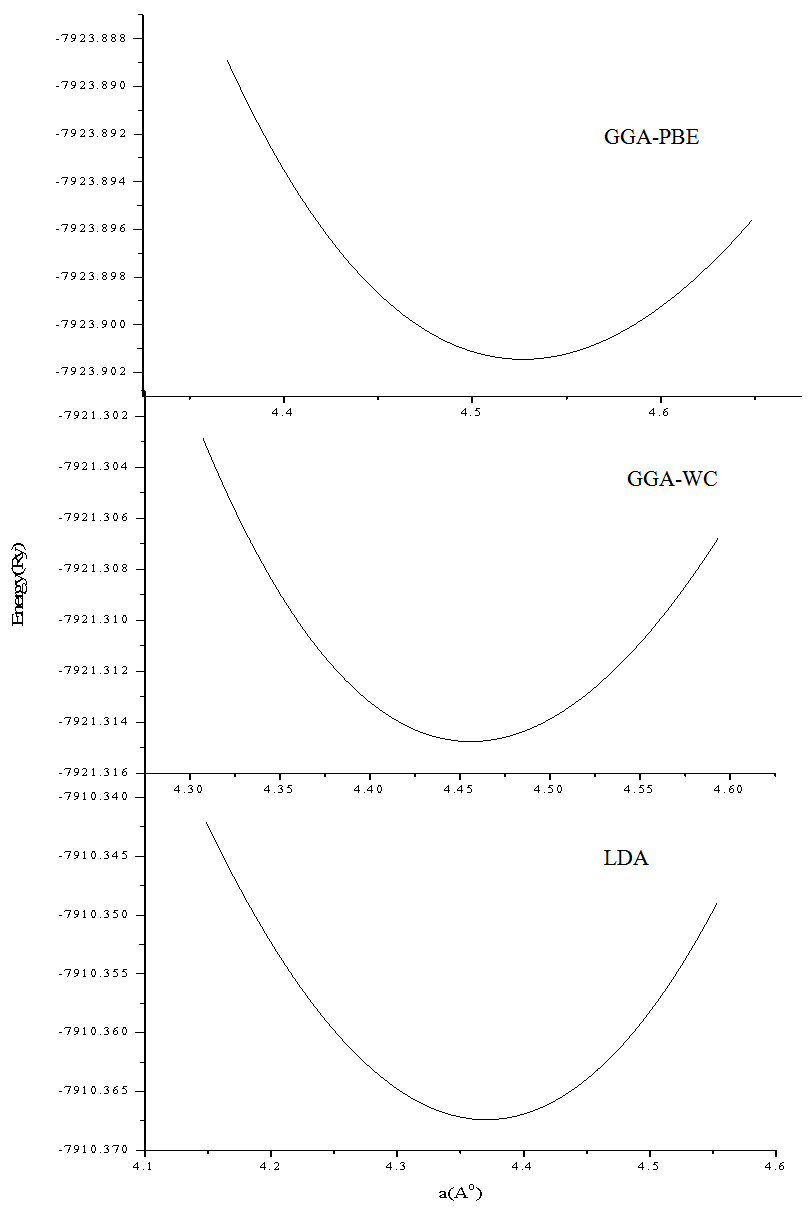 | Figure 2. Total energy per atom as a function of lattice parameters (fluoroperovskite RbCaF3 structure) |
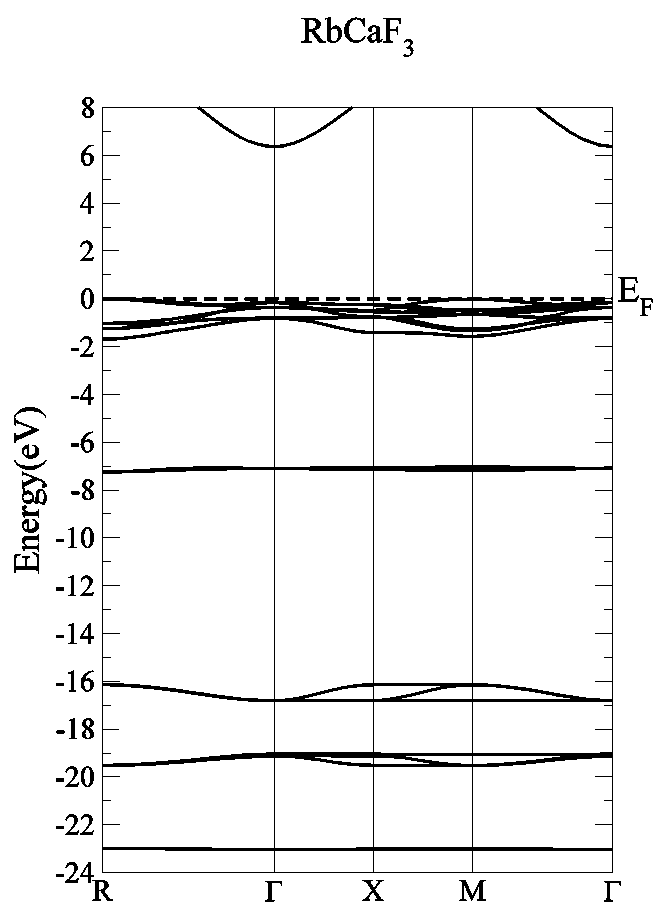 | Figure 3. Energy band structure of RbCaF3 |
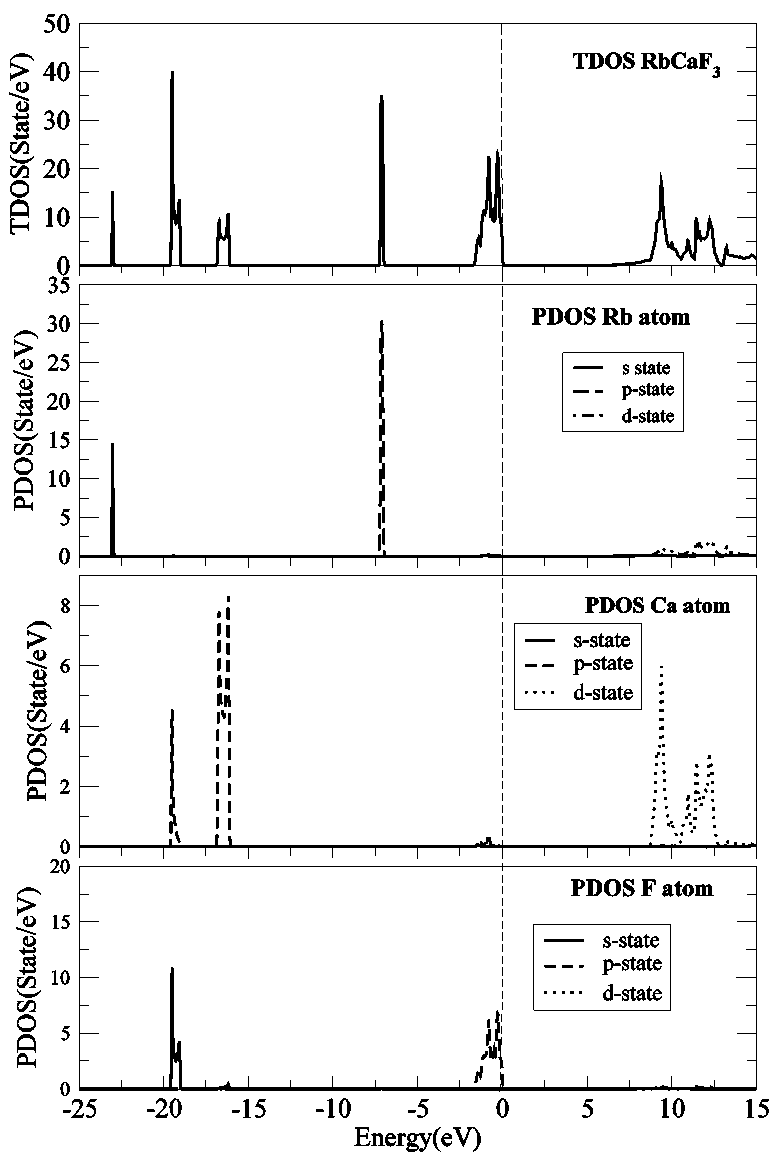 | Figure 4. Total and partial DOS of RbCaF3. The black, dashed and dotted lines refer to s-, p-, and d- states, respectively |
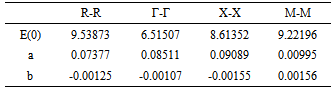
- The band energies at the symmetry points of RbCaF3 were investigated as a function of hydrostatic pressure from 0 to 15GPa. RbCaF3 band gap results based on the WC-GGA calculations versus pressure are shown in Figure 5. The data were fitted with the quadratic square fits to obtain the band gap pressure coefficients of the four main transitions. They are related by the expression:
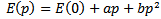 The calculated values of the above equation are summarized in Table 3. Similar results can be observed from Figure 5 and Table 3
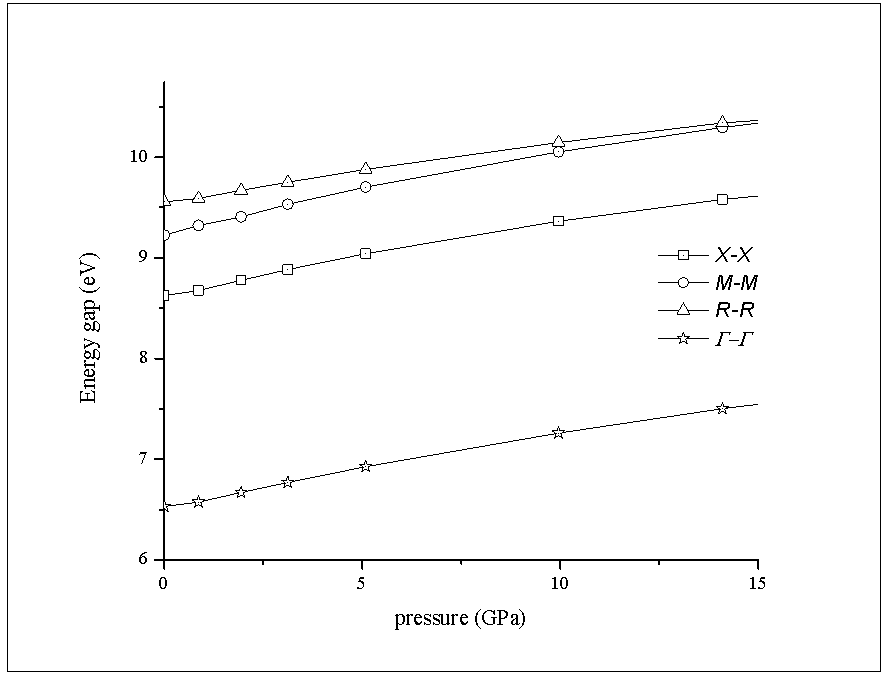
  : the linear dependence can be seen in the four curves across the considered range of pressure.Figure 6 displays the band gap energy variation of RbCaF3 as a function of pressure. Note that, based on the PBE-GGA calculations, as the pressure increases from 0 to 15 GPa, the band gap energy increases monotonically from 6.38 to 7.76 eV. Based on the relation:
 The band gap changes from indirect to a direct one at 14 GPa, therefore, the band gap for RbCaF3 becomes a direct at higher pressures (≥14GPa).
3.4. Optical Properties
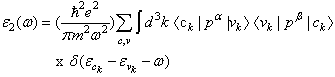
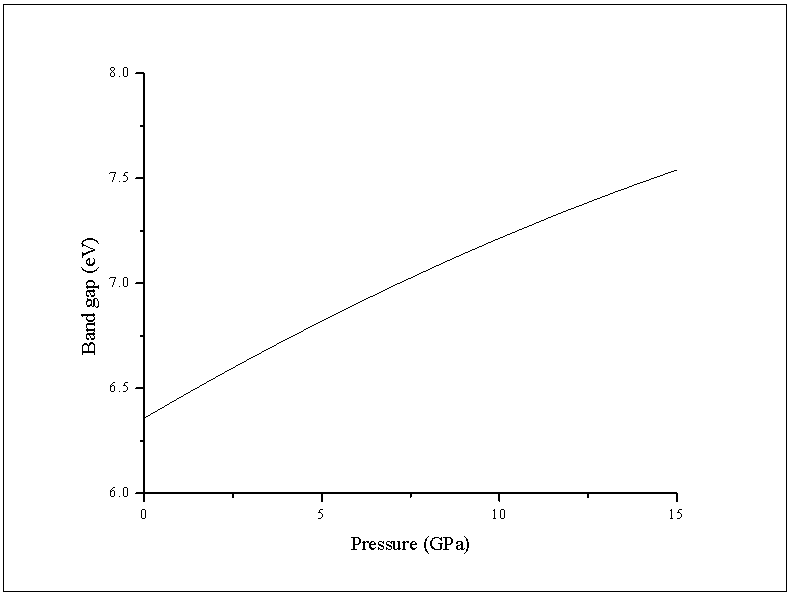
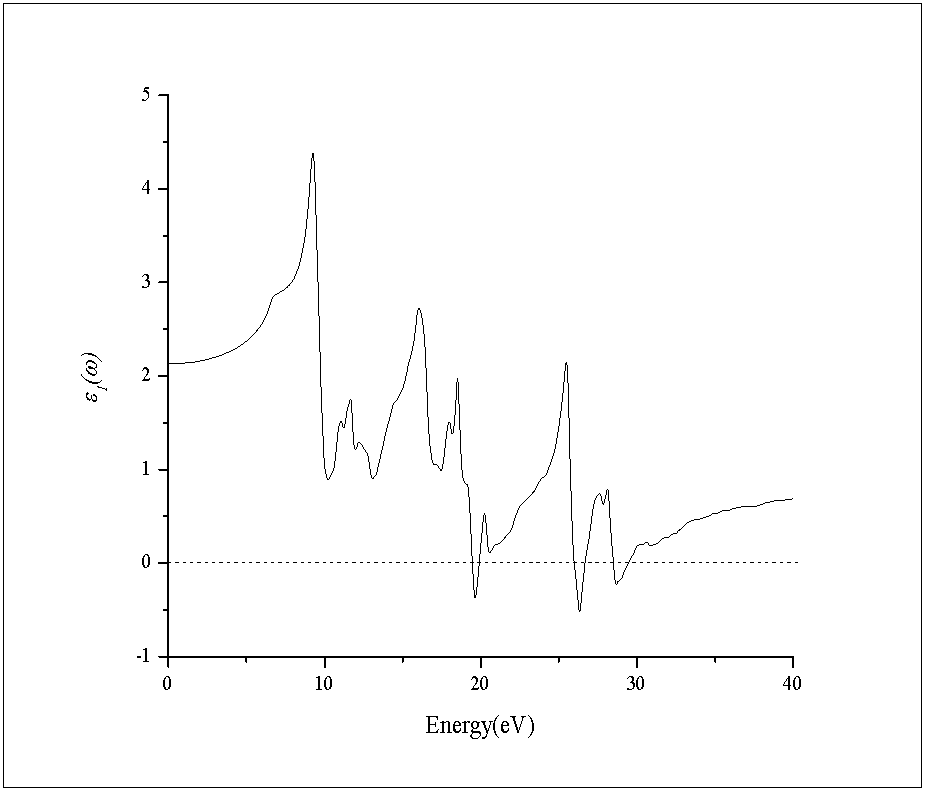
- In this subsection, the optical properties of RbCaF3 are presented. The calculated real and imaginary parts of the dielectric function of RbCaF3 at lattice constant equilibrium are shown in Figures 7 and 8.As shown in Figure 7, the threshold energy of the dielectric function occurs at about 6.21eV. This threshold is due to the electronic transitions between the highest valance band F-2p and the lowest conduction band Ca-3d. Beyond threshold point, the curve increases sharply due to the abruptly increase in the number of points contributing toward ε2(ω). The main peak in the spectrum is situated at 9.67eV. These peaks are dominated by transitions of electrons from the F-2p band and the small contribution of Ca-3p band just below Fermi energy to the unoccupied state of conduction band. Pursuant to the Kramers-Kronig dispersion relation, the real part ε1(ω) of dielectric function is displayed in Figure 8. The calculated static dielectric constant ε1(0) is at about 2.12, our calculated ε1(0) is more than the previous experimental measurement (1.90)[31] by 10%. The deviation of the calculated values from the experimental ones could be explained based on the temperature difference knowing that all theoretical calculations are done at 0K. The main peak is located at about 9.27 eV. The curve reflects an increase, then decrease, followed by an increase in ε1(ω) within the negative values; followed by a slow increase toward zero at high energy. The ε1(ω) have a minimum value around 26.33eV.
 | Figure 5. Calculated band gaps energy of RbCaF3 at high symmetry points under varying hydrostatic pressure |
 | Figure 6. Calculated indirect band gaps energy of RbCaF3 under varying hydrostatic pressure |
 | Figure 7. Calculated imaginary part ε2(ω) of the dielectric function ε(ω) |
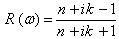
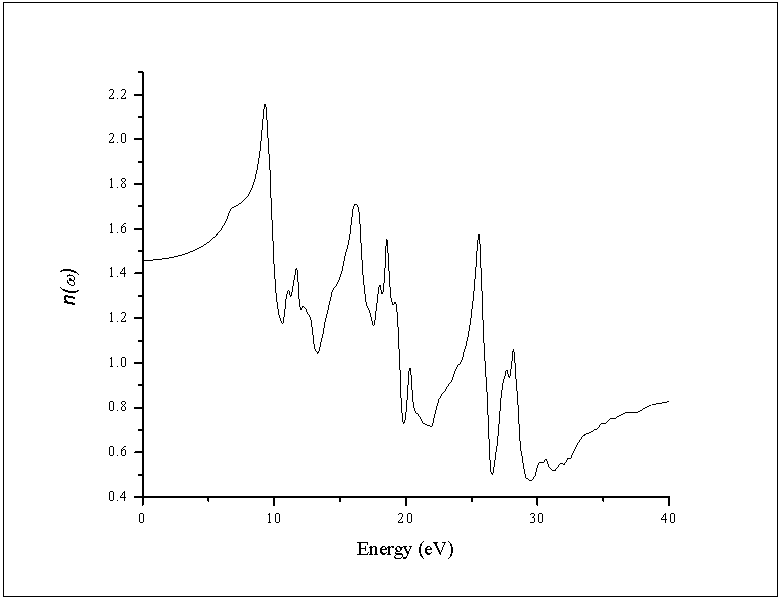
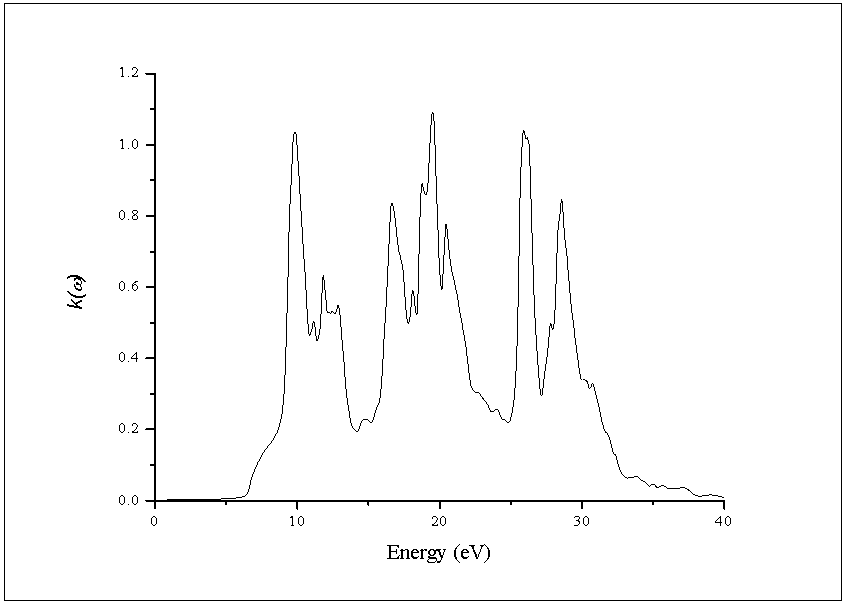
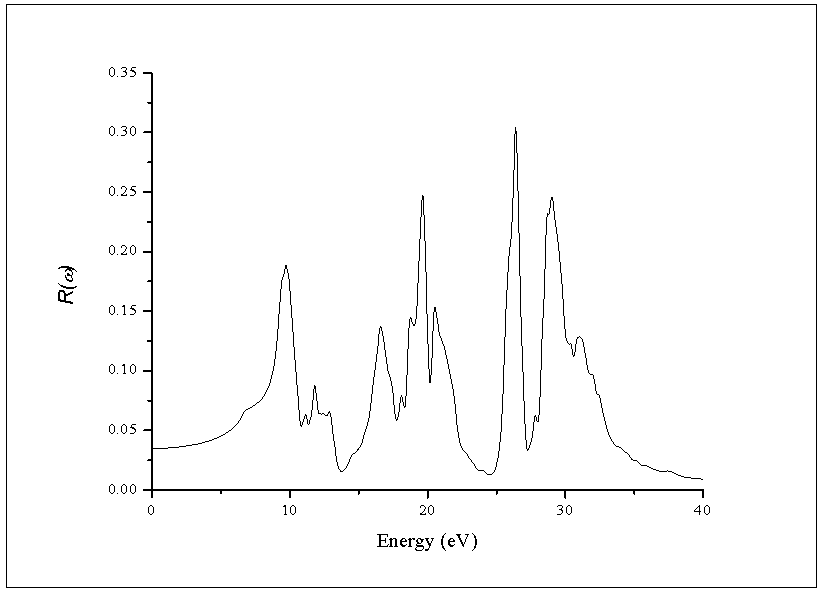
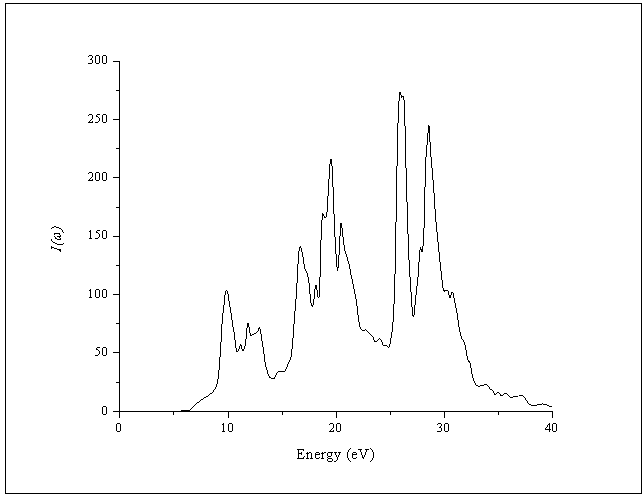
- The other optical properties including the refractive indices n(ω), the extinction coefficient k(ω), the absorption coefficient I(ω), and the reflectivity R(ω) are calculated using ε1(ω) and ε2(ω) from equations[4-7].The refractive index n(ω) is displayed in Figure 9 along xx-direction. The refractive index at zero energy is called the static refractive index and noted by n(0). The calculated n(0) is found to be 1.46. The refractive index reaches a maximum value of about 2.16 at 9.32 eV. The extinction coefficient k(ω) have been calculated as shown in Figure 10 along xx-direction. The local maxima of the k(ω) correspond to the zero of ε1(ω) equals 1.09 at 19.52eV.In Figure 11, we considered the reflectivity spectrum R(ω) along xx-direction. The zero frequency limits of the spectra R(0) is 3.05%. It stays below 10% up to 15 eV. However, at 9.7eV, the reflectivity spectrum has a local maximum of about 18%. It is created from the transition of the F-2p states of the valance band to the Ca-3d states of conduction band. This could be an indicative that the materials are highly transparent in the infrared, visible, and low frequency ultraviolet region of the energy spectrum. This is indicative that these materials could be of great interest as transparent coatings for efficient lenses. Beyond 15 eV, reflectivity increases with noticeable variations as it reaches a maximum value of 30.4% at 26.38 eV.The absorption coefficient I(ω) is investigated and presented in Figure 12. The maximum absorption coefficient is found close to 2.73% at 25.92eV. The studied materials show weak absorption. The calculated absorption and reflectivity coefficients in this investigation show an appreciable amount of isotropy at low and high energies.
 | Figure 8. Calculated real part ε1(ω) of the dielectric function ε(ω) |
 | Figure 9. Calculated refractive index n(ω) of the dielectric function ε(ω) |
 | Figure 10. Calculated extinction coefficient k(ω) of the dielectric function ε(ω) |
 | Figure 11. Calculated absorption coefficient I(ω) of the dielectric function ε(ω) |
 | Figure 12. Calculated reflectivity coefficient R(ω) of the dielectric function ε(ω) |
4. Conclusions
- The structural, electronic and optical properties of the RbCaF3 are studied using the FP-LAPW method based on the density functional theory with three different approximations for the calculation of exchange-correlation energy functional; WC-GGA, PBE-GGA and LDA. The lattice constants and the bulk modulus are found to compare well with the available previous study. Our calculations show that the RbCaF3 structure has an indirect energy band-gap at the Γ-M points in the Brillouin zoon. The relation between the energy gap and pressure based on this study is found linear, especially in the range 0-15GPa. The calculations conducted in this study revealed that the indirect gap of the RbCaF3 structure transforms to a direct gap at 14 GPa. The real ε1(ω) and the imaginary ε2(ω) parts of the dielectric function is calculated. The calculated projected DOS and band structure were used to analyze the optical transitions. Finally, the refractive index n(ω), the extinction coefficient k(ω), the absorption coefficient I(ω), and the reflectivity R(ω) have also been calculated and presented.