O. P. Nautiyal 1, S. C. Bhatt 2
1Uttarakhand Science Education and Research Centre (U-SERC), 33-Vasant Vihar, Phase-II, Dehradun, 248006, India
2Department of Physics, H N B Garhwal University Srinagar, Uttarakhand, 246174, India
Correspondence to: O. P. Nautiyal , Uttarakhand Science Education and Research Centre (U-SERC), 33-Vasant Vihar, Phase-II, Dehradun, 248006, India.
| Email: |  |
Copyright © 2012 Scientific & Academic Publishing. All Rights Reserved.
Abstract
Ceramic of Ag1-xKxNbO3 silver potassium niobate mixed solid solutions were sintered for K concentration range 0 ≤ x ≤ 0.7. The prepared samples show a perovskite structure and exhibit the orthorhombic symmetry at room temperature. The prepared samples have been characterized and average grain size of each composition has been calculated. It has been found that average grain size of all the prepared samples is in the nano range. Frequency dependent dielectric investigations, i.e., dielectric constant, loss tangent and electrical conductivity were carried out in the frequency range 10Hz-10MHz at room temperature.
Keywords:
Silver Potassium Niobate, Solid Solutions Ceramic, Dielectric Constant, Loss Tangent, Electrical Conductivity
Cite this paper:
O. P. Nautiyal , S. C. Bhatt , "Dielectric Properties of Ceramic Samples of Ag1-xKxNbO3", American Journal of Condensed Matter Physics, Vol. 1 No. 1, 2011, pp. 8-11. doi: 10.5923/j.ajcmp.20110101.02.
1. Introduction
A study of dielectric properties of solid gives a good insight in to the electric field distribution within them. By the study of dielectric constant, loss tangent and electric conductivity as a function of frequency and temperature, various polarization mechanisms in solids can be understood and the defect concentration can be estimated approximately. Silver niobate mixed systems is a member of the perovskite niobate. The perovskite compounds are of considerable technological importance, particularly with regard to physical properties such as pyro and piezoelectricity, dielectric susceptibility, linear and non-linear optic effects. Many of these properties are gross effects, varying enormously from one perovskite to another, and the differences in crystal structures are hardly apparent. The changes in physical properties are also remarkable when one system is mixed with another to form a composite system, like, NaNbO3 is antiferroelectric in wide range, but when mixed with a small amount, i.e., 2% (mole) of potassium, via solid solution technique with KNbO3, which is ferroelectric (with Tc = 435°C) at sodium site, NaNbO3 becomes ferroelectric [1]. Due to technological importance and potential silver niobate[2-4], sodium doped silver niobate[5-7], sodium doped potassium niobate[1], lithium doped silver niobate[8], holmium doped lithium niobate[9], potassium doped silver niobate[10,11] are studied by several research workers.The physical properties of silver potassium niobate are greatly affected by mixing and modifications in chemical compositions. The systematic investigation of these materals will be helpful in establishing the characteristics of high responsive and efficiencies for different technology uses. In view of its composition dependent properties, the authors have investigated the effect of concentration K in AgNbO3. The changes in physical properties are particularly large when the external conditions, such as, temperature, pressure, frequency, electric field etc. are altered. The dielectric constant shows strict temperature dependence with anomaly at transition temperature. Such effects occur in connection with the simultaneous presence of phase transition in the system, where the atomic structure of the perovskite changes, either discontinuously or continuously into another form.
2. Experimental Procedure
The raw materials used for preparing the composition of Ag1-xKxNbO3 system were silver oxide (Ag2O), potassium carbonate (K2CO3), and niobium pentaoxide (Nb2O5). K2CO3 is a hygroscopic material and hence due care was taken in its handling during the material formation. The starting materials were initially dried at 200 ºC for 2 h to remove the absorbed moisture and then quantities of the reagent required to prepare silver potassium niobate were weighed in stoichiometric proportion. The samples of present study were prepared by solid-state reaction method and sintering process as discussed in earlier study[10]. The sintered pellets were gold polished for characterization (SEM) and behavior using air-drying silver paste for dielectric measurements. X-ray diffraction pattern of all the samples at room temperature were obtained on a D-8 ADVANCE X-ray diffractometer made by Bruker, using Cu-Kα filter radiation of 1.540598 Å wavelength. The instrument is well calibrated with the silicon standard sample. The unit-cell parameters were determined using the WinPLOTR computer software, which includes and FULLPROF software. X-ray diffraction patterns (XRD) obtained for all prepared samples show characteristic lines corresponding to the orthorhombic along with some impurities. In order to study the surface structure and morphology of the sample, a high performance scanning electron microscope LEO-440 has been used. From Scanning Electron Micrographs (SEM), for different compositions, different grain sizes and porosity was observed[11]. The Solartron 1260 Impedance Gain Phase Analyzer (Made by Solartron Analytical – England) was used for precise measurements of resistance, capacitance and dissipation factor at room temperature. The Solartron 1260 Impedance Gain Phase Analyzer, which was connected with a computer, provides an auto function and auto ranging features. It allows fast and high precision measurements and diagnostic of passive components over a wide range.
3. Results and Discussion
X-ray diffraction patterns (XRD) and Scanning Electron Micrographs (SEM) for all prepared samples have been found similar to earlier study [10,11] and show characteristic lines corresponding to the orthorhombic along with some impurities at room temperature. Lattice parameters also reveal the structures of present systems. The grain of different sizes with orthorhombic shape grow in the prepared samples of Ag1-xKxNbO3 for x = 0, 0.3, 0.5 and 0.7. Smaller grains occupy the space between the bigger grains, and thus reducing the porosity. The average grain size of all the prepared samples has been found in the nano range. It has also been observed from table 1 that on increasing the concentration of potassium (K) in the Ag1-xKxNbO3, the average grain size decreased. Decrease in average grain size on increasing the potassium concentration is due to smaller size of potassium (K ) with comparison to silver (Ag).| Table 1. The average grain sizes of Ag1-xKxNbO3 for different x values at room temperature |
| | S. No | Compositions | Grain Size (nm) | | 1.2.3.4. | AgNbO3Ag0.7 K0.3 NbO3Ag0.5 K0.5 NbO3Ag0.3 K0.7 NbO3 | 5127358834153144 |
|
|
3.1. Dielectric Constant (K)
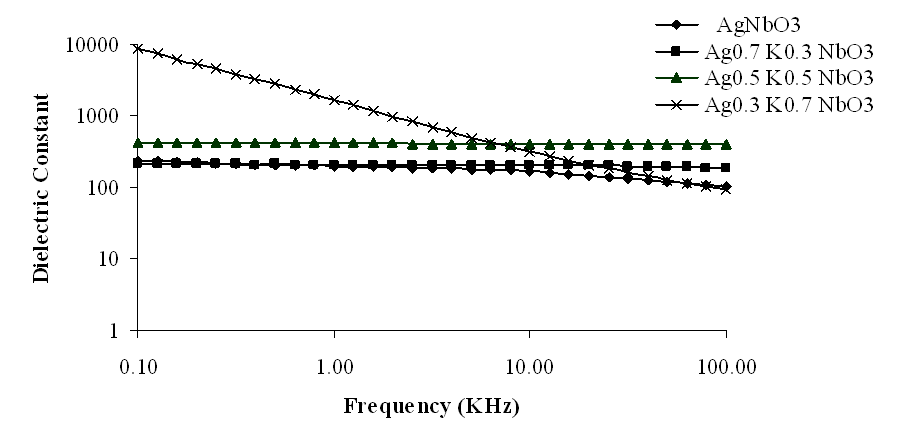
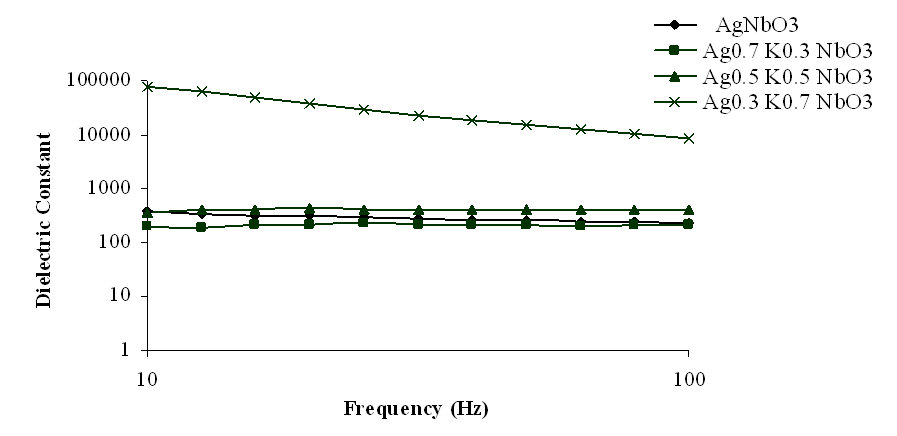
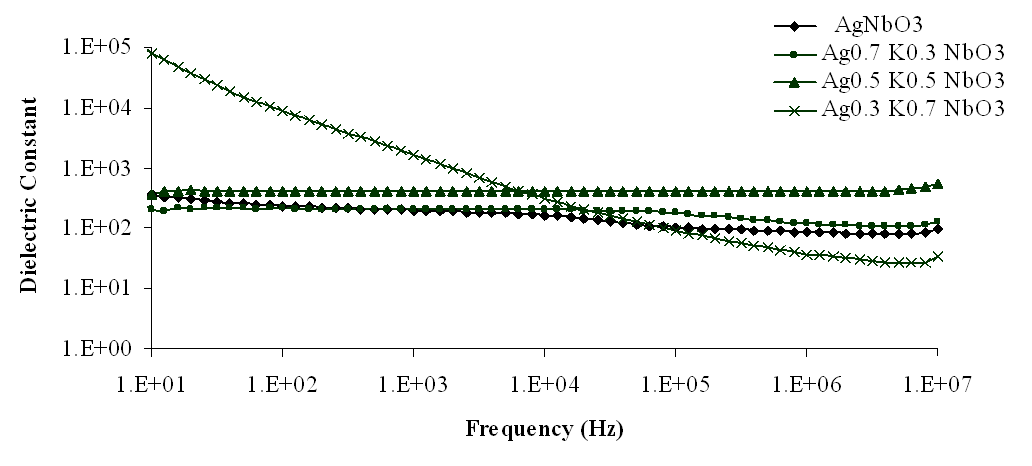
The variation of dielectric constant (K) with frequencies, at room temperature, for different compositions of Ag1-xKxNbO3 systems have been shown in Figs 1-4, in the different frequency ranges. From these figures, it has been observed that generally, the dielectric constant decreased with increasing frequency except at higher frequencies, i.e., at 6.5-10 MHz, where dielectric constant slightly increased. However, the magnitude of dielectric constant increased on increasing K contents in Ag1-xKxNbO3 except for x = 0.7, i.e., Ag0.3K0.7NbO3 who show the anomalous behavior, in the frequency range 0.10 MHz to 10 MHz, where it decreased. Decreasing nature of dielectric constant with increasing frequency may be due to the relaxation behavior of material.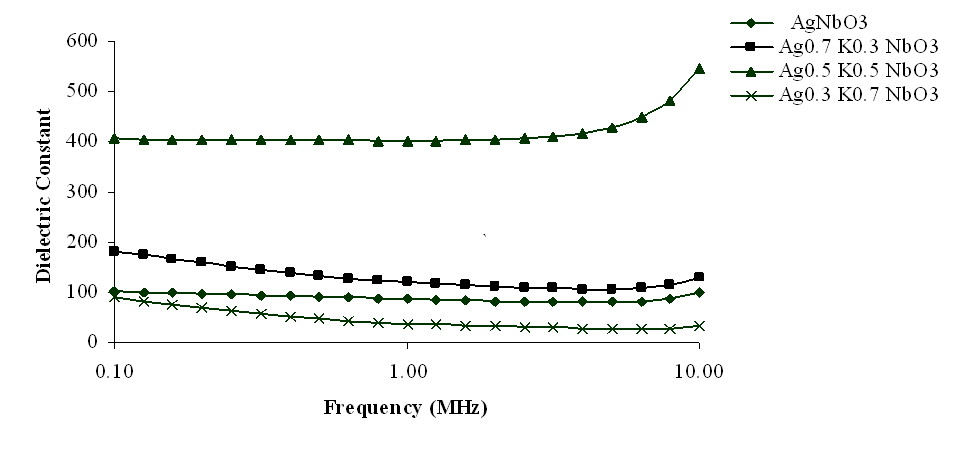 | Figure 1. Variation of dielectric constant with frequency for Ag1-xKxNbO3 system in the frequency range 0.1 MHz-10 MHz |
 | Figure 2. Variation of dielectric constant with frequency for Ag1-xKxNbO3 system in the frequency range 0.1 KHz-100 KHz |
 | Figure 3. Variation of dielectric constant with frequency for Ag1-xKxNbO3 system in the frequency range 10 Hz-100 Hz |
 | Figure 4. Variation of dielectric constant with frequency for Ag1-xKxNbO3 system at room temperature |
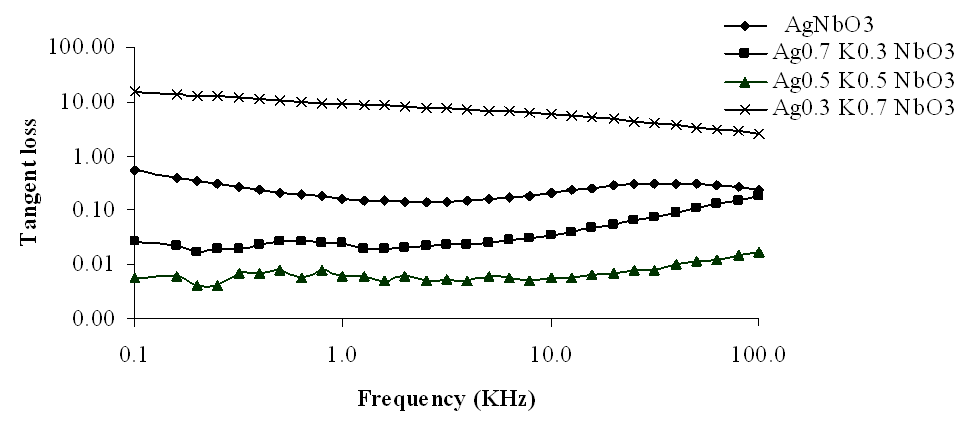
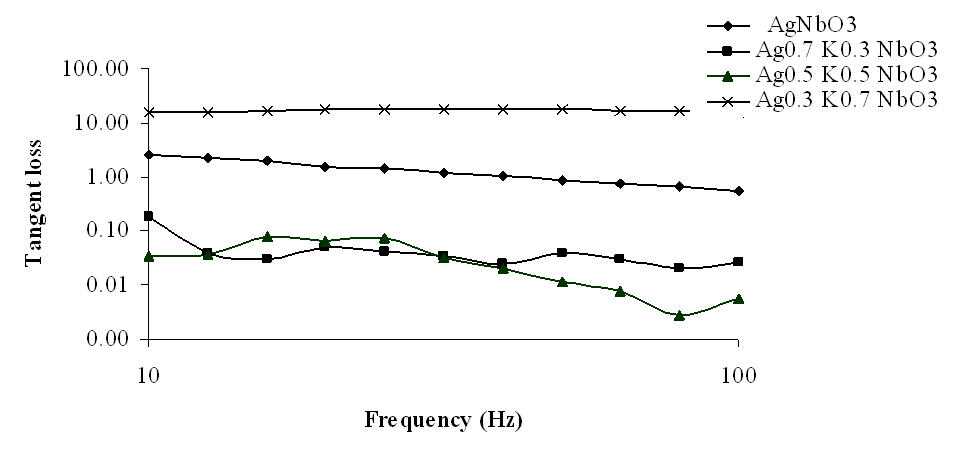
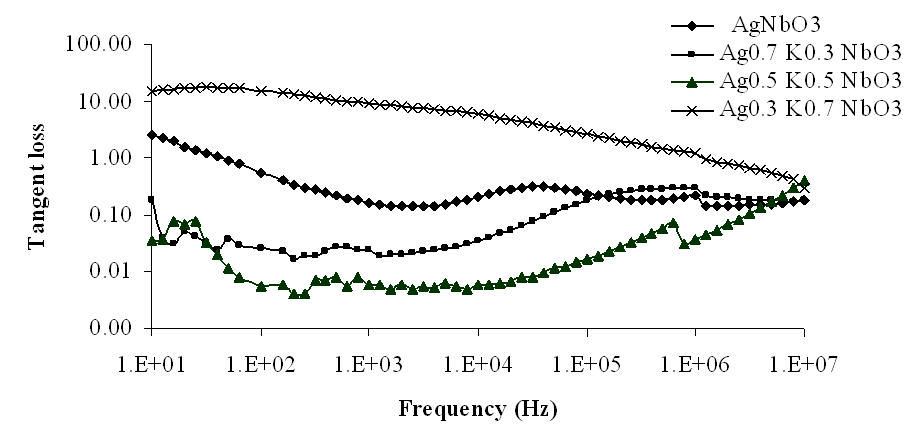
3.2. Tangent Loss (tanδ)
The variations of tangent loss (tanδ) with frequency, at room temperature, have been shown in Figs 5-8, in the frequency range 10 Hz to 10 MHz. It has been observed from these graphs that similar to dielectric constant (K), tangent loss (tanδ) also decreased with increasing frequency in the lower frequency range, i.e., up to 20 KHz frequency, but at higher frequencies, dielectric loss slightly increased. However, loss tangent decreases with increasing contents of K in Ag1-xKxNbO3 in the lower frequency range up to 2MHz frequency, while at higher frequencies, loss tangent slightly increased with increasing contents of K, except for Ag0.3K0.7NbO3 who show the anomalous behavior.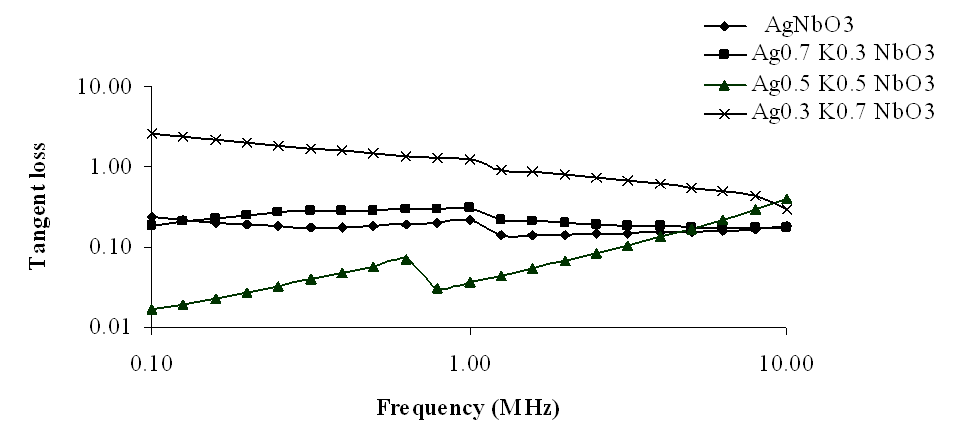 | Figure 5. Variation of tangent loss with frequency for Ag1-xKxNbO3 system in the frequency range 0.1 MHz-10 MHz |
 | Figure 6. Variation of tangent loss with frequency for Ag1-xKxNbO3 system in the frequency range 0.1 KHz-100 KHz |
 | Figure 7. Variation of tangent loss with frequency for Ag1-xKxNbO3 system in the frequency range 10 Hz-100 Hz |
 | Figure 8. Variation of tangent loss with frequency for Ag1-xKxNbO3 system at room temperature |
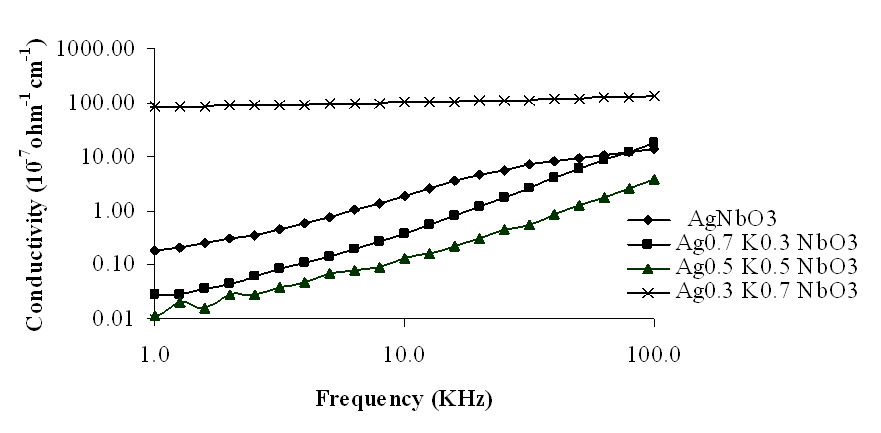
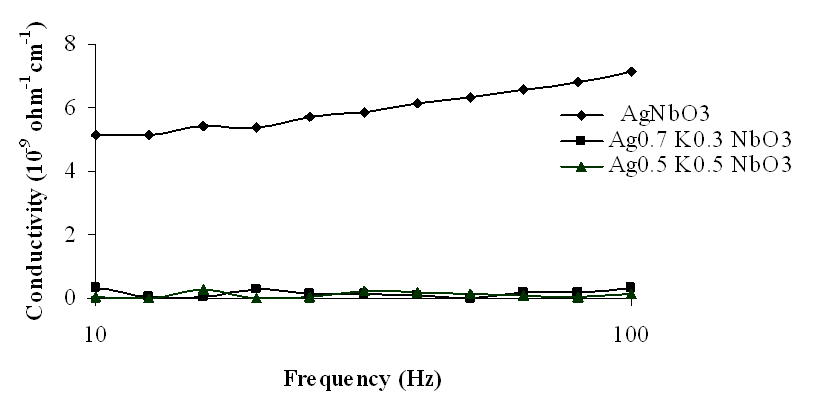
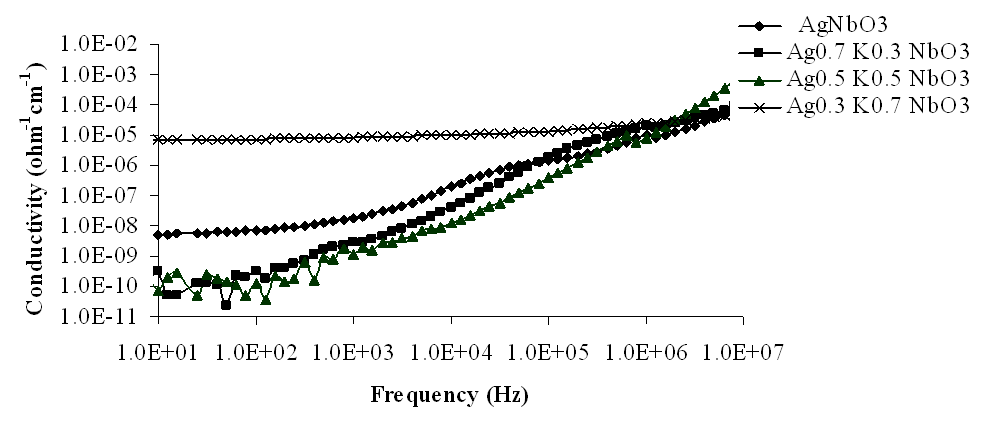
3.3. Electrical Conductivity (σ)
The variations of electrical conductivity (σ) with frequency, at room temperature, have been shown in Figs 9-12, in the frequency range 10 Hz to 10 MHz. From these figures, it has been observed that electrical conductivity (σ) increased as frequency increased and showed a small decrease at about 1 MHz, in the measured frequency range, at room temperature. It has also been observed that electrical conductivity decreased as K content increased in the lower frequency range but at higher frequencies it increased. The component Ag0.3K0.7NbO3 again showed anomalous behaviour in the whole measured frequency range. The maximum values of electrical conductivity have been observed 1.03 × 10⁻⁴ Ω-1 cm-1, 1.31 × 10⁻⁴ Ω-1 cm-1, 12.2 × 10⁻⁴ Ω-1 cm-1 and 0.56 × 10⁻⁴ Ω-1 cm-1 for x = 0, 0.3, 0.5 and 0.7 respectively, at 10 MHz frequency.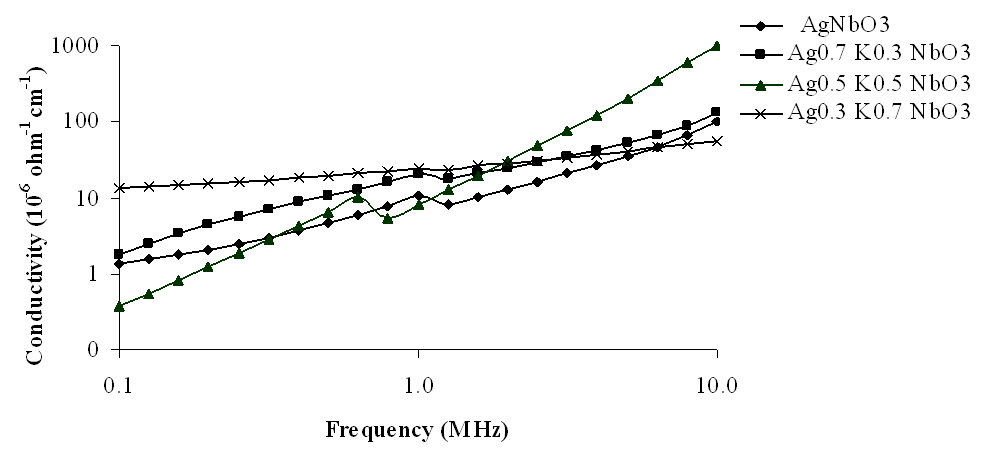 | Figure 9. Variation of conductivity with frequency for Ag1-xKxNbO3 system in the frequency range 0.1 MHz-10 MHz |
 | Figure 10. Variation of conductivity with frequency for Ag1-xKxNbO3 system in the frequency range 0.1 KHz-100 KHz |
 | Figure 11. Variation of conductivity with frequency for Ag1-xKxNbO3 system in the frequency range 10 Hz-100 Hz |
 | Figure 12. Variation of conductivity with frequency for Ag1-xKxNbO3 system at room temperature |
4. Conclusions
Ceramic pellets of silver potassium niobate mixed system Ag1−xKxNbO3 (x = 0, 0.3, 0.5 & 0.7) have been prepared by solid-state reaction method and sintering process. From XRD and SEM studies, it has been observed that all the prepared samples show orthorhombic structure at room temperature. The average grain size of all the prepared samples has been found in the nano range. The average grain size of Ag1-xKxNbO3 decreased on increasing the concentration of potassium (K). As K is lighter and smaller than Ag, it causes a decrease in average grain size of Ag1-xKxNbO3 on increasing the potassium (K) concentration. From dielectric measurements, it has been observed that generally, the dielectric constant and tangent loss decreased with increasing frequency except at higher frequencies while electrical conductivity increased as frequency increased. However, the magnitude of dielectric constant increased on increasing the value of x and electrical conductivity decreased on increasing the value of x in Ag1−xKxNbO3. Composition Ag0.3K0.7NbO3 shows the anomalous behavior due to its hygroscopic nature. Decreasing nature of dielectric constant with increasing frequency may be due to the relaxation behavior of material.
ACKNOWLEDGEMENTS
Authors express hearty thanks to Dr. Rajendra Dhobhal, Director, USERC, Dehradun, Uttarakhand, Prof. B. S. Semwal Ex. Head, Department of Physics and Prof. N. S. Panwar, Head, USIC, H. N. B. Garhwal University Srinagar (Garhwal) for their help, support, constructive criticism & encouragement. Authors are also thankful to Institute of Instrumentation Centre (IIC), IIT Roorkee and National Physical Laboratory, New Delhi for providing laboratory facilities.
References
| [1] | Bhatt S.C., Singh K., Uniyal M., Om Prakash, Singh P.K., Saxena R., and Semwal B.S., 2007, Indian J. Pure Appl. Phys. 45, 609-612 |
| [2] | Nautiyal O.P., Bhatt S.C., and Bartwal K.S., 2010, J. Alloys and Compouds, 505, 168-171 |
| [3] | Valant M., Axelsson A. K. and Alford N., 2007, J. Eur. Ceram Soc., 27, 2549 |
| [4] | Kania A., Roleder K., Kugel G.E., and Fontana M.D., 1986, J. Phys. C: Solid state Physics 19, 9 |
| [5] | S. C. Bhatt, O. P. Nautiyal, and B. S. Semwal, Processes and Characterisation of advanced nanostructured materials, Macmillan Publisher India Ltd, 2010, pp. 9-14 |
| [6] | Nautiyal O.P., Bhatt S.C., Pant R.P., and Semwal B.S., 2010, Indian J. Pure & Appl. Phys. 48, 357-362 |
| [7] | Nautiyal O.P., Bhatt S.C., Pant R.P., Bourai A.A., Singh P.K., Saxena R., and Semwal B.S., 2009, Indian J. Pure Appl. Phys. 47, 282-288 |
| [8] | Nautiyal O. P., and Bhatt S. C, 2011, American Journal of Materials Science, 1 (1), 1-3 (In Press, DOI: 10.5923/j.materials.20110928.01) |
| [9] | Fadil F.Z., Aillerie M., Lamcharfi T., and Abdi F., 2011, Ceramics International, 37 (7), 2281-2285 |
| [10] | Nautiyal O.P., Bhatt S.C., and Semwal B.S., 2009, Indian J. Pure Appl. Phys. 47, 719-724 |
| [11] | O. P. Nautiyal, S. C. Bhatt, and B. S. Semwal, Processes and Characterisation of advanced nanostructured materials, Macmillan Publisher India Ltd, 2010, pp. 3-8 |
 Abstract
 Reference
 Full-Text PDF
 Full-Text HTML