-
Paper Information
- Paper Submission
-
Journal Information
- About This Journal
- Editorial Board
- Current Issue
- Archive
- Author Guidelines
- Contact Us
American Journal of Computational and Applied Mathematics
p-ISSN: 2165-8935 e-ISSN: 2165-8943
2025; 15(1): 1-9
doi:10.5923/j.ajcam.20251501.01
Received: Mar. 17, 2025; Accepted: Apr. 21, 2025; Published: Apr. 29, 2025

Development of an Analysis-Synthesis Method for Designing Single Degree of Freedom Nonlinear Dynamical Systems
 Abstract
 Reference
 Full-Text PDF
 Full-text HTML
Mečislovas Mariūnas
Department of Biomechanical Engineering, Vilnius Gediminas Technical University, Vilnius LT, Lithuania
Correspondence to: Mečislovas Mariūnas , Department of Biomechanical Engineering, Vilnius Gediminas Technical University, Vilnius LT, Lithuania.
| Email: |  |
Copyright © 2025 Scientific & Academic Publishing. All Rights Reserved.
This work is licensed under the Creative Commons Attribution International License (CC BY).
http://creativecommons.org/licenses/by/4.0/

Based on the resonant frequencies of a nonlinear dynamic system and the magnitude of the system excitation force, a new analysis-synthesis method has been developed that allows the design of new nonlinear dynamic systems, specifying zones of minimal vibrations and stable operating modes. The operating mode frequency zone has been determined, in which a sudden change in the size of vibrations leading to unstable operation of the system is possible. The boundaries of minimum vibration and stable operating frequency zones are determined. It is shown that the developed analysis-synthesis method allows designing a nonlinear dynamic system with low vibration level and stable operation, evaluating the features of the interaction between the values of the main parameters of the system and the excitation frequencies of the operating modes by analyzing them. Cases have been clarified when the use of a damper in a nonlinear dynamic system will not reduce, but only increase the level of vibrations in it. The accuracy of the analysis methods presented in the article was verified by numerical calculations.
Keywords: Vibration, Synthesis, Analysis, Peculiarities, Excitation, Forces, Nonlinear, Dynamic system, Quadratic order, Nonlinearities, Resonant, Parametric, Frequencies, One degree of freedom, Set, Frequency band
Cite this paper: Mečislovas Mariūnas , Development of an Analysis-Synthesis Method for Designing Single Degree of Freedom Nonlinear Dynamical Systems, American Journal of Computational and Applied Mathematics , Vol. 15 No. 1, 2025, pp. 1-9. doi: 10.5923/j.ajcam.20251501.01.
Article Outline
1. Introduction
- Nonlinear dynamic systems can be elementary or complex. Therefore, their design methods are also very different, requiring mathematical knowledge and experience in those areas. Bor - Sen, Tseng and Uang [1] emphasized that the design of nonlinear dynamic systems is a complex process, and in practical control systems, the model is always nonlinear. Thus, many nonlinear control methods have been developed for nonlinear systems to overcome the difficulties of controller design for real systems. However, in these control system designs, nonlinear systems must have some predictable behaviors. For example, the system must have minimal phases, its parameters must be known precisely so that feedback can be obtained and a linearization method can be used. Tseng, Chen and Uang [2] has shown that there are two typical tasks of stabilization and tracking control problems. In general, tracking problems are more difficult than stabilization problems, especially in nonlinear systems. For the design of nonlinear systems, various control schemes are presented, including exact feedback linearization, sliding mode control and adaptive control. Furthermore, this study discussed the stability of closed-loop nonlinear systems. Wang [3] uses fuzzy systems as identifiers for nonlinear dynamical systems. He provides a theoretical justification for fuzzy identifiers, proving that they can track the output of a general nonlinear dynamical system with arbitrary accuracy over any finite time interval. Fuzzy identifiers are composed of a set of adaptable fuzzy IF-THEN rules and can incorporate both numerical information and linguistic information (in the form of IF-THEN rules related to the behavior of the system in fuzzy and fuzzy words) into their design in a uniform manner. Boutat and Zheng [4] present a differential geometric method for constructing nonlinear observers for several types of nonlinear systems, including single and multiple outputs, fully and partially observable systems, and ordinary and singular dynamical systems. This is an exposition of the achievements of nonlinear observer normal forms. Zhirabok et al. [5] the objective of the paper is visual sensors design, estimating prescribed components of the systems state vector to solve the task of fault diagnosis in nonlinear system. To solve the problem the method called logic – dynamical approach is used. Ketn [6] discusses the theoretical foundations of sport pedagogy, based on the concept of the learner as a nonlinear dynamic movement system. It is argued that this approach to learning design in sport can provide practitioners with a relevant model of the learner and the learning processes. Longhini and Palacios [7] emphasize that the field of applied nonlinear dynamics has attracted scientists and engineers from many different disciplines to develop innovative ideas and methods for studying the complex behavior of relatively simple systems. However, he argues that there are general universal laws of non-linear science that govern the behavior of a given system in space and time. These laws are universal in the sense that they transcend the specific features of the system in the model, and therefore can be easily applied to explain and predict the behavior of a wide variety of natural and artificial phenomena. Chow [8] emphasizes that in the absence of exact solutions, the analysis of nonlinear systems is usually performed by applying approximate analysis, numerical simulations, and geometric techniques, when the energy of the vibrating system is dissipated by various mechanisms. Many different models are used to evaluate the damping of dynamic systems in the work of Zheng and Yiming [9]. When designing nonlinear dynamic systems, it is very important to be able to evaluate the damping properties and possibly change their size during the process. In the analysis of damping in a dynamic system, in many mathematical models the damping forces are related to the movements of the degrees of freedom of the system.The efficiency of the proposed vibration isolation strategy is numerically demonstrated over the original device. Vincent et al. [10] showed that the control of nonlinear systems with external excitation can lead to many intriguing and important phenomena, one of the most prominent of which is resonance. In the presence of additional harmonic or stochastic excitation, two exotic forms of resonance can occur: vibrational resonance or stochastic resonance, respectively. Saunders et al. [11] examines “Freeplay” integrally smooth normal nonlinearities of dynamical systems, which can lead to undesirable and potentially dangerous responses. The latter work numerically investigates the effect of multiple segment parameters during the evolution of the bifurcation diagram along with the induced multiple behavior and different bifurcations. To study the latter phenomena, they use a variety of tools such as harmonic balance, basins of attraction, phase planes, and Poincaré section analysis. Xuechuanan et al. [12] describe various approximation methods, starting from the classical asymptotic, finite difference and weighted residual methods, and discuss typical methods for solving nonlinear dynamical systems. In addition, new high-performance methods such as time-domain collocation and local variational iteration are proposed. Yang [13] examines the approximate nonlinear response of the system at super/subharmonic resonance. He shows that in many cases, single resonance mode is often observed to be leading as systems enters into super/ subharmonic resonance. An illustrative example of the discrete mass-spring-damper vibration system is provided for illustration. Pszybyl and Cpalka [14] emphasizes that for many practical studies of weakly nonlinear systems, approximate linear models are used. The models obtained by applying these methods describe well the main features of the system dynamics. However, usually its accuracy is low, which may be the result of omitting many secondary phenomena in its description. Kim, and Young Oh [15] a stable neural control scheme using a locally activated neural network has been proposed for a class of nonlinear dynamic systems. This network aims to maintain local representations of the system dynamics. Thus, the global control performance in the concerned state space is achieved by the cooperation of many local control efforts and furthermore, real-time control can be facilitated because only a small sized network is involved to control and learn at any given time. However, in the reviewed sources for the design of nonlinear dynamic systems, they are linearized and the problems are solved with a certain accuracy of the tasks. It has not been observed that the mathematical model of the nonlinear dynamic system is created on the basis of resonant, harmonic and subharmonic frequencies. Mariūnas [16] studied the characteristics of vibration damping based on the resonant frequencies of a nonlinear dynamic system and developed a new method that allows for an approximate determination of the vibration level in the system under consideration. However, the methods of creating (designing) nonlinear dynamic systems, which would be created on the basis of resonant frequencies, are not analyzed. The frequencies of the low-vibration and stable operating mode zones of the created nonlinear dynamic system have also not been analyzed. A mathematical apparatus that would allow determining the resonant frequencies of a nonlinear dynamic system based on the values of its basic parameters has not been presented. Mariūnas [17], while analyzing the resonant (natural) frequencies of a nonlinear dynamic system, created a mathematical apparatus that allows determining their values based on the values of the main parameters of the system, and in the source [18] he creates a new method that is based on the system stiffness’s corresponding to the resonant frequencies. Thus, the aim of the work is to develop an analysis-synthesis method that would allow designing a one degree of freedom nonlinear dynamic system in which, without additional damping, a low level of vibrations would be guaranteed and the system would operate stably. The latter method is to be developed on the basis of the resonant frequencies of the nonlinear dynamic system by evaluating the magnitude of the excitation force, the excitation frequencies of the operating modes and the values of the main parameters of The system. To show the influence of system parameter mismatch on its vibration level and operational stability. To determine the zones of large vibrations, in which sudden and large vibration amplitude jumps are possible.
2. Mathematical Model of the Analysis-Synthesis Method for Single Degree of Freedom Nonlinear Dynamical Systems
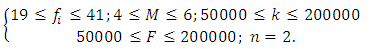
- A nonlinear dynamical system designer must be able to create (design) a new system according to the user's specifications for the main parameters of the system being developed, which would operate stably, safely, and meet other needs of the future user. The limits of variation of the main parameters of the newly designed nonlinear dynamic system can be given as follows:
 (system excitation frequency);
  (maximum vibration level);
  (system mass);
  (excitation force magnitude) and
  (system stiffness), respectively. The degree of nonlinearity of the dynamic system being developed must also be indicated by n. Let us study a second-order nonlinear dynamical system of one degree of freedom, the parameters of which are: M = 5.0kg;
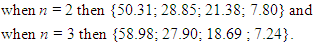
 n = 2. The resonant frequencies (eigenvalue) of the subsystems of the latter dynamical system are:

 and the resonant frequencies of the main (overall) system are:
 (see [18]). The dependence of the vibration size on the excitation frequency of the nonlinear dynamic system using the Runge-Kutta method is determined in the interval
  In Table 1, the dependence of the vibration magnitude on the excitation frequency is shown only up to 60Hz, since when
  the vibration amplitudes are small. The study of the dependence of the vibration value on the excitation force magnitude was carried out at
  = 50000N; 100000N and 200000N, the results of which are shown in Figure 1 (see curves a, b, c). Recent studies have been conducted to determine how the frequencies of the maximum amplitudes of vibrations change and to plot the diagram in Figure 1. The calculation results show that for different excitation force magnitudes F, the maximum vibration level in the system is reached at different system excitation frequencies
  (see Figure 1). For example, when the system is excited with a force of
  = 50000N, then the maximum amplitude of the vibrations approximately corresponds to the resonant frequency
  (
( 28Hz, curve a Figure 1), when the system is excited with
  = 100000N - then the maximum amplitude of the vibrations - approximately corresponds to the resonant frequency
  (
( 32Hz, curve b Figure 1) and when the system is excited with
  = 200000N - then the maximum amplitude of the vibrations approximately corresponds to the frequency
  (
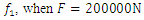
( 41Hz, curve c Figure 1). In Figure 1, the vertical dashes in black indicate the resonant frequencies of the subsystems of the nonlinear dynamic system, and the resonant frequencies of the overall system in green.In order not to burden the reader with the abundance of calculation results, Table 1 presents only the dependence of the amplitude of vibrations of a nonlinear dynamic system on the excitation frequency of the system when the magnitude of the excitation force is F = 200000N. The calculation results presented in Table 1 complement and allow for a better understanding of the diagram presented in figure1. By drawing a vertical black line on the frequency scale through the frequency corresponding to the subharmonic frequency
  of the resonant frequency generated by the system's force coupling properties, we will determine on the right side the frequency limit of the second zone (PZ), which cannot be used to excite the system, so as not to cause high level vibrations in the system (see Figure 1). In Figure 1 the distance at which the black line should be drawn is expressed in terms of the resonant frequency
  and is written as follows:
  By drawing a vertical red line on the frequency scale to the left of the
  resonant frequency, i.e. at a distance
  from the resonant frequency
  we will have the boundary of the second zone (PZ) from the left side, which will also limit the maximum allowable vibration amplitude in the designed system
  depending on the magnitude of the vibration excitation force F = 50000N, F = 100000N or F = 200000N with which the system will be vibrated (see Figure 1).
|
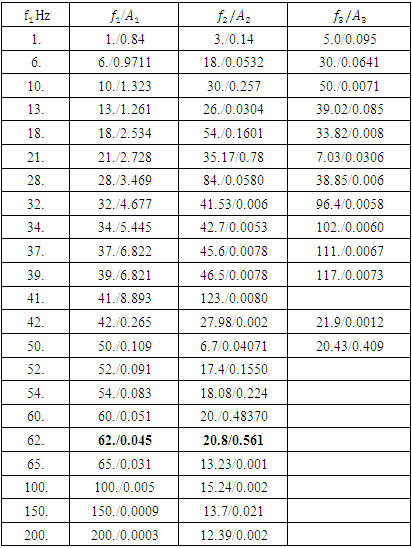
 | Figure 1. Dependence of vibration magnitude on the excitation frequency and force magnitude of the dynamic system, n = 2 |
 of the dynamic system (see zone PZ). The latter three zones (WZ, PZ and NR, see Figure 1) are also distinguished because they differ not only in the levels of vibrations of the dynamic system, but also in the frequency bands of the spectral density. For example, in the third zone (NR), the amplitude of the vibrations of the excitation frequency is not always greater than the amplitude of the second frequency of the vibration spectral density. It is characteristic that the amplitude of the vibrations excited at the latter frequencies is several times larger than the amplitude excited by the system excitation frequency and its frequency is already in the first zone. For example, when a dynamic system is excited at a frequency of 62 Hz, the system will vibrate at an amplitude of 0.045 at that excited frequency, but a second amplitude of approximately 0.561 will be created, with a frequency of approximately 20.8Hz (see Table 1). Therefore, the second amplitude will be 0.561/0.045
  12.47 times greater than the first one. Let's consider another example, if a dynamic system is excited by a force F = 200000N and a frequency of 41Hz, then its vibration amplitude would be approximately 8.89 and if the excitation force was changed to approximately 42Hz during operation, then the vibration amplitude would be approximately 0.265. The latter results show that in the case under consideration, if the system excitation frequency changed by only one hertz, the vibration amplitude increased approximately 8.89/0.265 = 33.55 times. The latter results show that at or near the junction of the second and third zones, the dynamic system is very unstable, and it is precisely at the latter zone junction that, when the excitation frequency or the magnitude of the excitation force is slightly increased, a sudden and large (jump) increase in the system vibration level can occur and the system will become unstable. It is experimentally established that the operating zone width of the latter unstable nonlinear dynamic system is approximately
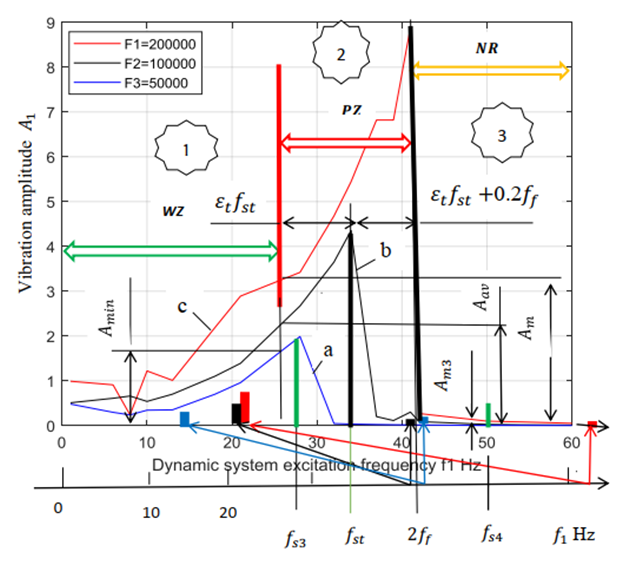
  wide. Therefore, when designing a new dynamic system, it is necessary to be able to evaluate the latter feature and select the values of the main parameters of the nonlinear dynamic system, the resonant frequencies of which would not become or would not be close to the frequencies of its operating modes. Thus, the diagram in Figure 1 is the main graphical model for developing an analysis-synthesis method for designing nonlinear dynamic systems. Therefore, when designing a new nonlinear dynamic system, it is very important to have a method that would allow checking:- whether the requirements for the main parameters of the dynamic system are consistent with the intended operating frequencies, or whether it will not turn out that the system designed according to the given parameter values will have to operate under resonance conditions, i.e. in the second zone (see Figure 1)?- and how to mutually coordinate the values of the main parameters of the system so that it operates in the desired vibration zone, guaranteeing a low vibration level and stable operation.Therefore, it is very important to develop an analysis-synthesis method that would allow solving the above mentioned problems and designing a nonlinear dynamic system in which the level of vibrations would be sufficiently low and the system would operate stably. From the diagram Figure 1 it can be seen that knowing the resonant frequencies of a nonlinear dynamic system, it is possible to construct the latter diagram and determine in which excitation frequency zone the designed system will operate according to the established values of the main parameters and operating mode frequencies. Thus, when the values of the main parameters M, k, F and n of the designed system are known, then according to the method developed by Mariūnas [18], it is possible to calculate the resonant frequencies of the designed nonlinear dynamic system and their corresponding stiffness’s in the following way:
 | (1) |
 | (2) |
 | (3) |
 | (4) |
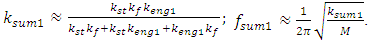
 M is the mass of the system; n is an indicator of the degree of nonlinearity of the dynamic system.From expressions (1), ..., (4) it can be seen that the resonant frequencies of the subsystems of the system do not depend on the magnitude of its excitation force, but its magnitude affects the frequencies of the maximum vibration amplitudes (see Table 1 and Figure 1). Therefore, in the design process it is convenient to use a parameter whose value is determined by the ratio of two variables:
  Since when k = F then
  . And the latter condition on the frequency scale corresponds to the resonance frequency of the system subsystems
  which is generated by the peculiarities of stiffness's connections. From the diagram Figure 1 it can be seen that with respect to the resonant frequency
  the first zone is on the left, the third zone is on the right, and the latter frequency is approximately in the middle of the frequency band of the second zone. Therefore, when constructing the diagram in Figure 1, the
  resonant frequency is chosen as the reference point on the frequency scale. From the diagram Figure 1 we will notice that the main resonant frequencies and the maximum amplitudes of vibrations of nonlinear dynamic systems are related to the ratio of the force exciting the dynamic system F and the stiffness k of the system. When
  then the frequencies will be
  and when
  then the frequencies of the system
  . The value of the ratio
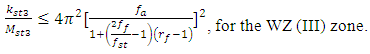
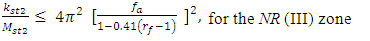
  can be changed by changing only the magnitude of the excitation force F, without changing the system stiffness k. This can be an advantage, because changing the system stiffness is sometimes impossible. Analyzing the diagram in Figure 1, we will notice that by changing the magnitude of the excitation force F, we will change the width of the second zone. So, when starting to design a nonlinear dynamic system, we must decide which system parameters we can change and whether we can change the operating mode frequencies, because the way to solve the problem depends on this. Thus, in the case where the operating mode frequencies cannot be changed, and they coincide with the resonant frequencies of the system, then it is necessary to change the resonant frequencies of the dynamic system, i.e., their transformation must be performed, which is described by the following inequality:
 | (5) |
 | (6) |
 | (7) |
 | (8) |
 in the following way. Analyzing the data in Figure 1 and Table 1, we notice that when
  then the maximum vibration amplitude
  . approximately corresponds to the frequency 28Hz
  , when
  then the maximum vibration amplitude
  approximately corresponds to the frequency
  and when
  then the maximum vibration amplitude
  approximately corresponds to the frequency
  Thus, according to the latter determined values of vibrations
  when the ratio
  varies in the interval
  there is an approximately linear relationship between the latter quantities. There is also an approximately linear relationship between
  and the frequencies
  which correspond to the maximum vibration amplitudes
  (see Figure 1). Therefore, the change in vibrations and their frequencies as the value of the ratio
  changes in the interval
  can be approximately estimated as follows:
 | (9) |
 in the following way:
 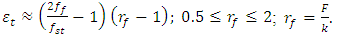 | (10) |
 . The diagram in Figure 1 also shows that the vibration level in the second zone increases significantly when
  . Meanwhile, in the first and third zones, the amplitude of the dynamic system vibrations
  is significantly lower. Therefore, the boundaries of the latter zones must be determined very carefully, because as shown above, an unstable operating mode can be created for the system. In the studied frequency range
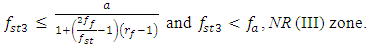
 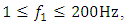 using dependencies (9) and (10), we determine the boundaries of the first (WZ), second (PZ), and third (NR) zones as follows:
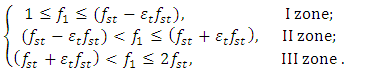 | (11) |
 into a higher or lower frequency on the side scale, without changing the given frequencies of the operating modes of the designed system, we rearrange expressions (5) and (6) into the following form:
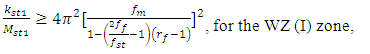 | (12) |
 | (13) |
 or
or  of the operating modes of the nonlinear dynamic system and the stiffness of the subsystems of the system, corresponding to the resonant frequency
 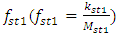 and
and 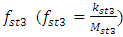 . We rearrange inequalities (12) and (13) into the following form:
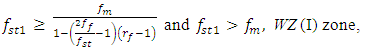 | (14) |
 | (15) |
 and
and  , the values of the ratios
  and
and  are of constant magnitude. However, on the other hand, they show that the stiffness’s and masses of the designed system can vary, only the necessary condition is that their ratio is of constant magnitude. Therefore, the latter condition can be satisfied in both cases by infinitely many values of
  and
and  , and
, and  and
and  . However, the selected values of the latter parameters
  and
and  must satisfy the following inequalities:
 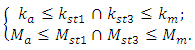 | (16) |
 is a conjunction.It is possible that the values of the main parameters specified in the design task will not satisfy the requirements of inequalities (16), because the customer simply did not have the opportunity to do so. He did not conduct a study of the nonlinear dynamic system being developed using the analysis-synthesis method. Therefore, when determining the values of parameters
  and
and  , it is necessary to coordinate their values with the customer, because only he can say which values of these parameters are more suitable for them. Or they may decide that the system they are developing will need to operate in the high-frequency vibration zone, i.e. zone two (see Figure 1), and use a damper to reduce the vibration level. In the case where it is possible to change the frequencies of the operating modes of a nonlinear dynamic system, then it is not necessary to change the values of the main parameters of the nonlinear dynamic system, but it is sufficient to change the frequencies of the operating modes of the system. In the case under consideration, we perform a simple transformation of the excitation frequencies of the operating modes in the following way:
 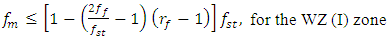 | (17) |
 | (18) |
 has a significant effect on the values of the frequency transformation
  and
and  of the nonlinear dynamic system operating modes. Since the value of the ratio
  (see equations (1),..., (4)) is a constant. Not all nonlinear dynamic systems satisfy the condition k = F, so the diagrams in Figure 1 can be shifted to one side or the other with respect to the resonant frequency
  of the system. From the above research results (see Figure 1 and Table 1) it can be seen that to fully create the diagram shown in Figure 1 and to develop an analysis-synthesis method, it is necessary to determine the resonant frequencies of the main dynamic system. To achieve this goal, it is necessary to create a system of four differential equations, which is based on the resonant frequencies of the subsystems of the nonlinear dynamic system. Equations (1),...,(4) allow us to determine (calculate) the resonant frequencies and their corresponding stiffness’s of the subsystems of a nonlinear dynamic system. And then when the stiffness’s of the subsystems of the nonlinear dynamic system
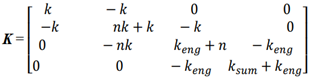
  are determined, then a system of four linear differential equations is formed, allowing to determine the resonant frequencies of the main system:
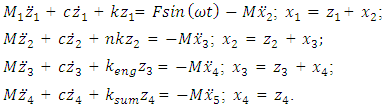 | (19) |
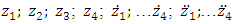 are velocity and acceleration;
  is angular frequency; t is time.After a simple transformation of the system of equations (19) we obtain:
 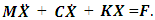 | (20) |
 | (21) |
 | (22) |
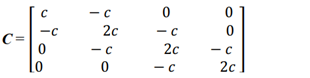
 = M when i = 1; 2; ...; 4 In this way, the systems of left equations (20) are clear because the matrices of mass, damping coefficient (21) and stiffness (22) are known. It is very important to make sure how much the resonant frequencies (eigenvalues) will change when the latter subsystems are combined into a common system. Thus, the system of equations (20) is transformed as follows:
 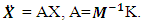 | (23) |
 . By inserting
  in to the system (23) and denoting
  we obtain:
 | (24) |
 | (25) |
3. Development and Study of Nonlinear Dynamic Systems Using the Analysis–Synthesis Method, Numerical Analysis and Discussion
- In most cases, nonlinear dynamic systems are created (designed) in the usual way:– the user of the created nonlinear dynamic system determines its main parameters and the permissible limits of variation of the latter values; – the designer creates a nonlinear dynamic system according to the values of the main parameters set by the customer and conducts its vibration and stability studies. According to the results of the study, it is decided whether the dynamic system operates stably and its vibration level satisfies the customer.– in this case, at the initial design stage, the values of the main parameters of the nonlinear dynamic system and the frequencies of the operating modes are determined, which guarantee a low vibration level and its stable operation. Let us assume that the main parameters of the latter system will be M, k, n and F and their values can vary within the following limits:
 | (26) |
 (see (26)) are properly selected and whether they guarantee the safe operation of the system with small vibrations. In order to find out whether the main parameter values and operating mode frequencies are properly matched and their combination guarantees low vibration levels and stable operation of the dynamic system, we will use the analysis-synthesis method developed above. For more detailed studies, let us simplify the limits of variation of some of the main parameters, i.e., for example, we will consider
  = 100000N/m,
  = 5kg and
  = 2 (see (26)). The latter simplifications will not reduce the clarity of the application of the latter method, but the interpretation process will be significantly shorter and simpler. From (1) and (2) it can be seen that the ratio
  is a constant and its approximate value is equal to
  Then we rearrange expressions (14), (15), (17) and (18) into the following form:
 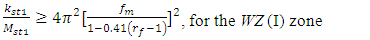 | (27) |
 | (28) |
 | (29) |
 | (30) |
 frequency. According to formula (10), we calculate the value of
  and then determine the boundaries of the first, second and third zones and mark them with vertical red lines (see Figure 2).
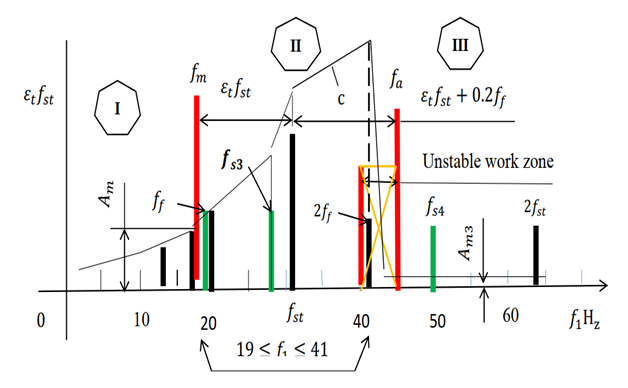 | Figure 2. Diagram of zone boundaries with different vibration levels |
 in the first zone, and using expression (30), we will determine the minimum permissible frequency
  for operation in the third zone. When calculating the lower limit of the second zone by frequency, the value of
  should be taken as
  and for the upper limit by frequency, the value of
  should be taken, in order to estimate the maximum possible change in the magnitude of the exciting force F. So, in the case under consideration, according to expression (29), we calculate that
  or
or  and according to expression (30), we calculate that
  or
or  Thus, the excitation frequencies of the nonlinear dynamic system, lower than
  , are the frequencies of the first operating zone, and, accordingly, the frequencies higher than the frequency
  are the frequencies of the third operating zone (see Fig. 2). When the magnitude of the excitation force F varies in a smaller interval than in the case under consideration, then the boundaries of the second zone can be narrowed by reducing the value of
  . Therefore, the developed analysis-synthesis method allows to match the main parameters of the nonlinear dynamic system with the frequencies of its operating modes, guaranteeing a low level of vibrations and stable operation. And if it is necessary to further reduce the level of vibrations in the system, a damper can be used. However, before using it, it is necessary to clarify the processes occurring in the nonlinear dynamic system. Research has shown that the damper used to reduce vibrations does not always give positive results. Without understanding the physics of the processes occurring in a nonlinear dynamic system, sometimes we can only significantly increase the level of vibrations at frequencies other than the one at which the system is exciting. For example, in the example discussed above, when the system is excited by a force of F = 200000N and a frequency of
 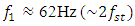 , the amplitude of the vibrations is
  , and the second amplitude of the vibrations is
  , approximately at 20.71Hz (see Figure 3b). In Figure 3, the amplitude
  of the frequency band of the vibration spectral density is relatively marked with a vertical blue line, and the frequency is written next to it and the amplitude in decibels below it. Thus, in order to reduce the vibration level of a nonlinear dynamic system, at first glance it seems that the amplitude of the vibrations
  needs to be reduced, since it is
  (see Figure 3). This means that we must apply a force of approximately 20.7Hz to the dynamic system, which would be in antiphase with the exciting force.
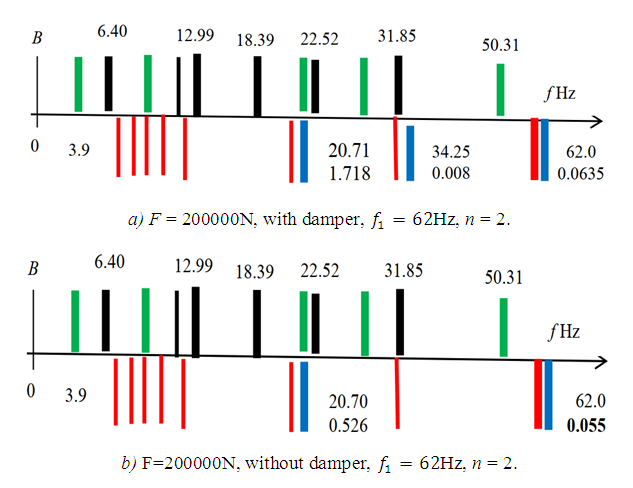 | Figure 3. Frequency bands of the vibration spectral density of a nonlinear dynamic system with and without vibration magnitude dampers |
 (20.70Hz, or approximately the resonant frequency of the dynamic system
  ), which is the largest without damping (Figure 3b), we will not reduce its size, but only increase its and the total level of vibrations of the system (see Figure 3a). The results of the research show that the amplitude of the
  vibrations can be reduced only by reducing the amplitude of the
  using a damper. The results of the research show that by determining the values of the main parameters of the designed nonlinear dynamic system and the frequencies of the operating modes using the analysis-synthesis method, the vibration amplitudes can be reduced by approximately 3 to several times. The diagram in Figure 2 would be much more informative if it also showed unwanted excitation frequencies of operating modes and their vibration levels, which coincide or are close to the frequencies of harmonics and subharmonics of the resonant frequencies of the dynamic system and which can increase the vibration level at low frequencies in the system (see Figure 1). The dependence of the vibration magnitude of a nonlinear dynamic system on its excitation frequency, varying in the frequency range of operating modes, can be calculated using various numerical methods, including the Runge-Kutta method. The diagram Figure 2, supplemented with the calculation results showing the dependence of the vibrations amplitude
  on the excitation frequency
  of the dynamic system and the force F, would become more visual and serve as a passport for the newly developed system (see Figure 1). The latter diagram can be used to monitor the stability of the working process of a nonlinear dynamic system.
4. Conclusions
- Clarifying the peculiarities of nonlinear dynamic systems allows us to better understand the processes occurring in them, and to develop an analysis-synthesis method that, based on the values of the system's main parameters, allows us to design systems with low vibration levels and stable operation.The analytical results indicate that:1. Based on the resonant frequencies of a nonlinear dynamic system, the magnitude of the system excitation force, a new method has been developed that allows designing new nonlinear dynamical systems, specifying the zones of minimal vibrations and stable operating modes;2. The boundaries of low vibration and stable operation zones have been established, highlighting the operating frequency zones where a significant jump in vibration levels and unstable system operation are possible; 3. It is shown that the developed analysis-synthesis method allows designing a nonlinear dynamic system with low vibration level and stable operation, evaluating the features of the interaction between the values of the main parameters of the system and the excitation frequencies of the operating modes by analyzing them.The results of numerical calculations1. It has been clarified that in the third zone of nonlinear dynamic systems operating at excitation frequencies, the maximum vibration amplitude does not always correspond to the excitation frequency; 2. It is shown that only the vibration amplitudes that correspond to the excitation frequency of the dynamic system can be reduced with the help of a damper. By damping the amplitudes of other frequencies significantly higher than the system's excitation frequency, we will only increase the vibration level in the system;3. The developed diagram of the dependence of the vibration level on the system excitation frequency and force magnitude is essentially a passport of the newly designed nonlinear dynamic system.