-
Paper Information
- Paper Submission
-
Journal Information
- About This Journal
- Editorial Board
- Current Issue
- Archive
- Author Guidelines
- Contact Us
American Journal of Computational and Applied Mathematics
p-ISSN: 2165-8935 e-ISSN: 2165-8943
2021; 11(2): 42-50
doi:10.5923/j.ajcam.20211102.03
Received: Jun. 28, 2021; Accepted: Jul. 26, 2021; Published: Aug. 15, 2021

Agent-Based Model for Proteins Interaction inside Cancer Cell
 Abstract
 Reference
 Full-Text PDF
 Full-text HTML
Samira Zouhri1, Mohcine El Baroudi2, Smahane Saadi1
1Faculty of Sciences Ben M'sik, Hassan II University, Casablanca, Morocco
2Faculty of Sciences Ain Chock, Hassan II University, Casablanca, Morocco
Correspondence to: Samira Zouhri, Faculty of Sciences Ben M'sik, Hassan II University, Casablanca, Morocco.
| Email: |  |
Copyright © 2021 The Author(s). Published by Scientific & Academic Publishing.
This work is licensed under the Creative Commons Attribution International License (CC BY).
http://creativecommons.org/licenses/by/4.0/

Cancer is a major health issue, it presents a serious threat to human life. A deep understanding of tumor cell development, genetic mutations in cancerous cell and its biological behaviour remains a persistent need. Many scientific researches suggest that the changes in genes and their proteins expression inside a tumor cell play a crucial role in stimulating the cell division (metastasis) or in restraining its division and reducing its aggressiveness. Agent-based models are computer models that aim to capture the behaviour of individuals inside an environment, they provide a practical setting for studying complex systems. We develop an agent- based model to describe the interaction between 6 agents that represent 6 types of proteins inside a tumor cell and the effect of their exchange on tumor cell motility and metastasis. The simulation results shed light on the circumstance in which the cancerous cell has a great chance to divide and multiply.
Keywords: Cancer, Agent Based Model, Netlogo, Gene regulatory network, Protein interaction
Cite this paper: Samira Zouhri, Mohcine El Baroudi, Smahane Saadi, Agent-Based Model for Proteins Interaction inside Cancer Cell, American Journal of Computational and Applied Mathematics , Vol. 11 No. 2, 2021, pp. 42-50. doi: 10.5923/j.ajcam.20211102.03.
Article Outline
1. Introduction
- Cancer is the second leading cause of death in the world, it kills around 10 million per year. Almost one in six deaths worldwide is due to cancer in 2020 (World health organization march 2021). Decreasing the number of cancer deaths requires a deep understanding of the behaviour and growth of cancerous tumors, and an improvement of treatment strategies. For this reason, several scientific investigations in all fields have been conducted to understand the biological mechanisms of cancer and to find better ways to prevent and treat this disease.In recent decades, thanks to mathematics especially mathematical modelling via computer simulation, it became possible to study phenomena that are too big, too small, or too dangerous to study in a laboratory and to provide answers to clinicians in less time and at less cost than lab experiment. Two approaches have been used in Mathematical models to describe the cancer growth: the continuous models [1,2], and the discrete models [3-7] which may use the agent-based models (ABM).Agent-based model (ABM) is a computer model that consists of a collection of agents or variables that can take on a finite collection of states. The state of an agent at any given time is determined by a set of rules that describe the agent's interaction with other agents. These rules can be deterministic or stochastic. The state of an agent depends on its previous state and on the state of a collection of agents with whom it interacts.The agent based models are a means of computational analysis for complex systems for which the theoretical analysis is too difficult. They offer a powerful approach for the study of the microscopic aspects of a tumor [6,7], since each cell is modeled individually, which makes it possible to take into account the different interactions at the cellular level. The distinction between ABM and any numerical scheme with a discrete space is the complexity of the system which is modeled with ABM from a microscopic level, the level of cell-cell interactions and rules that provide a physical interpretation, the global dynamics emerge from the local interactions of the agents. Whereas in a numerical scheme, the complexity of the system is a result of a mapping from a high mathematical abstraction level to a simple form. The ABM may be used as an alternative approach to model and simulate systems where partial differential equations (PDEs) become difficult to solve.Many complex biological systems can be modeled via ABM as multi-agent systems in which the micro-entities interact and change with each other over discrete time steps and give rise to macro-system [8,9]. The micro-entities, called "agents", are anything that changes its behavior in response to input from other agents and form the environment [10]. For a model that include a large numbers of agents and states, each agent can be in one state and interact with each other and their environment based on a set of deterministic or stochastic rules. The major intention of this work is to further develop an ABM to study the local exchanges between 6 types of proteins inside a cancer cell and the effect of their actions and interactions on tumor cell motility and metastasis.The paper is organized as follows: in “ABM Model” section we present a biological background of the genes involved in tumor progression or suppression and how their expression is regulated. In “Agent-based Simulation” section, simulation and results are developed. Finally, in “Discussion” section we discuss the main obtained results.
2. ABM Model
2.1. Biological Background
- Tumor progression is a complex process governed by a series of genetic and epigenetic events involving alterations in many oncogene and / or tumor suppressor. Genetic alterations include point mutations, deletions, and chromosomal translocations and amplifications, while epigenetic alterations include DNA methylations or a change in the genomic fingerprinting [11]. This genomic instability leads to changes in cell signaling, cell cycle progression and gene expression, which increases the unlimited replication potential of cells, the resistance to cell death and senescence, the angiogenesis and therefore the appearance of metastases [12]. These changes involve the activation of oncogenes, the inactivation of tumor suppressor genes and DNA repair genes. A key gene in this process is the tumor suppressor gene P53.Under physiological or low stress conditions the tumor suppressor protein P53 plays a central role in the defense of cell integrity. It can act as a transcription factor by binding specifically to the regulatory regions of genes that it controls their expression, stimulating the expression of a large number of genes involved in apoptosis or cell cycle arrest or DNA repair and protecting the organism against the spread of potentially tumor-precursor cells [13]. This explains the correlation that exists between cancer and inactivation of P53, in fact the P53 gene is mutated in 50% of human cancer cases [14] and in the other 50% the protein is inactive by various cellular or viral antagonists including MDM2 gene [14,15]. When the cell is under stress (stress caused by: DNA damage, genotoxic agents, activation of oncogenes, hypoxia) the P53 undergoes post-translational modifications which make it more active and can reach 24 hours half-life instead of around 20 minutes in an untransformed cell. In addition, the concentration of the P53 protein can be of the order of 15 to 20 times its normal concentration. The activation of P53, in the context of these stresses, can generate a series of responses [16,17], the two most studied mechanisms are: In order to repair the damage, the activation of P53 induces a transient arrest of cell proliferation. Once the repair is done the level of P53 returns to normal and the cell cycle resumes its activity. When this damage cannot be repaired the activation of P53 leads to an irreversible arrest of cell proliferation called senescence or to a cell death. It is noticeable that when P53 is activated, it acquires the right to life or death of the cell by inducing the arrest of the cell's cycle or the initiation of the apoptotic process. This is why under normal conditions, the level of P53 in normal cells is subject to strict control by its major inhibitor, MDM2 gene, which, by binding on P53 transactivation domain, inhibit its transactivation function [18] and ensure its transport from the nucleus to cytoplasm [19] where it will be degraded by the proteosome [20]. The relationship between MDM2 and P53 is not unidirectional. Despite the down regulation of P53 by MDM2, P53 regulates positively MDM2 by acting as a transcription factor on the MDM2. This relationship between MDM2 and P53 forms a negative feedback loop and clarify the simple aspect of this relationship which is included in a complex regulatory network involving many other cellular actors, particularly in the case of cellular stress. In tumors that overexpress MDM2, the P53 is constitutively inhibited and tumor growth is promoted. The inactivation of MDM2 in tumors activates P53 and induces senescence or apoptosis.In certain human tumors, the increasing level of MDM2 expression may also arise from control mechanisms of the translation of MDM2 transcripts. This mechanism of control involves in particular certain microRNAs (MIRNAs) which form part of a group of non-coding RNAs that have been identified as key elements in the regulation of gene expression.In [21,22] authors show that some MIRNAs are also regulated by P53, such as MIR145 and MIR-200. In [23] it is indicated that P53 could increase MIR-145 expression by directly binding to the P53 response elements-2 (P53RE-2) in the MIR-145 promoter. In [24] authors show that P53 is a transcriptional activator of the MIR-200 gene. Which means that P53 activate MIR-200 and MIR-145. The MIR-145 regulate in an indirect way the P53's activity by inhibiting the translation of MDM2 [47] which increase the level of expression of P53 and its activity.Cancer stem cells (CSCs) has a central role in tumor spread and resistance. Many new anti-cancer therapies are evaluated based on their ability to eradicate tumors. However, if the therapies are not killing the cancer stem cells, the tumor will soon grow back and develops such resistance to the previously used treatment. One mechanism that gives rise to the formation of cancer stem cells (CSCs) is the Epithelial-mesenchymal transition (EMT) which is a key process in tumor progression and metastasis. Among the stem cell genes involved in this process are the Zinc-finger E-box binding protein (ZEB) and Octamer-binding transcription factor 4 (OCT4). The ZEB gene promote EMT [25], while OCT4 is involved in the genesis of pluripotent stem cells [26]. The ZEB proteins have been implicated in many human malignancies, for example the ZEB2 is up-regulated in advanced stages of ovarian, pancreatic and gastric cancer [27-29]. The ZEB1 has been associated with colorectal tumors and uterine cancers [30].The tumor repressor gene P53 suppresses EMT by repressing the expression of ZEB and OCT4 through MIR200 and MIR145 [31]. The MIR-200 and ZEB repress the expression of each other and are linked in a reciprocal feedback loop [48]. The same goes for MIR145 and OCT4 and MIR145 and ZEB. The OCT4 directly activates MIR200 by Binding at Promoter Regions [32]. There are also self-activations for certain genes, such as for P53, ZEB, and OCT4. All these genes interactions are represented in Figure 1 for the gene regulatory network, based on [33], including 6 nodes (genes) and 16 edges (7 activation regulations and 9 repression regulations).
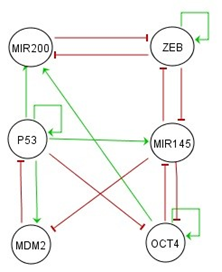 | Figure 1. The diagram for the gene regulatory network. Green lines represent activation regulations and red lines represent repression regulations |
3. Agent-Based Simulation
- Our simulations are implemented in NetLogo software platform which is a multi-agent programmable modeling environment for agent-based model development.
3.1. Mapping Time and Space
- We have 6 agents modelling 6 types of cell proteins moving around a NetLogo's grid, which represents a space inside a tumor cell, at a speed of one patch per time step. We need to map the time and space in our model to the physical time and space. Proteins don't have the same diameter, their diameter varies according to their shape and if they have or not an irregular surface [34]. For this reason, we have supposed that all the proteins have a simplest shape and a same diameter and we have calculated an average value of 5.4 nm, based on [34], which represents the physical diameter of proteins in real life. A distance of 1 in our simulation space corresponds to 5.4 nm. As for time, we supposed that each time step of our simulation corresponds to 1 minute. The mapped time and space are defined as follow:


3.2. Movement Speed
- Molecules move with an incredible speed due to the thermal motion. For example, a small molecule such as glucose moves around a cell at about 250 miles per hour, while a large protein molecule moves at 20 miles per hour [35]. Note that these are the real speeds inside the cell, not the scaled speeds. We have 20 miles per hour =
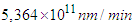 .If we want to convert this real speed to the Netlogo speed, we will deal with a speed of
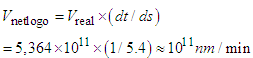 Which is extremely huge to be simulated. For this reason, we'll slow down the movement of proteins and we consider that they move at
  .
.3.3. The Protein's Half-Life
- The half-life of a protein is the time it takes to lose half of its specific activity due to the denaturation and the inactivation. The half-lives for different proteins in the cell may range from minutes to days [36]. The P53 has a very short half-life of
 in most cell's type [37], and it can reach 24 hours half-life when activated. The half-life of OCT4 is 7.34h [38], while the MIRNAs are very stable and have a half-life of 120h [39]. Some MIRNAs have, in particular physiological or pathological situations, much shorter half-lives and an increased rate of degradation [40]. The ZEB has half-lives of 44 h to 68 h [41]. The MDM2 has a half-life of approximately 25min [42]. The half-life of each protein in our simulation is considered as the time needed for each protein to become inactive (degradation). We will simulate the protein activation by increasing the protein's half-life, and we will simulate the protein repression by deactivating the protein.
3.4. The Update Rules
- We describe all the agents and their interactions by means of rules derived from the biological background paragraph. The Figure 1 summarizes the main logical interactions, each vertex represents an agent and edges connect pairs of agents who could interact. At each step of the simulation and according to the agent's closest neighbors, each agent will be activated or degraded depending on the agent that is interacting with it. A protein is considered in contact with another if they are on neighboring patches or if they are within a radius of 5.4 nm of each other. Note that, this corresponds to a distance of 1 patch.
3.5. The Duration of Protein-Protein Binding
- Interactions between proteins can be stable or transient. Based on the work in [43], for each pair of interacting protein chains, the interaction can be determined whether it was transient or permanent. Indeed, if two proteins have different SwissProt / UniProt codes, it can be assumed that they are functional on their own (not obligatory complex) and they are considered to have a transient interaction. Conversely, if two proteins have the same SwissProt / UniProt code, they have been studied as a single biological element (obligatory complex) and can be considered to interact permanently. Stable interactions involve proteins that interact for a long time, while a protein in transient interactions, may interact briefly and in a reversible manner with other proteins.We have no information, in our knowledge, about the exact time a protein spends binding to another protein before resuming its motion. In our simulation, it is assumed that a protein stops moving for 1 minute once it is in contact with another protein and may interact with one protein in the same time. We will simulate the protein interactions by using a link between 2 proteins. A link will be created between 2 proteins when the distance requirement is met, and we will give the link between 2 proteins a property “protein-name1/protein-name2-binding” which would monitor the time left before the protein is free from the other.
4. Results
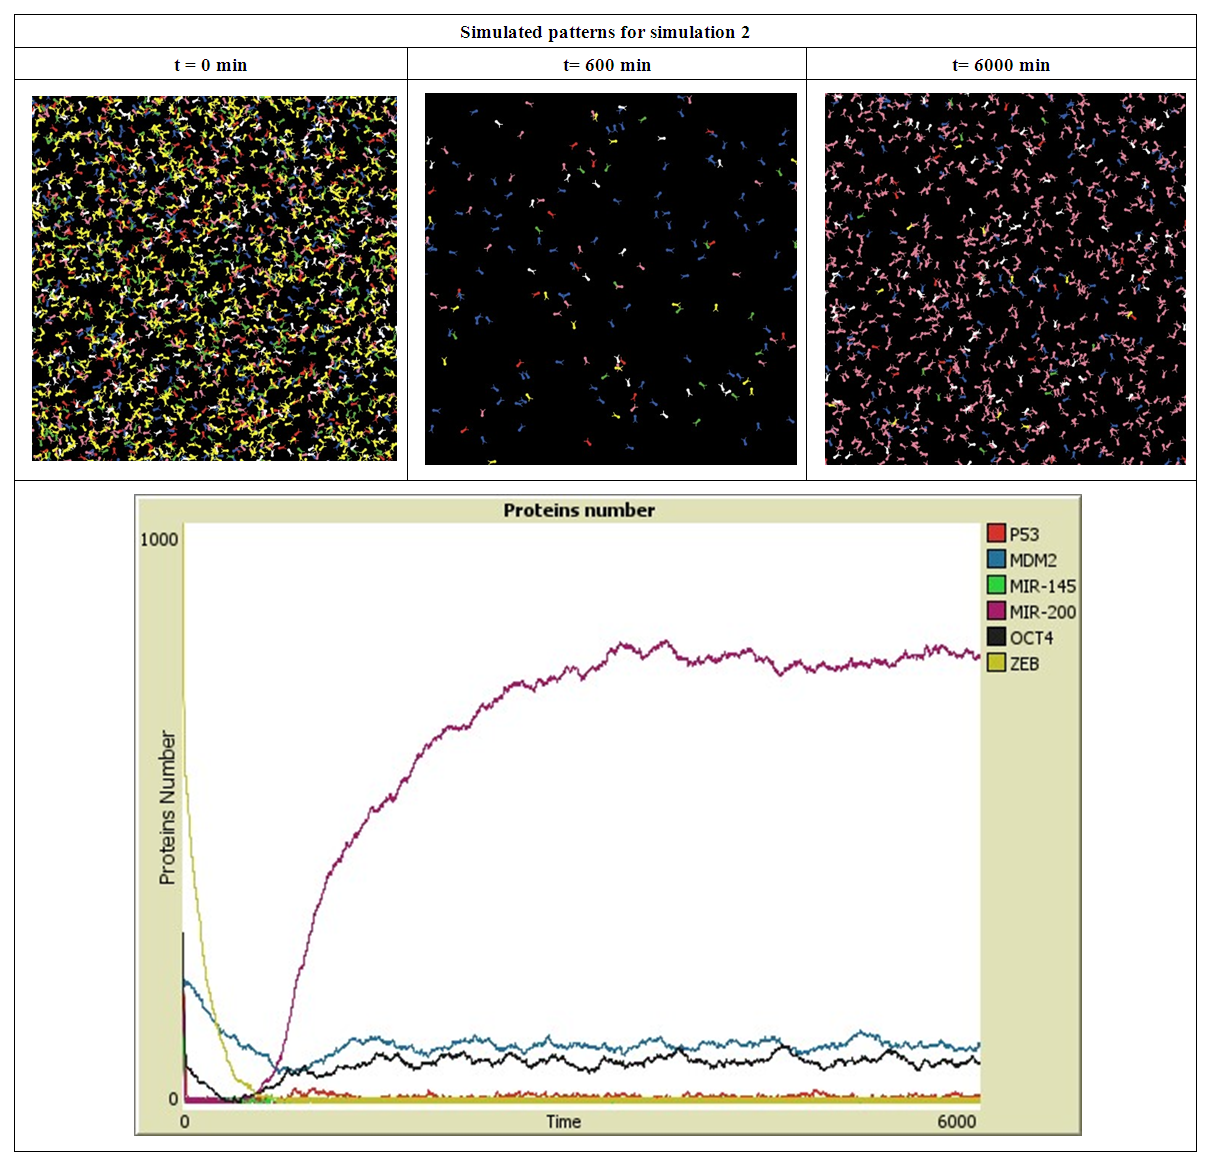
- The simulation starts with a same number of proteins: P53, MDM2, MIR-145, MIR-200, OCT4 and ZEB. These proteins interact with each other during 6000 minutes. In the first simulation, presented in Figure 2, the number of MDM2, OCT4, ZEB, P53, MIR-145 and MIR-200 has significantly decreased during the first 20 minutes, this is due to their down-regulation by P53, MIR145, MIR200, MDM2, (ZEB or OCT4) and ZEB respectively.
 | Figure 2. Simulated proteins interaction inside a tumor cell.   |
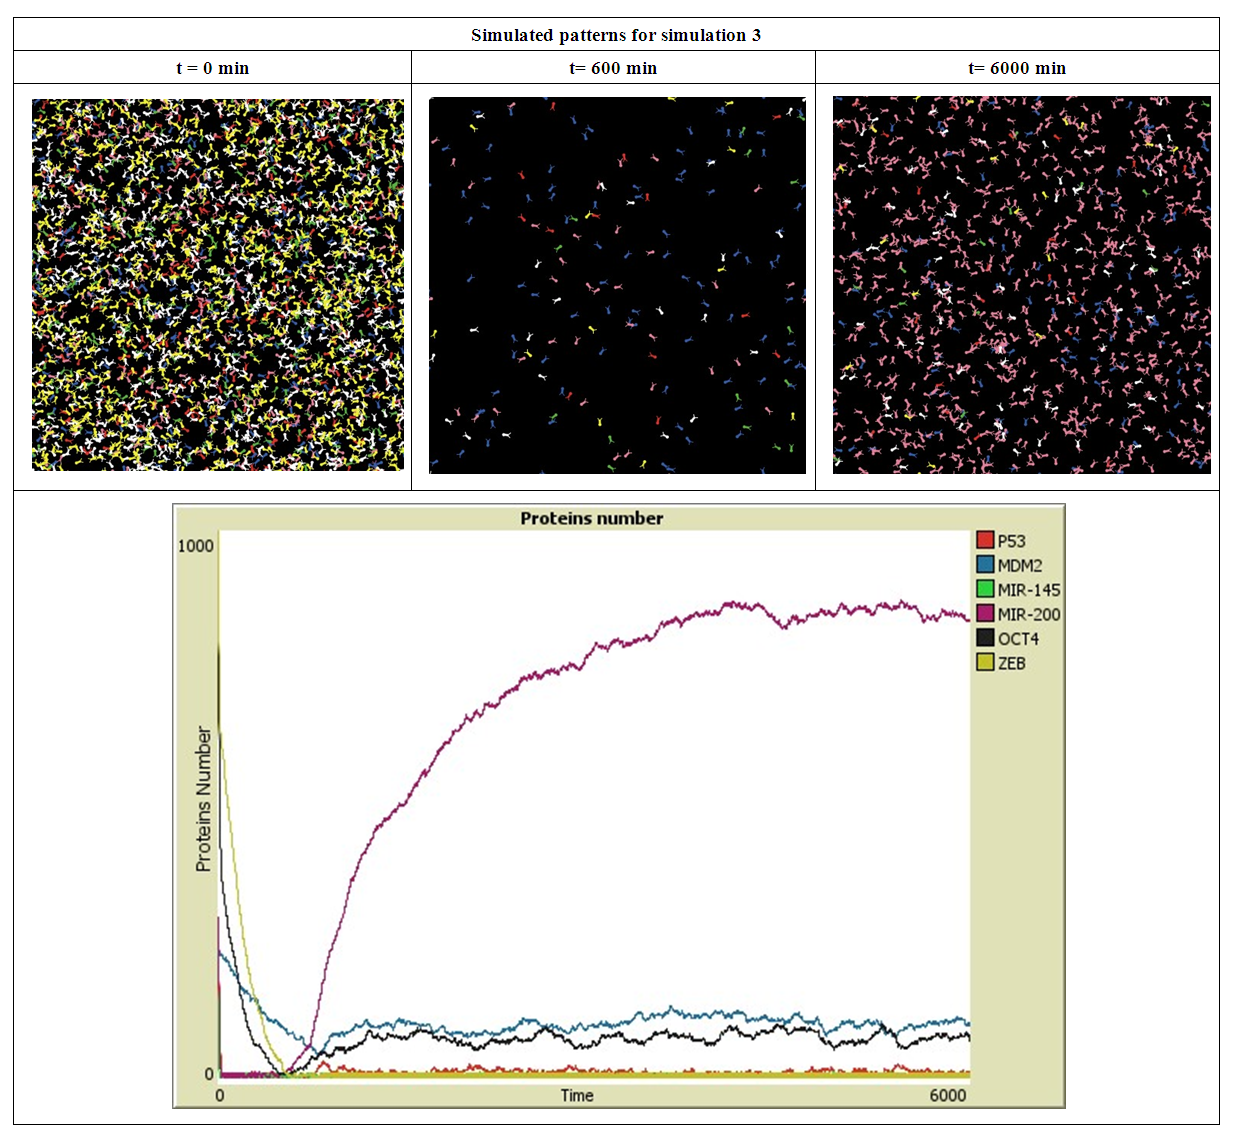
 | Figure 3. Simulated proteins interaction inside a tumor cell.   |
 | Figure 4. Simulated proteins interaction inside a tumor cell.   |
5. Discussion
- The inhibition of MIR200 reduced the expression of the calcium-dependent, epithelial cell adhesion molecule E-cadherin, whose decreased expression has been linked with tumor dedifferentiation and lymph node metastases development in clinical studies with multiple carcinomas and in an established human cancer cell line [44]. This diminution in E-cadherin increased expression of Vimentin protein and induced EMT via suppression of ZEB1 and ZEB2 [45,46]. For this reason the ZEB proteins number in our simulation was under a tight control of MIR200 which is in good agreement with results in [44]. Conversely, increasing MIR200 levels leads to the mesenchymal-to-epithelial transition (MET), the reverse process of (EMT), in established human cancer cell lines, which minimize their aggressiveness and reduce the motility of cancer cells [44].Taken together, these results and observations have confirmed that the MIR200 family plays major roles in the metastatic cascade by down-regulating the expression of important players involved in angiogenesis.Among the advantages of ABM over other modeling techniques is its ability to capture emergent phenomena, the simple behaviors induced by the agents rules at the micro scale generate complex behaviors at the macro scale. The emergent behavior in our results was that of MIR200 after reducing the ZEB number, the MIR200 number continue to increase progressively and reached high value.
6. Conclusions
- We have developed an agent based model to study the interaction between 6 agents that represent 6 types of proteins inside a cancer cell and the effect of their exchange on tumor cell motility and metastasis.In the presence of a same high number of each protein type, it has taken a few minutes to down regulating the most proteins. During these few minutes the cancer cell has a high probability to migrate and proliferate which leads to metastasis, however the repression of the proteins ZEB and OCT4 by MIR200 and MIR145 prevents this from happening. For this reason, the MIR200 proteins have been remained activated to reduce the cancer cell aggressiveness.When ZEB proteins are presented in the highest number compared with the other type proteins, the down regulation mechanism applied between proteins has took a longer duration to achieve proteins degradation especially for ZEB proteins. In this case, there is a long period of time to initiate the release of EMT signals, and start tumor cells by giving rise to the EMT transcription factors. Once the ZEB protein has been repressed by MIR200 and MIR145, the MIR200 has been activated in order to launch the MET and prevent cancer cell motility.The OCT4 proteins do not have an activation impact on MIR200 when ZEB proteins are presented in high number.
ACKNOWLEDGEMENTS
- FundingNo funding or sponsorship was received for the publication of this article.Conflicts of InterestSAMIRA ZOUHRI, MOHCINE ELBAROUDI and Smahane SAADI declare that they have no conflict of interest.