Haruna Issaka1, Oluwole Daniel Makinde2, David Mwangi Theuri3
1Department of Applied Mathematics, Pan Africa University, Institute of Basic Science, Technology and Innovation, Kenya
2Faculty of Military Science, Stellenbosch University, South Africa
3Faculty of Mathematics, Jomo Kenyatta University of Agriculture, Kenya
Correspondence to: Haruna Issaka, Department of Applied Mathematics, Pan Africa University, Institute of Basic Science, Technology and Innovation, Kenya.
| Email: |  |
Copyright © 2019 The Author(s). Published by Scientific & Academic Publishing.
This work is licensed under the Creative Commons Attribution International License (CC BY).
http://creativecommons.org/licenses/by/4.0/

Abstract
In this paper we provide a model to describe the dynamics of the species of the ecosystem before and after it has been raided by a bad competing specie. The competing specie invades the native plants for nutrition, carbon dioxide and space. This affects the population of the native species of the ecosystem. We shall consider the effect of this invasion on the dynamics of the native species and the bird population. The essential mathematical features of the present model have been analyzed thoroughly for both local and global stability. We show that the dynamical outcomes of the interactions among the species are much sensitive to the system parameters and initial population densities. Numerical simulations are performed in order to validate the applicability of the model under consideration.
Keywords:
Ecological Modeling, Wetland Invasion, Invading Specie
Cite this paper: Haruna Issaka, Oluwole Daniel Makinde, David Mwangi Theuri, Behavior of Interacting Species in Ecosystem Invaded by Bad Biomass: Case Study of Keta Ecosystem of Ghana, American Journal of Computational and Applied Mathematics , Vol. 9 No. 4, 2019, pp. 102-109. doi: 10.5923/j.ajcam.20190904.02.
1. Introduction
The ecosystem is one of the major source of salt production in the country providing source of employment and livelihood for majority of the inhabitants around the wetland. There are seasonal in-flows of sea water during high tides from the ocean and from rivers such as the Aka river from the north. This inflows helps to maintain water levels to support plants and fish growth. Population growth, human activities such as farming, cutting of wood for fuel and climate change has contributed to the reduction of volume of water retention in the lagoon. In addition, there is also the case of invasion by competing plant species which has displaced a substantial volume of native plants. The invasive species, Spartina Alterniflora, is also taking up which was covered by the mangroves which further enhances the depletion of the ecosystem.This invasive species is not consumed by the birds and spreads at a faster rate compared to the growth of the mangroves due to it being monocotyledonous and shallow rooted. Extensive study of wetlands in Ghana done by [1] [6] has shown that both physical and natural activities have threatened the survival of wetlands in Ghana and therefore efforts to effectively and efficiently maintain the wetland must be implemented to avoid a complete extinction of the wetland. Both traditional and scientific efforts have been employed to control the depletion of wetlands in Ghana [6]. A wetland consisting of a good biomass, bad biomass and bird population was considered by [11] with Keoladeo national park of India as a case study. In conclusion, they observed that parameter values had a role in determining the dynamics of the wetland. Rai [9] suggested that to ensure good health of the keoladeo national park of India, a constant removal of the bad biomass should be encouraged by allowing harvesting by surrounding communities. The invasive specie spread by first invading as a non-harmful plant, gradually spread and compete with the native plants and eventually displacing the native plants completely [4], [5]. When life of good biomass is affected negatively, so does the fish and bird population [8] [10]. A reduction in concentration of dissolved oxygen reduces fish and animal population as well as revenue through tourism, depletion of the wetland, drying up of surrounding water bodies amongst the list of associated problems. Ali and Vijayan [2] observed that if the invaded species is removed by any means and the area left to fallow, the species grows again after some time. They therefore suggested a continuous effort in eliminating the bad biomass.In this paper, we study the interaction between species of the ecosystem using the Beddington- denAgelis functional response and the effect of the invasion on the native plants and by extension to the bird population. Equilibrium points are established and subsequently stability of these equilibrium points if any, examined both locally and globally.
2. The Model Setup
We consider the Keta-Anlo wetland comprising of Prey density (good biomass) G(t) and birds population (predator) P(t). The good biomass consist of accumulation of vegetation, crawling and flying insects that can be consumed by the predator. The good biomass grows by the logistics equation whiles the bird population only grows as a result of the amount of the good biomass consumed as food. The predator feeds on the the prey by the Beddington-deAgeles functional response 3.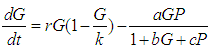 | (1) |
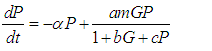 | (2) |
where  for all
  is the growth rate of good biomass
  is the carrying capacity,
  is the rate of capture of prey by predator,
  is the handling time of predator,
  is the rate of competition among predators,
  is the natural death of predators and
  measures the predator’s efficiency to convert prey into fertility (reproductivity).
3. Existence and Boundedness of Model
The system has three ecologically feasible equilibrium points namely  ,
,  and
and  . Obviously,
  and
and  will always exist. Existence of
  : At equilibrium we have from 1 and 2
 | (3) |
 | (4) |
From 4, we obtain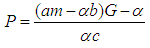 | (5) |
Substituting 5 into 3 and solving for  gives
gives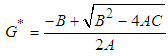 where
where 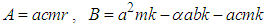 , and
, and  .
. is positive since
  .Knowing the positive value of
  , we calculate the positive value
  from 5.
4. Stability Analysis
Local StabilityWe examine the stability of the system by determining the Jacobian matrix of the system evaluated at each of the equilibrium points. The nature of the eigen values (real part of eigen values) of the Jacobian matrix defines the nature of the stability. The matrix associated with the system is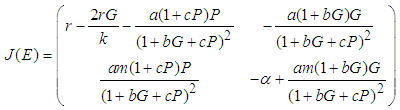
 : The eigen values at
  are
are  and
and  , which is a saddle point and hence has an unstable manifold.
 : Suppose
  is the equilibrium point of
  for
for  , then the characteristic equation is
 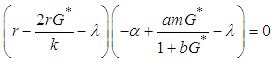 | (6) |
 and
and 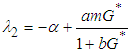 . We can therefore state the following theorem:Theorem 1: The equilibrium point
  is locally asymptotically stable if
  ie if
ie if  and
and  ie
ie  .Theorem 2. The equilibrium point
  is unstable if any of
  and
and  is positive or both are positive.Coexistence Equilibrium
  : Suppose the equilibrium point evaluated at
  is
is  and using the trace-determinant approach of matrix solution to systems of equations, the characteristic equation of the Jacobian matrix evaluated at
  is
is  where
where 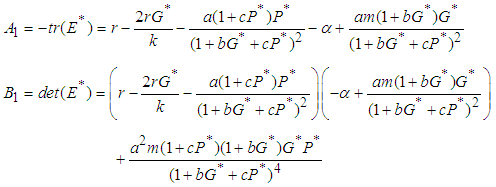 By yhe Routh-Hurwitz criterion, the eigen values of the system posses negative real parts if
  and
and  .We therefore state the following prepositions:Proposition 1: The equilibrium point
  is locally asymptotically stable if
  and
and  .Proposition 2: The equilibrium point
  is unstable if
  and
and  .Proposition 3: The equilibrium point
  is a saddle if either of
  or
or  .
.
5. Global Stability
 Theorem 1: The equilibrium point
  is globally asymptotically stable if
  .Proof: We define a continuously measurable lyapunov function
  , on
, on  by the positive definite function:
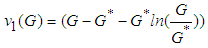 . We need to show that
  and by inspection, for
  Next we show that
 Hence
Hence  is negative definite on condition that
  .
. : We define a function
  where
where  is a suitable positive constant. Differentiating
  with respect to
  , along the solution set of 1 and 2
 Simplifying,
 We see that
  is negative definite if
  .
.
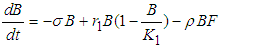
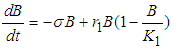
6. Invasive Equation
 | (7) |
 | (8) |
 | (9) |
7. Existence of Equilibrium
The feasible equilibrium points are  and
and  But
But  and
and  have been proven already and
  is an obvious equilibrium point. We therefore proof for
  and
and  .
. : For the equilibrium point of
  , the system reduces to
 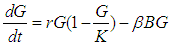 | (10) |
 | (11) |
Solving 10 and 11, we get 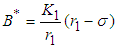 and
and  .
.  is positive if
  , ie if the growth rate of the bad biomass is more than the death rate. Similarly,
  is positive if
  . Thus
  exist.
 : We consider systems 7,8 and 9. From 9 we have
 | (12) |
and from 8 we have | (13) |
Substituting 12 and 13 into 7 and solving for  , we get
 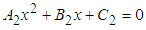 where
where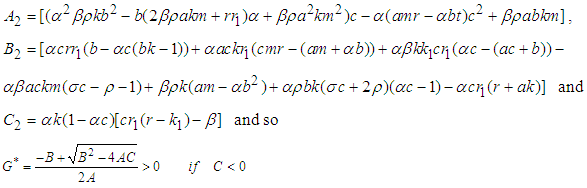 ,If the positive value of
  is known, then the positive values of
  and
and  can be calculated from 12 and 13 respectively.
8. Stability Analysis
Local Stability: Suppose the equilibrium point of the system is  . We construct the Jacobian matrix for the system at the equilibrium point as shown:
 | (14) |
Stability of  : At this point we assume the only competing species are the good biomass and the bad biomass. The eigen-values corresponding to this equilibrium point are 0,
  and
and  . Hence
  is a saddle (unstable) point.Stability of
  : From 14, the Jacobian matrix
  of the equilibrium point
  of the system has components
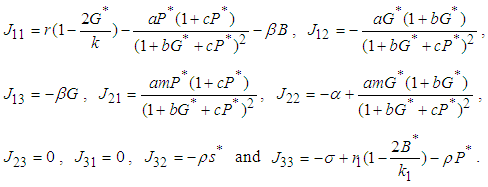 The characteristic equation of the Jacobian matrix above, after simplification is given by
 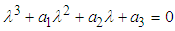 where
where 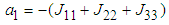
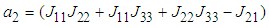 and
and  .Implementing the Routh-Hurwitz criteria for stability of equilibria, it follows that
  has negative eigen values if the following conditions hold:
 and
and  . These conditions can be verified with ease and so we conclude that all the eigen values of the Jacobian are negative and hence the system is locally asymptotically stable about the equilibrium point
9. Global Stability
We study the global stability of the system by defining a suitable positive definite lyaponuv function on it. Theorem 2: Let 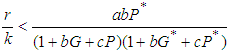 , then
  is globally stable.proof: We define a positive definite function about the equilibrium point
  by
by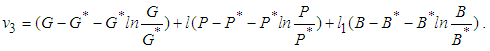 which upon further simplification we obtain
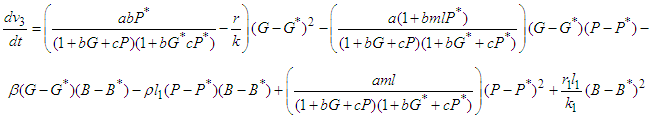 This expression can be written in the form
  where
where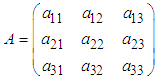 with entries
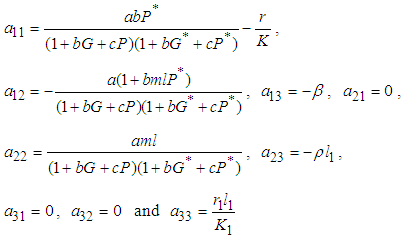
 is negative definite if the following conditions hold:
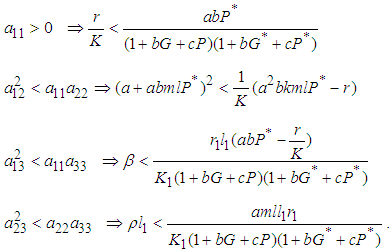 In addition to the above conditions, we choose
  and
and  . Hence the system is globally stable.
10. Numerical Simulations
In this section, simulations for systems 1, 2, 7, 8 and 9 are carried out using both MATLAB R2018a and MAPLE 2018a to support the theoretical results obtained in the analytical analysis of the systems equations. With the parameter values below, the following deductions are made.In figure  , it is observed that the growth of the good biomass is steady until it reaches the carrying capacity
  of the ecosystem then becomes stable whereas the bird population grows exponentially. From figure
  , the ecosystem is sustainable whenever the growth rate
  of the good biomass is kept within a certain threshold. It is seen the the growth of good biomass dwindles or slows down when
  and the growth rises when
  . At this point, the good biomass is likely to approach the carrying capacity faster.
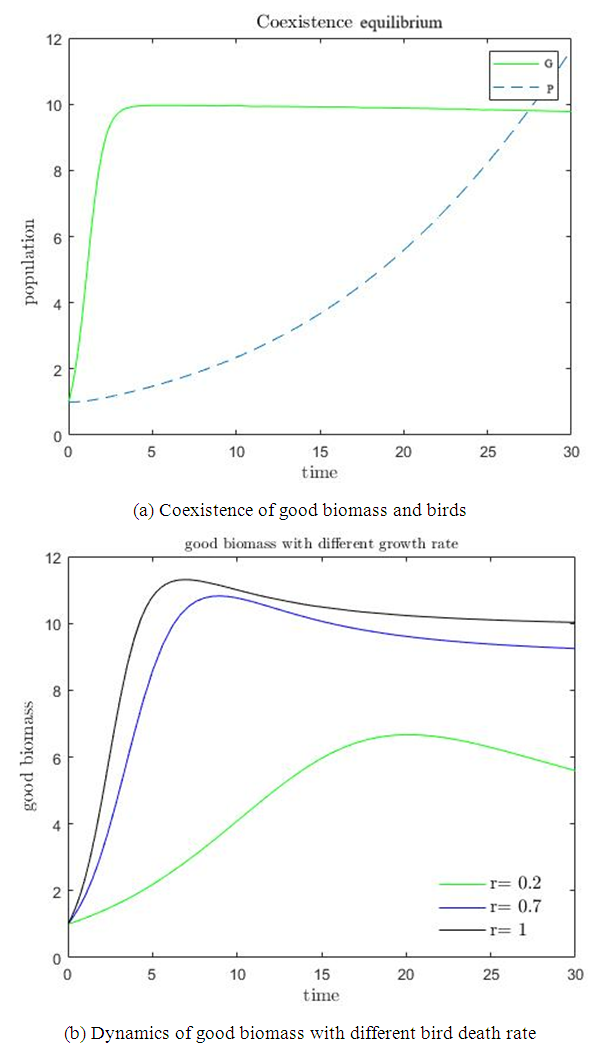 | Figure 1 |
It is also observed in figure  that if the rate of capture of the good biomass by the birds
  is high, there is a decline in the growth of the good biomass owing to the fact that more good biomass is converted as food by the birds. As a consequence, the per capita growth of the good biomass must be greater than
  . Similarly, if the death rate alpha of the birds is high, there is a decline in growth of the bad biomass and hence good biomass growth rises as shown in figure
  .
.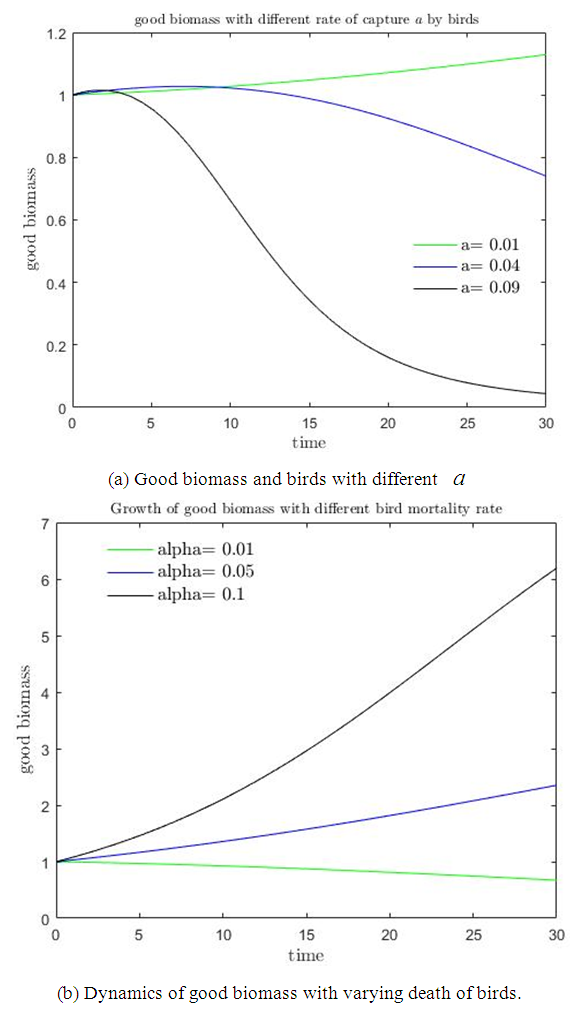 | Figure 2 |
After the ecosystem is invaded, the whole dynamics of the ecosystem changes. At this point, the following is worth noting: i. The system is said to be in good state if both the good biomass  and bird population
  maintains high densities above the invasive bad biomass
  . ii. The system is said to be in bad state if the densities of either
  or
or  or both is less compared to the bad biomass
  .For the values of parameters given above, the behavior of the system is indicated in figure
  . The figure shows a growth in the good biomass experiencing a sharp decline in growth then attains a stable growth over a period of time. The bad biomass initially shows a slow growth then subsequently increases growth exceeding the good biomass and maintains a steady growth for some time. The bird population on the other hand shows a slow exponential growth. This change in dynamics is due to competition for food, oxygen, space etc. between good and bad biomass, a reduction in the consumption of birds due to low capture rate
  of good biomass. Figure
  shows the state of bad biomass with different growth rate
  . It is observed that the bad biomass density increases with increasing growth rate
  . A rise in the density of bad biomass is a reduction in the density of good biomass.
 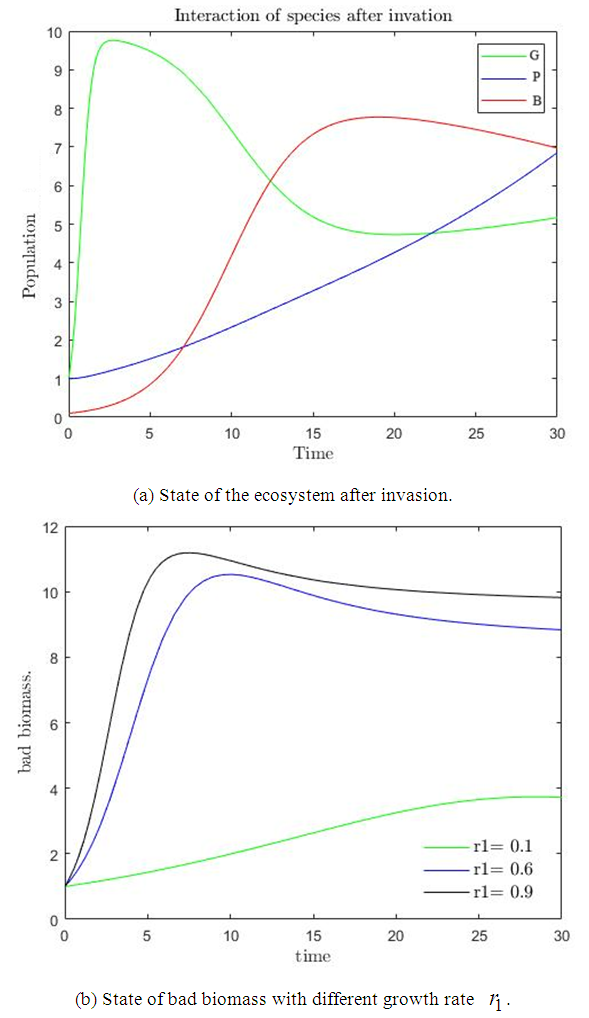 | Figure 3. State of ecosystem after invasion and with different growth rate of bad biomass |
The growth is initially seen to be slow due to death as a result of interacting with bird population. To improve growth in good biomass, control on the quarantined areas from interacting with bird population and bad biomass must be improved.
11. Discussions and Conclusions
In this chapter, we propose a mathematical model to study an ecosystem which has been invaded by a competing specie. The dynamics of the species of an ecosystem is studied for both before and after invasion. The ecosystem comprises of primary producers (plants and other animals) collectively called good biomass  and birds population
  .The good biomass population is the source of primary food production for the bird population in the ecosystem. The good state of the good biomass means the growth and survival of the bird population. We assume that the good biomass grows logistically and bird population feeds on the good biomass by the Beddington deAngelis functional response. The continuous existence of the bird population is dependent on the continuous growth of the good biomass. It is observed that the bird population will continue to exist as long as the intrinsic growth rate of the good biomass is greater than the rate at which the bird population feed on the good biomass. We showed that the positive equilibrium points are both locally and globally asymptotically stable under some desirable conditions. Due to the boundedness of the good biomass, the growth of the bird population is limited to the amount of good biomass present. To maintain a continues coexistence between the species, the growth rate of the good biomass must be kept within a certain range. From numerical simulation results, we observed that the system enjoyed a state of coexistence if the growth rate
  . This means that
  should be maintain at or above the critical point 0.7. In a similar manner, we saw that the reproductive rate of birds be kept and maintained below the critical point. The ill state of the wetland was evident in the simulation results. The densities of the good biomass was greatly affected and in the long term affected the growth of birds. Upon an implementation of the control mechanisms, an improvement in the growth of both the good biomass and the bird population was observed. The control mechanism is through the effort of quarantine
  , treatment
  which could be physical approach, biological or the use of chemicals, and prevention of the spread
  . In conclusion, the proposed model exposes us to the dynamics of the interacting species in the wetland ecosystem when parameters of the interacting species are varied. Conditions for feasible equilibrium are proposed as well as local and global stability examined for the equilibrium points obtained.
References
| [1] | M. Affam and D. Asamoah. Economic potential of salt mining in ghana towards the oil find. research journal of environmental and earth sciences. |
| [2] | S. Ali and V. Vijayan. Keoladeo national park ecology study summary report 1980–1985. Bombay Natural History Society, Bombay, India, 1986. |
| [3] | M. Fan and Y. Kuang. Dynamics of a nonautonomous predator–prey system with the beddington–deangelis functional response. Journal of Mathematical Analysis and Applications, 295(1): 15–39, 2004. |
| [4] | Z.-M. Ge, H.-Q. Guo, B. Zhao, and L.-Q. Zhang. Plant invasion impacts on the gross and net primary production of the salt marsh on eastern coast of china: insights from leaf to ecosystem. Journal of Geophysical Research: Biogeosciences, 120(1): 169–186, 2015. |
| [5] | B. A. L. S. C. Lishawa and N. H. Buck. Wetland invasion by typhau˜glauca increases soil. Soil Sci Plant Nutr, 53:353–361, 2016. |
| [6] | Y. NTIAMOA-BAIDU, T. Piersma, P. Wiersma, M. Poot, P. Battley, and C. Gordon. Water depth selection, daily feeding routines and diets of waterbirds in coastal lagoons in ghana. Ibis, 140(1):89–103, 1998. |
| [7] | A. Patra, J. Tushar, and B. Dubey. Modeling and simulation of a wetland park: An application to keoladeo national park, india. Mathematics and Computers in Simulation, 134:54–78, 2017. |
| [8] | M. Perry and A. Deller. Waterfowl population trends in the chesapeake bay area. 1995. |
| [9] | V. Rai. Modeling a wetland system: the case of keoladeo national park (knp), india. ecological modelling, 210(3): 247–252, 2008. |
| [10] | A. K. Sakai, F. W. Allendorf, J. S. Holt, D. M. Lodge, J. Molofsky, K. A. With, S. Baugh- man, R. J. Cabin, J. E. Cohen, N. C. Ellstrand, et al. The population biology of invasive species. Annual review of ecology and systematics, 32(1): 305–332, 2001. |
| [11] | R. K. Upadhyay, V. Rai, and S. Tiwari. Modeling wetland systems of keoladeo national park (knp), india: the role of space. Wetlands ecology and management, 22(6):605–624, 2014. |

 Abstract
 Reference
 Full-Text PDF
 Full-text HTML