| [1] | Z.Y. Algamal, M.H. Lee, Penalized logistic regression with the adaptive LASSO for gene selection in high-dimensional cancer classification, Expert. Syst. Appl., 42 (2015) 9326–9332. |
| [2] | S. Guo, D. Guo, L. Chen, Q. Jiang, A centroid-based gene selection method for microarray data classification, J. Theor. Biol., 400 (2016) 32-41. |
| [3] | J.G. Liao, K.-V. Chin, Logistic regression for disease classification using microarray data: model selection in a large p and small n case, Bioinformatics, 23 (2007) 1945-1951. |
| [4] | H.-Y. Peng, C.-F. Jiang, X. Fang, J.-S. Liu, Variable selection for Fisher linear discriminant analysis using the modified sequential backward selection algorithm for the microarray data, Appl. Mathem. Comput., 238 (2014) 132-140. |
| [5] | Z.Y. Algamal, M.H. Lee, Regularized logistic regression with adjusted adaptive elastic net for gene selection in high dimensional cancer classification, Comput. Biol. Med., 67 (2015) 136-145. |
| [6] | A. Ben Brahim, M. Limam, A hybrid feature selection method based on instance learning and cooperative subset search, Pattern. Recognit. Lett., 69 (2016) 28-34. |
| [7] | S. Korkmaz, G. Zararsiz, D. Goksuluk, Drug/nondrug classification using Support Vector Machines with various feature selection strategies, Comput. Methods. Programs. Biomed., 117 (2014) 51-60. |
| [8] | L. Zhang, L. Qian, C. Ding, W. Zhou, F. Li, Similarity-balanced discriminant neighbor embedding and its application to cancer classification based on gene expression data, Comput. Biol. Med., 64 (2015) 236-245. |
| [9] | Y. Chen, L. Wang, L. Li, H. Zhang, Z. Yuan, Informative gene selection and the direct classification of tumors based on relative simplicity, BMC Bioinformatics, 17 (2016) 44-57. |
| [10] | Z. Mao, W. Cai, X. Shao, Selecting significant genes by randomization test for cancer classification using gene expression data, J. Biomed. Inform., 46 (2013) 594-601. |
| [11] | W.H. Chan, M.S. Mohamad, S. Deris, N. Zaki, S. Kasim, S. Omatu, J.M. Corchado, H. Al Ashwal, Identification of informative genes and pathways using an improved penalized support vector machine with a weighting scheme, Comput. Biol. Med., 77 (2016) 102-115. |
| [12] | M.F. Misman, W.H. Chan, M.S. Mohamad, S. Deris, A hybrid of SVM and SCAD with group-specific tuning parameters in identification of informative genes and biological pathways, in: J. Li, L. Cao, C. Wang, K.C. Tan, B. Liu, J. Pei, V.S. Tseng (Eds.) Trends and Applications in Knowledge Discovery and Data Mining: PAKDD 2013 International Workshops: DMApps, DANTH, QIMIE, BDM, CDA, CloudSD, Gold Coast, QLD, Australia, April 14-17, 2013, Revised Selected Papers, Springer Berlin Heidelberg, Berlin, Heidelberg, 2013, pp. 258-269. |
| [13] | Z.X. Yin, S.Y. Li, Interactive web service system for exploration of biological pathways, Artif. Intell. Med., 62 (2014) 61-72. |
| [14] | X. Chen, Adaptive elastic-net sparse principal component analysis for pathway association testing, Stat. Appl. Genet. Mol. Biol., 10 (2011) 1-23. |
| [15] | M. Kanehisa, S. Goto, KEGG: kyoto encyclopedia of genes and genomes, Nucleic acids research, 28 (2000) 27-30. |
| [16] | R.M. Luque-Baena, D. Urda, M. Gonzalo Claros, L. Franco, J.M. Jerez, Robust gene signatures from microarray data using genetic algorithms enriched with biological pathway keywords, J. Biomed. Inform., 49 (2014) 32-44. |
| [17] | Z.Y. Algamal, M.H. Lee, Applying penalized binary logistic regression with correlation based elastic net for variables selection, J. Mode. Appl. Stat. Meth., 14 (2015) 168-179. |
| [18] | P. Drotar, J. Gazda, Z. Smekal, An experimental comparison of feature selection methods on two-class biomedical datasets, Comput. Biol. Med., 66 (2015) 1-10. |
| [19] | J. Kalina, Classification methods for high-dimensional genetic data, Biocybern. Biomed. Eng., 34 (2014) 10-18. |
| [20] | S. Ma, J. Huang, Penalized feature selection and classification in bioinformatics, Brief. Bioinform., 9 (2008) 392-403. |
| [21] | M.Y. Park, T. Hastie, Penalized logistic regression for detecting gene interactions, Biostatistics, 9 (2008) 30-50. |
| [22] | L. Shen, E.C. Tan, Dimension reduction-based penalized logistic regression for cancer classification using microarray data, IEEE Trans. Comput. Bi., 2 (2005) 166-175. |
| [23] | A.M. Al-Fakih, Z.Y. Algamal, M.H. Lee, H.H. Abdallah, H. Maarof, M. Aziz, Quantitative structure-activity relationship model for prediction study of corrosion inhibition efficiency using two-stage sparse multiple linear regression, Journal of Chemometrics, 30 (2016) 361-368. |
| [24] | A.M. Al-Fakih, M. Aziz, H.H. Abdallah, Z.Y. Algamal, M.H. Lee, H. Maarof, High dimensional QSAR study of mild steel corrosion inhibition in acidic medium by furan derivatives, International Journal of Electrochemical Science, 10 (2015) 3568-3583. |
| [25] | Z.Y. Algamal, Exponentiated exponential distribution as a failure time distribution, IRAQI Journal of Statistical science, 14 (2008) 63-75. |
| [26] | Z.Y. Algamal, Paired Bootstrapping procedure in Gamma Regression Model using R, Journal of Basrah Researches, 37 (2011) 201-211. |
| [27] | Z.Y. Algamal, Diagnostic in Poisson regression models, Electronic Journal of Applied Statistical Analysis, 5 (2012) 178-186. |
| [28] | Z.Y. Algamal, Using maximum likelihood ratio test to discriminate between the inverse Gaussian and gamma distributions, International Journal of Statistical Distributions, 1 (2017) 27-32. |
| [29] | Z.Y. Algamal, H.T.M. Ali, An efficient gene selection method for high-dimensional microarray data based on sparse logistic regression, Electronic Journal of Applied Statistical Analysis, 10 (2017) 242-256. |
| [30] | Z.Y. Algamal, H.T.M. Ali, Bootstrapping pseudo - R2 measures for binary response variable model, Biomedical Statistics and Informatics, 2 (2017) 107-110. |
| [31] | Z.Y. Algamal, M.H. Lee, Penalized logistic regression with the adaptive LASSO for gene selection in high-dimensional cancer classification, Expert Systems with Applications, 42 (2015) 9326-9332. |
| [32] | Z.Y. Algamal, M.H. Lee, Regularized logistic regression with adjusted adaptive elastic net for gene selection in high dimensional cancer classification, Computers in Biology and Medicine, 67 (2015) 136-145. |
| [33] | Z.Y. Algamal, M.H. Lee, Penalized Poisson regression model using adaptive modified elastic net penalty, Electronic Journal of Applied Statistical Analysis, 8 (2015) 236-245. |
| [34] | Z.Y. Algamal, M.H. Lee, High dimensional logistic regression model using adjusted elastic net penalty, Pakistan Journal of Statistics and Operation Research, 11 (2015) 667-676. |
| [35] | Z.Y. Algamal, M.H. Lee, Adjusted adaptive lasso in high-dimensional Poisson regression model, Modern Applied Science, 9 (2015) 170-176. |
| [36] | Z.Y. Algamal, M.H. Lee, Applying penalized binary logistic regression with correlation based elastic net for variables selection, Journal of Modern Applied Statistical Methods, 14 (2015) 168-179. |
| [37] | Z.Y. Algamal, M.H. Lee, A new adaptive L1-norm for optimal descriptor selection of high-dimensional QSAR classification model for anti-hepatitis C virus activity of thiourea derivatives, SAR and QSAR in Environmental Research, 28 (2017) 75-90. |
| [38] | Z.Y. Algamal, M.H. Lee, A.M. Al-Fakih, High-dimensional quantitative structure-activity relationship modeling of influenza neuraminidase a/PR/8/34 (H1N1) inhibitors based on a two-stage adaptive penalized rank regression, Journal of Chemometrics, 30 (2016) 50-57. |
| [39] | Z.Y. Algamal, M.H. Lee, A.M. Al-Fakih, M. Aziz, High-dimensional QSAR prediction of anticancer potency of imidazo[4,5-b]pyridine derivatives using adjusted adaptive LASSO, Journal of Chemometrics, 29 (2015) 547-556. |
| [40] | Z.Y. Algamal, M.H. Lee, A.M. Al-Fakih, M. Aziz, High-dimensional QSAR modelling using penalized linear regression model with L1/2-norm, SAR and QSAR in Environmental Research, 27 (2016) 703-719. |
| [41] | Z.Y. Algamal, M.H. Lee, A.M. Al-Fakih, M. Aziz, High-dimensional QSAR classification model for anti-hepatitis C virus activity of thiourea derivatives based on the sparse logistic regression model with a bridge penalty, Journal of Chemometrics, 31 (2017) 1-8. |
| [42] | Z.Y. Algamal, M.K. Qasim, H.T.M. Ali, A QSAR classification model for neuraminidase inhibitors of influenza A viruses (H1N1) based on weighted penalized support vector machine, SAR and QSAR in Environmental Research, (2017) 1-12. |
| [43] | M.A. Kahya, W. Al-Hayani, Z.Y. Algamal, Classification of breast cancer histopathology images based on adaptive sparse support vector machine, Journal of Applied Mathematics & Bioinformatics, 7 (2017) 49-69. |
| [44] | V. Bolón-Canedo, N. Sánchez-Maroño, A. Alonso-Betanzos, An ensemble of filters and classifiers for microarray data classification, Pattern Recognition, 45 (2012) 531-539. |
| [45] | I. Guyon, A. Elisseeff, An introduction to variable and feature selection, J. Mach. Learn. Res., 3 (2003) 1157-1182. |
| [46] | A.J. Ferreira, M.A.T. Figueiredo, Efficient feature selection filters for high-dimensional data, Pattern. Recognit. Lett., 33 (2012) 1794-1804. |
| [47] | Q. Mai, H. Zou, The Kolmogorov filter for variable screening in high-dimensional binary classification, Biometrika, 100 (2013) 229-234. |
| [48] | J. Li, Y. Wang, Y. Cao, C. Xu, Weighted doubly regularized support vector machine and its application to microarray classification with noise, Neurocomputing, 173 (2016) 595-605. |
| [49] | L.J. Tang, J.H. Jiang, H.L. Wu, G.L. Shen, R.Q. Yu, Variable selection using probability density function similarity for support vector machine classification of high-dimensional microarray data, Talanta, 79 (2009) 260-267. |
| [50] | L. Wang, J. Zhu, H. Zou, Hybrid huberized support vector machines for microarray classification and gene selection, Bioinformatics, 24 (2008) 412-419. |
| [51] | H.H. Zhang, J. Ahn, X. Lin, C. Park, Gene selection using support vector machines with non-convex penalty, Bioinformatics, 22 (2006) 88-95. |
| [52] | M. Kumar, S. Kumar Rath, Classification of microarray using MapReduce based proximal support vector machine classifier, Knowl.-Based. Syst., 89 (2015) 584-602. |
| [53] | X. Peng, D. Xu, L. Kong, D. Chen, L1-norm loss based twin support vector machine for data recognition, Inform. Scienc., 340-341 (2016) 86-103. |
| [54] | N. Becker, G. Toedt, P. Lichter, A. Benner, Elastic SCAD as a novel penalization method for SVM classification tasks in high-dimensional data, BMC bioinformatics, 12 (2011) 138-151. |
| [55] | J. Bi, K.P. Bennett, M. Embrechts, C. Breneman, M. Song, Dimensionality reduction via sparse support vector machines, J. Mach. Learn. Res., 3 (2003) 1229-1243. |
| [56] | Y. Liu, H. Helen Zhang, C. Park, J. Ahn, Support vector machines with adaptive Lq penalty, Comput. Stat. Data. Anal., 51 (2007) 6380-6394. |
| [57] | Z. Liu, S. Lin, M.T. Tan, Sparse support vector machines with Lp penalty for biomarker identification, IEEE Trans. Comput. Bi., 7 (2010) 100-107. |
| [58] | C. Park, K.-R. Kim, R. Myung, J.-Y. Koo, Oracle properties of SCAD-penalized support vector machine, J. Stat. Plan. Infer., 142 (2012) 2257-2270. |
| [59] | J. Zhu, S. Rosset, T. Hastie, R. Tibshirani, 1-norm support vector machines, Adv. Neural. Inf. Process. Syst., 16 (2004) 49-56. |
| [60] | Y. Cui, C.H. Zheng, J. Yang, W. Sha, Sparse maximum margin discriminant analysis for feature extraction and gene selection on gene expression data, Comput. Biol. Med., 43 (2013) 933-941. |
| [61] | V. Pappua, O.P. Panagopoulosb, P. Xanthopoulosb, P.M. Pardalosa, Sparse proximal support vector machines for feature selection in high dimensional datasets, Expert. Syst. Appl., 42 (2015) 9183–9191. |
| [62] | S.K. Shevade, S.S. Keerthi, A simple and efficient algorithm for gene selection using sparse logistic regression, Bioinformatics, 19 (2003) 2246-2253. |
| [63] | R. Tibshirani, Regression shrinkage and selection via the lasso, J. Roy. Statist. Soc. Ser. B, 58 (1996) 267-288. |
| [64] | J. Fan, R. Li, Variable selection via nonconcave penalized likelihood and its oracle properties, J. Amer. Statist. Assoc., 96 (2001) 1348-1360. |
| [65] | H. Zou, T. Hastie, Regularization and variable selection via the elastic net, J. Roy. Statist. Soc. Ser. B, 67 (2005) 301-320. |
| [66] | H. Zou, The adaptive lasso and its oracle properties, J. Amer. Statist. Assoc., 101 (2006) 1418-1429. |
| [67] | V. Vapnik, The nature of statistical learning theory, Springer Science & Business Media, New York, NY, USA, 1995. |
| [68] | S. Maldonado, R. Montoya, J. López, Embedded heterogeneous feature selection for conjoint analysis: A SVM approach using L1 penalty, Appli. Intellig., (2016). |
| [69] | P.S. Bradley, O.L. Mangasarian, Feature selection via concave minimization and support vector machines, in: ICML, 1998, pp. 82-90. |
| [70] | K. Ikeda, N. Murata, Geometrical properties of Nu support vector machines with different norms, Neur. comput., 17 (2005) 2508-2529. |
| [71] | C. Liao, S. Li, Z. Luo, Gene selection using Wilcoxon rank sum test and support vector machine for cancer classification, in: Y. Wang, Y.-m. Cheung, H. Liu (Eds.) Computational Intelligence and Security: International Conference, CIS 2006. Guangzhou, China, November 3-6, 2006. Revised Selected Papers, Springer Berlin Heidelberg, Berlin, Heidelberg, 2007, pp. 57-66. |
| [72] | H. Park, Y. Shiraishi, S. Imoto, S. Miyano, A novel adaptive penalized logistic regression for uncovering biomarker associated with anti-cancer drug sensitivity, IEEE Trans. Comput. Bi., (2016). |
| [73] | T.R. Golub, D.K. Slonim, P. Tamayo, C. Huard, M. Gaasenbeek, J.P. Mesirov, H. Coller, M.L. Loh, J.R. Downing, M.A. Caligiuri, C.D. Bloomfield, E.S. Lander, Molecular classification of cancer: class discovery and class prediction by gene expression monitoring, Science, 286 (1999) 531-537. |
| [74] | D. Singh, P.G. Febbo, K. Ross, D.G. Jackson, J. Manola, C. Ladd, P. Tamayo, A.A. Renshaw, A.V. D'Amico, J.P. Richie, E.S. Lander, M. Loda, P.W. Kantoff, T.R. Golub, W.R. Sellers, Gene expression correlates of clinical prostate cancer behavior, Cancer Cell, 1 (2002) 203-209. |
| [75] | D.G. Beer, S.L. Kardia, C.-C. Huang, T.J. Giordano, A.M. Levin, D.E. Misek, L. Lin, G. Chen, T.G. Gharib, D.G. Thomas, Gene-expression profiles predict survival of patients with lung adenocarcinoma, Nat. Med., 8 (2002) 816-824. |

 Abstract
 Reference
 Full-Text PDF
 Full-text HTML

 , with only a few samples,
  , making the gene expression dataset matrix has rows less than columns,
  [17-20]. Over the last two decades, gene selection has received increasing attention, motivated by the desire to understand structure in the high-dimensional gene expression datasets. With these types of datasets, typically many genes are irrelevant and redundant which could potentially vitiate the classification performance. Accordingly, it is preferred to reduce the dimensionality of these datasets. Reduction of the dimensions is often achieved by gene selection, which is maintaining a direct relationship between a gene and a classification performance [21-43].According to the mechanism of selection, gene selection methods, in general, can be classified into three categories: filter methods, wrapper methods, and embedded methods [44-46]. Filter methods are one of the most popular gene selection methods, which are based on a specific criterion by gaining information of the each gene. These methods are work separately and they are not dependent on the classification method. For the wrapper methods, on the other hand, the gene selection process is based on the performance of a classification algorithm to optimize the classification performance. In embedded methods, gene selection process is incorporated into the classification methods, which can perform gene selection and classification simultaneously [47]. These methods provide higher computational efficiency comparing with the wrapper methods [46]. Support vector machine is a widely-used classification method in different classification areas, especially in gene expression data classification [48-51]. As the number of the genes increases, the training time of applying support vector machine increases and also its computational complexity increases [52, 53]. Unfortunately, support vector machine cannot automatically handle gene selection although it has been proven advantageous in handling gene expression data classification [51, 54-59]. Sparse methods are very effective embedded gene selection methods, which connected with many popular classification methods including support vector machine logistic regression, and linear discriminate analysis [60-62]. In recent years, sparse support vector machine as among all the classification methods, those based on sparseness, received much attention. It combines the standard support vector machine with a penalty to perform gene selection and classification simultaneously. With deferent penalties, several sparse support vector machine can be applied, among which are, L1-norm, which is called the least absolute shrinkage and selection operator (lasso) [63], smoothly clipped absolute deviation (SCAD) [64], elastic net [65], and adaptive L1-norm [66]. Unquestionably, L1-norm is considered to be one of the most popular procedures in the class of sparse methods. Nonetheless, L1-norm applies the same amount of the sparseness to all genes, resulting in inconsistent gene selection [1, 5, 66]. To increase the power of informative gene selection association with incorporating pathway knowledge, in the present study, an efficient gene selection and pathway identification, which is based on the idea of sparse support vector machine combined with Wilcoxon rank sum test, is proposed. More specifically, Wilcoxon rank sum test is employed to weight each gene inside its pathway. On the other hand, a sparse support vector machine with weighted L1-norm is utilized, where each significant gene will be assigned a weight depending on the Wilcoxon rank sum test value inside its pathway that it is belonging to. This weight will reflect the importance amount of each gene. Experimentally, comprehensive comparisons between our proposed gene selection method and other competitor methods are performed depending on several well-known gene expression datasets. The experimental results prove that the proposed method is very effective for selecting the most relevant genes and pathway with high classification accuracy. The rest of this paper is organized as follows. Section 2 explains the preliminaries of sparse support vector machine. The proposed method with its related procedures is described in Section 3. Section 4 introduces the information of the experimental study. The experimental results on several benchmark gene expression datasets are presented in Section 5. Finally, Section 6 draws general conclusions.
  , where each column represents a gene and each row represents a sample (tissue) for tumor diagnosis. The numerical value of
  denotes the expression level of a specific gene
  in a specific sample
  . Given a training dataset
  , where
  represents a vector of the
  gene expression values, and
  for
for  , where
  indicates the
  sample is in class 1 (e.g., has cancer) and
  indicates the
  sample is in class 2 (e.g., dose not have cancer). Generally, the objective is to classify the new sample and identify the relevant genes with high classification accuracy. The classical SVM solves the optimization problem by minimizing
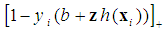 is the convex hinge loss, the scalar
  is denoted as the bias,
  is the L2-norm, and
  is the tuning parameter controlling the trade-off between minimizing the hyper-plane coefficients and the classification error. Equation (2) is a convex optimization problem and can be solved by the method of Lagrange multipliers [54]. The optimization solution can provide a unique solution for hyperplane parameters
  .Although SVM is a widely-used classification method in different classification areas, it cannot perform variable selection because of using L2-norm. This can be a downside when there are many irrelevant variables [51, 54, 56, 59, 68]. To overcome this limitation, those methods for simultaneous variable selection and classification are more preferable to achieve better classification accuracy with less important variables [56].For the purpose of variable selection, several variants of penalties are adopting with SVM. Bradley and Mangasarian [69] and Zhu, et al. [59] proposed using L1-norm instead of L2-norm of Eq. (1) to perform variable selection and binary classification. Ikeda and Murata [70], Liu, et al. [56], and Liu, et al. [57] proposed Lq-norm with
  . Furthermore, Zhang, et al. [51] proposed the smoothly clipped absolute deviation (SCAD) penalty of Fan and Li [64] with SVM. In addition, Wang, et al. [50] proposed a hybrid huberized SVM by using the elastic net penalty. Becker, et al. [54] proposed a combination of ridge and SCAD with SVM. Because of the singularity of the L1-norm, SVM with L1-norm can automatically select variables by shrinking the hyper-plane coefficients to zero [50, 54]. In addition, SCAD has the same behavior as L1-norm [54]. The SSVM with L1-norm (SSVM-lasso) and the SSVM with SCAD (SSVM-SCAD) are, respectively, defined as
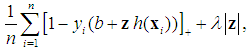
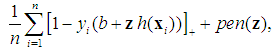
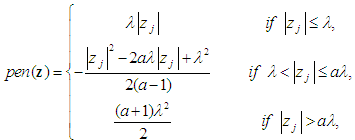
 are the hyper-plane coefficients,
  as suggested by Fan and Li [64], and
  is the tuning parameter.
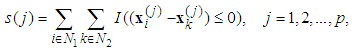
 is the discrimination function and it is defined as
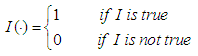
 is the expression value of the sample
  in the gene
  , and
, and  and
and  are the index sets of different classes of samples. Equation (5),
  , represents the measurement of the difference between the two classes. The gene
  can be considered important when Eq. (5) is close to 0 or when it is close to the max value of
  , where
  and
and  . Liao, et al. [71] quantify the gene significance by the following gene ranking criterion
 closed to 0 or to
  , will receive large value of
  , while an irrelevant gene will receive a small value of
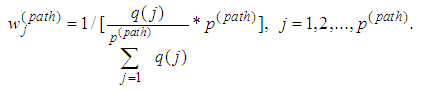
  . To enforce discriminative penalty on each gene according to importance degree in classification, Park, et al. [72] proposed the following weight
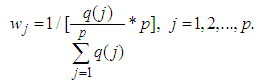
 , for each used classification method was fixed as
  . For the SCAD penalty, the constant
  was set to equal 3.7 as it suggested by Fan and Li [64]. The implementations of these used methods are provided in the R-package: penalized SVM.
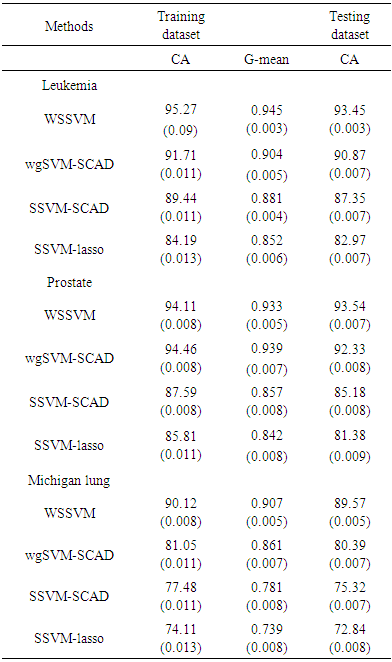
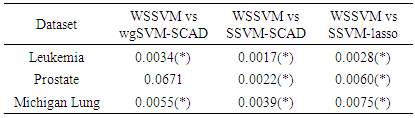
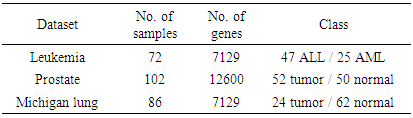
 . As shown in Table 3, the AUC of the proposed method is statistically significant better than those of wgSVM-SCAD, SSVM-SCAD, and SSVM-lasso in leukemia and Michigan lung datasets. In the prostate dataset, the proposed method has statistically significant AUC higher than those of SSVM-SCAD, and SSVM-lasso, while it has no statistically significant difference with wgSVM-SCAD.