-
Paper Information
- Paper Submission
-
Journal Information
- About This Journal
- Editorial Board
- Current Issue
- Archive
- Author Guidelines
- Contact Us
American Journal of Computational and Applied Mathematics
p-ISSN: 2165-8935 e-ISSN: 2165-8943
2017; 7(3): 65-70
doi:10.5923/j.ajcam.20170703.01

Availability Analysis of Regenerator System Using Markov Process Approach
Thangamani Gurunathan
Indian Institute of Management Kozhikode, Kunnamangalam, India
Correspondence to: Thangamani Gurunathan, Indian Institute of Management Kozhikode, Kunnamangalam, India.
| Email: |  |
Copyright © 2017 Scientific & Academic Publishing. All Rights Reserved.
This work is licensed under the Creative Commons Attribution International License (CC BY).
http://creativecommons.org/licenses/by/4.0/

This paper presents a systematic approach to estimate the availability of a subsystem called Regenerator (Rg) of a process plant. The study is a live case study at a Fluid Catalytic Cracking Unit (FCCU) of a refinery requiring high levels of availability for costeffective operation. The subsystem is modelled as Markov process, a method often used in the safety analysis of chemical process industries. Each component of a subsystem considered to be in one of the states: good, operating at reduced efficiency (due to partial failure) or under failure. More than one component may fail simultaneously due to common-cause failures. The Rg subsystem is modeled as a Markov process, using Chapman-Kolmogorov equations. A numerical evaluation of the Markov equations, assesses the characteristic safety parameters such as reliability and availability of the system. The steady state availability of the various states of the subsystem is obtained and a sensitivity analysis is also performed. The method promises to be useful for assessing the availability of any complex systems.
Keywords: Availability, Markov process, Process Plants, Common Cause failures
Cite this paper: Thangamani Gurunathan, Availability Analysis of Regenerator System Using Markov Process Approach, American Journal of Computational and Applied Mathematics , Vol. 7 No. 3, 2017, pp. 65-70. doi: 10.5923/j.ajcam.20170703.01.
Article Outline
1. Introduction
- Process plants are becoming larger and more sophisticated in terms of capital outlay as well as complexity. This makes it imperative for the plant to be operated safely and efficiently with high levels of availability. Since process plants are repairable systems, the analysis of shutdown data is essential for its reliability study. This information is useful for determining the availability of the system. However, such an analysis is not adequate for identifying the problem areas, investigating the causes of failures, testing various maintenance and replacement strategies and assessing the reliability of similar plants. Markov modelling will be more suitable for meeting such requirements.The literatures on reliability of chemicalsystems pertaining to refinery, ammonia plants, pressure tanks, boilers, mechanical seals and protective systems have been reviewed by [1]. A gate-by-gate method of Fault Tree (FT) quantification based on Markov processes was proposed by [2]. This method does not agree precisely with a full Markov analysis, but it appears to be at least as good an approximation as the PREP-KITT method of analysis. [3] developed a model, to handle dynamic features of the fault trees and their dependencies on the state of the system. The number of system states and the size of the transition matrix were considerably reduced using the concept of super-component. The dynamic behaviour intrinsic to the fault-recovery process of a non-repairable, fault-tolerant system cannot be accurately modeled by a FT. One solution to this problem is to convert the FT into a Markov chain and then add the dynamic fault/error handling behaviour to the latter. For this method of solution, an algorithm was developed by [4]. Some dynamic models for fault-tolerant computer systems were stated in [5]. [6] provided a preventive maintenance model for auxiliary components whose failures may not necessarily corresponds to system failure but rather to faster system degradation. Despite the vast literature on Markov models, there is a scarcity of reports on the applications of these models to practical situations. [7], [8] and [9] analysed the availability of the crystallizer system of a sugar plant using Markov process and the reliability of the feeding system in a paper industry. Though, they analysed the availability of subsystems, they have not considered the availability of the whole system. Such an analysis of the complete system is more relevant to reality and undoubtedly, more complex. A risk based stochastic modelling approach using a Markov decision process was investigated to assess availability of a processing unit by [10]. [11] suggested a methodology for availability evaluation of manufacturing system using semi-Markov model which had considered variable failure and repair rates. Availability analysis along with preventive maintenance programs to achieve target reliability was analysed by [12].A majority of models for estimation of availability of a complex system is based on the following assumptions:i) The component failure and repair properties are mutually independent. ii) The failure of the system is associated with a few states only. iii) The system does not face different operating conditions, repair actions and common-cause failures. In realities, this is often not the case. Therefore, it is necessary to construct more sophisticated models without such assumptions. Many interactions of component failures as well as subsystem failures can be modeled effectively by Markov processes, provided the failure and repair rates are time-independent. This paper presents one such study incorporating several real-life scenarios.The system taken up for study is the one described in Section 2. The organization of this paper is as follows: The system model, assumptions and notations are detailed in Section 2. A mathematical analysis is provided in Section 3. Numerical results along with discussions constitute Section 4. A summary is given in Section 5.
2. System Modelling
- The FCCU consists of four major sections, viz., i) feed preheat section, ii) reactor and regenerator section, iii) fractionator section and iv) gas concentration section. The fluid catalytic process is utilized to convert heavy gas oils into higher valued lighter products, by cracking in the presence of a catalyst, under appropriate conditions of temperature and pressure. The use of the catalyst promotes the cracking reaction at a lower temperature and pressure and yields products with more valuable properties than is possible with thermal cracking processes. A simplified schematic diagram for the reactor-regenerator system of the FCCU with its subsystems and components is shown in Figure 1. It is very difficult to cover the entire case study in a single paper and hence the scope of this paper is limited to regenerator subsystem only. The description of the regenerator subsystem follows.
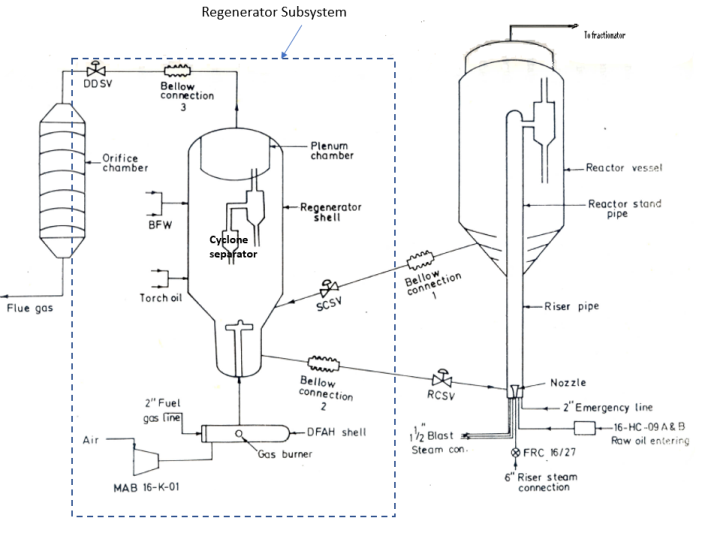 | Figure 1. The schematic diagram for the regenerator subsystem of the FCCU |
2.1. Regenerator
- The regenerator vessel houses a pair of twostage cyclone separators and an air distributor grid system for combustion air. Cokeladen catalyst from the reactor standpipe enters the regenerator above the airgrid. The catalyst in the reactor enters the regenerator overcoming the differential pressure between reactor and regenerator due to the its level head. Air is distributed through a pipe grid mounted at the bottom portion of the regenerator vessel. Combustion air to the regenerator is supplied by a motordriven rotary blower (MAB). Flue gases exit through the top of a cyclone separator to the orifice chamber through a Double Disc Slide Valve (DDSV). The regenerator temperature is maintained within permissible limits by providing torch oil for burning in the dense portion of the catalyst and boiler feed water spray in the vapour space of regenerator.A preliminary hazard analysis was conducted on the FCCU complex at the refinery. The procedure for identifying potentially high risk events was based on the analysis of data obtained from various sections in the refinery. After examining the P & I diagram and the process flow diagrams, the reactor-regenerator system was divided into 5 major subsystems which operate serially. For regenerator subsystem, the components that can cause unavailability are identified. It is clear, that accurate failure and repair data are required for a realistic estimation of the system availability. The data used in this model are taken from the published data [13] and [14] and also from the in-house records of the plant maintained by the company for their own use. We begin with the Markov formulation by designating all the possible states of the components.G : operating at the desired mannerR : partial failure, operating at reduced efficiencyF : under complete failure and is being repairedThe state of the subsystems can change with time because repair of failed units is undertaken. The state of the system depends upon its subsystems.
2.2. Assumptions
- The following assumptions are made for modelling and analysis of regenerator system.i) All component transition rates are constant over time.ii) All component states except those arising due to common cause failures are mutually independent.iii) A repaired unit is as good as new.iv) Sufficient repair facilities are available, i.e., repair begins immediately upon failure.v) Repair can also be by replacement.
2.3. Notations
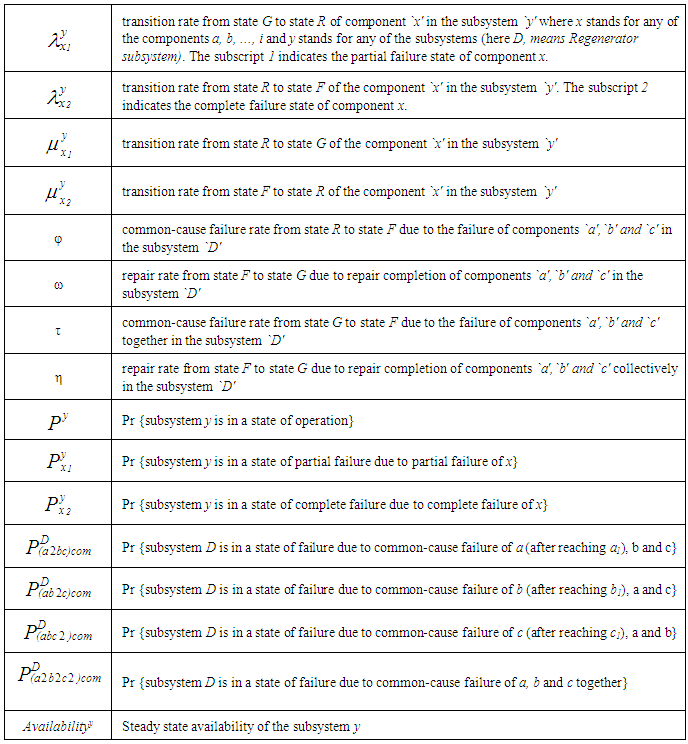
3. Mathematical Analysis
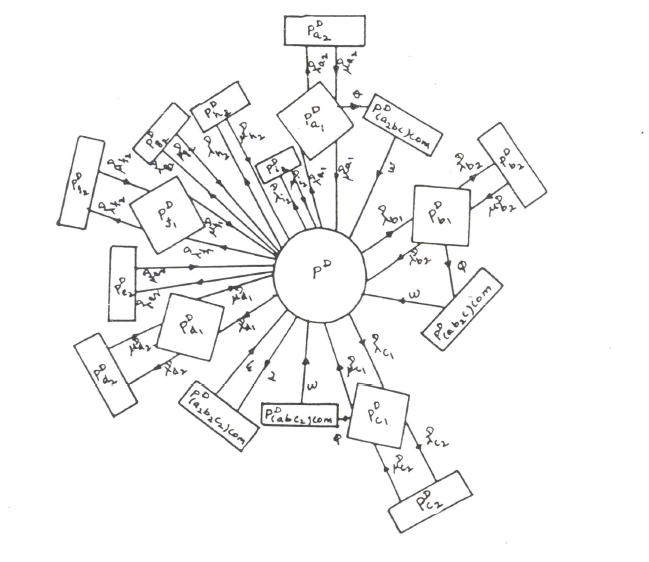 | Figure 2. State transition diagram for subsystem regenerator |
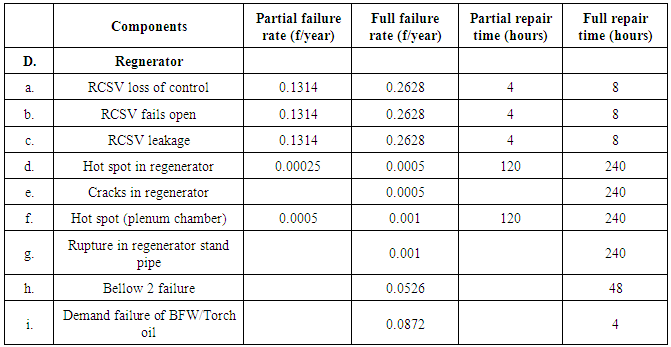
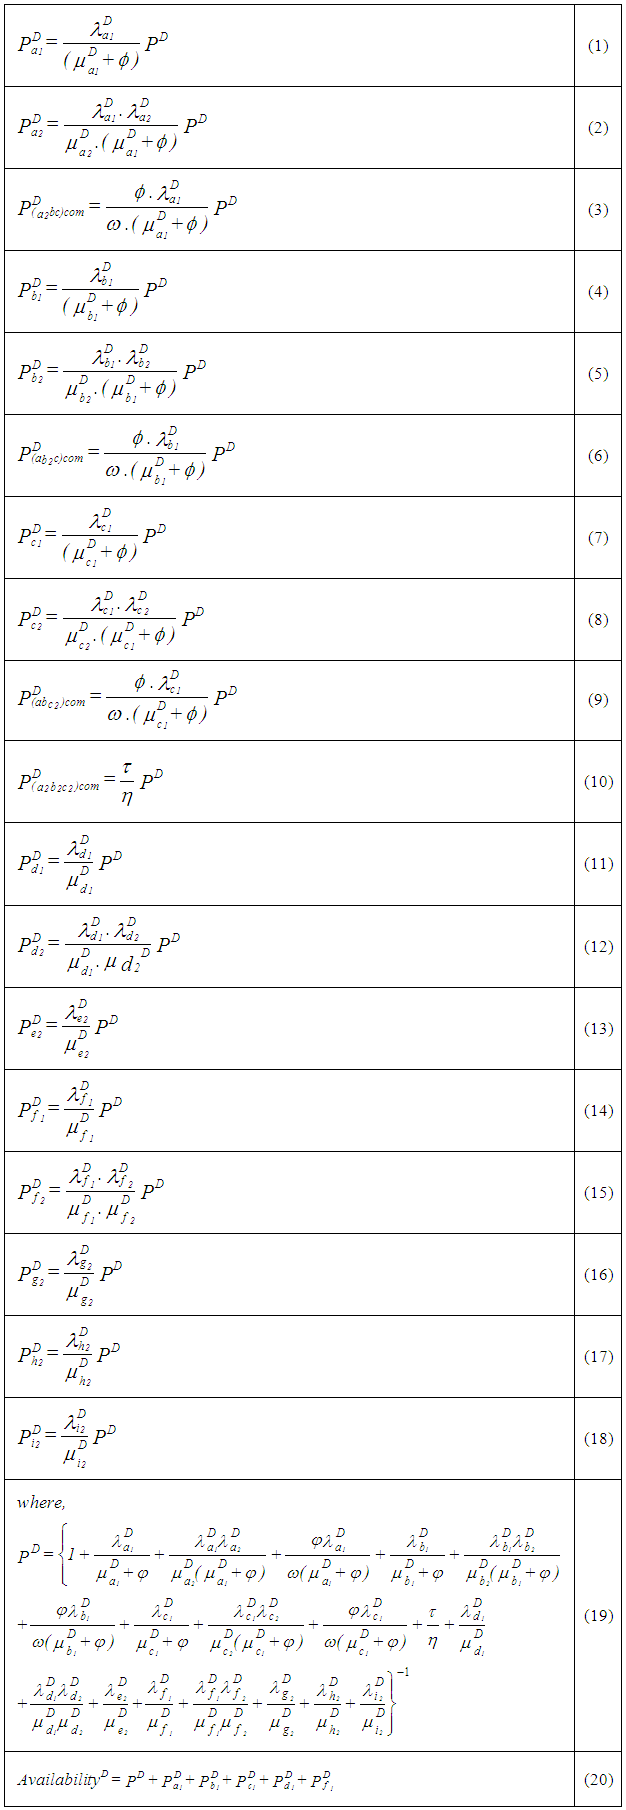 Equation 19 gives the steady state probability that the subsystem D is in state G, whereas Equations 1, 4, 7, 11 and 14 constitute the steady state probability that D is in state R. The various common-cause failure probabilities are given by Equations 3, 6, 9 and 10. The complete failure probabilities of D are given by Equations 2, 5, 8, 12, 13 and 15 to 18 and its steady state availability is determined by Equation 20. Table 1 gives the reliability data for all the components which are used in the assessment. Substituting these in the above equations, the availability is estimated. The estimated availability of the reactor-regenerator system under study is 0.999631.
|
4. Results and Discussion
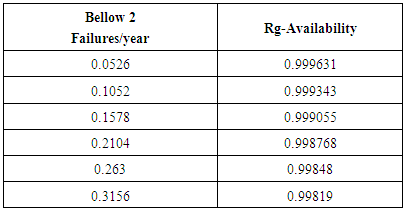
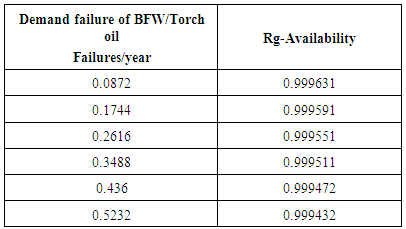
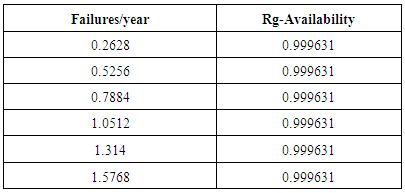
- Now the Markov model is used to study the effects of the failure rates of various components on the availability of the system. Tables 2 to 4 and Figures 3 to 5 show these effects. From Figure 3, it follows that the failure of the Bellow-2 has considerable effect on system shutdowns. It is also obvious that increase in the failure rate decreases the availability. Since Bellow-2 consists of several degrading components, it is essential to study it separately for a better understanding of its failure behaviour. This failure will also lead to toxic gas release and hence it is necessary to reduce its failure rate by effective safety precautions. Its failure not only stops the reactor-regenerator system but also completely stops the plant operations leading to heavy economic losses. A close monitoring and maintenance are required to minimize the number of these failures.
|
|
|
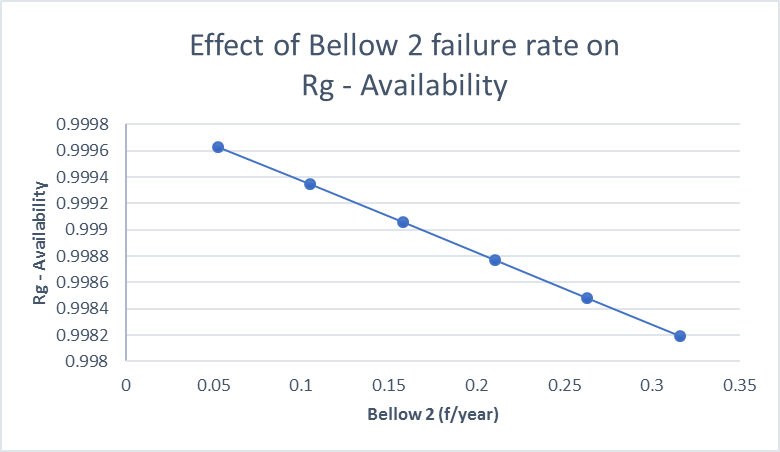 | Figure 3. Effect of Bellow 2 failure rate on Rg - Availability |
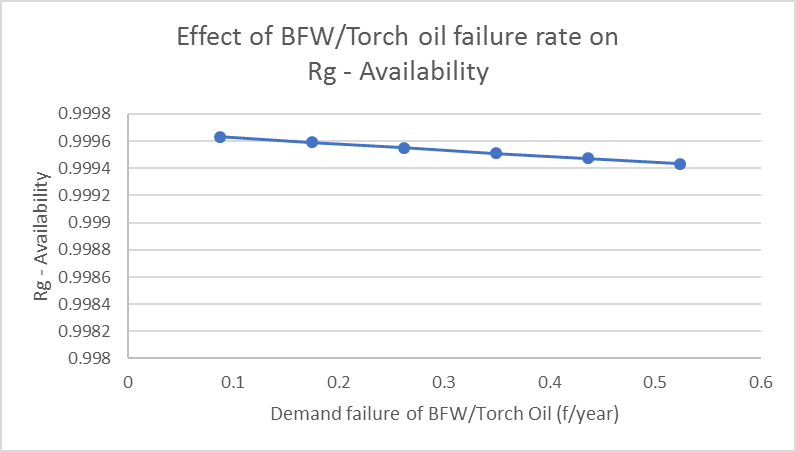 | Figure 4. Effect of BFW/Torch oil failure rate on Rg – Availability |
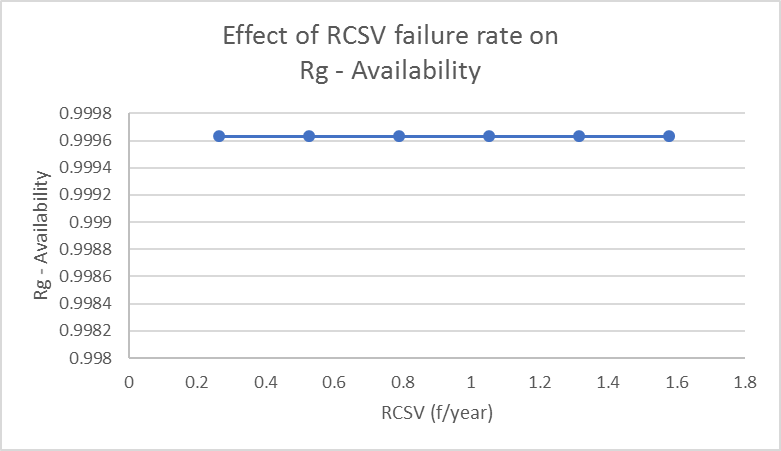 | Figure 5. Effect of RCSV failure rate on Rg - Availability |
5. Summary
- This paper has dealt with a case study at the regenerator system of FCCU refinery requiring high levels of availability for its economic operation. The system has been modeled by a Markov process and its availability computed. The most vulnerable part of the Markov approach is the explosion of its state space and the consequent intractability. While existing models analyse only a small part of any system, this paper presented a method of analyzing a complex system. The effects of the failure rates of the various components on system availability are also analyzed. The proposed model will be useful for analyzing similar plants and assessing their reliability characteristics even under different configurations.
 Abstract
 Reference
 Full-Text PDF
 Full-text HTML