-
Paper Information
- Next Paper
- Paper Submission
-
Journal Information
- About This Journal
- Editorial Board
- Current Issue
- Archive
- Author Guidelines
- Contact Us
American Journal of Computational and Applied Mathematics
p-ISSN: 2165-8935 e-ISSN: 2165-8943
2017; 7(2): 37-45
doi:10.5923/j.ajcam.20170702.02

A Multi-regions SIS Discrete Influenza Pandemic Model with a Travel-blocking Vicinity Optimal Control Approach on Cells
 Abstract
 Reference
 Full-Text PDF
 Full-text HTML
Imane Abouelkheir, Mostafa Rachik, Omar Zakary, Ilias Elmouki
Department of Mathematics and Computer Science, Hassan II University of Casablanca, Casablanca, Morocco
Correspondence to: Omar Zakary, Ilias Elmouki, Department of Mathematics and Computer Science, Hassan II University of Casablanca, Casablanca, Morocco.
| Email: |  |
Copyright © 2017 Scientific & Academic Publishing. All Rights Reserved.
This work is licensed under the Creative Commons Attribution International License (CC BY).
http://creativecommons.org/licenses/by/4.0/

In Susceptible-Infected-Susceptible (SIS) compartmental models, an infected population recovers with no immunity, and then, it moves immediately to the susceptible compartment once people heal from infection. Such phenomena are observed in the case of the common cold and influenza since these infections do not give immunization upon recovery, and individuals become susceptible again. In this paper, we devise a multi-regions SIS discrete-time model which describes infection dynamics due to the presence of an influenza pandemic in regions that are connected with their neighbors by any kind of anthropological movement. The main goal from this kind of modeling, is to exhibit the importance of mobility of individuals, in the spread of infection regardless the mean of transport utilized, and also to show the role of travel restrictions in influenza pandemic prevention, by introducing controls variables which reduce the incidence for which an infection could occur once susceptible populations have contacts with infected individuals coming from the neighboring regions of one region targeted by our optimization approach called here; the travel-blocking vicinity optimal control strategy. In the numerical simulations part, we consider a gridded surface of colored cells to illustrate the whole domain affected by the epidemic while each cell represents a sub-domain or region, and then, we give an example of the application of the optimal control approach to a cell with 8 neighbors, with the hypothesis that the infection starts from only one cell located in one of the corners of the surface.
Keywords: Multi-regions model, SIS epidemic model, Influenza pandemic, Discrete-time model, Optimal control, Vicinity, Travel-blocking
Cite this paper: Imane Abouelkheir, Mostafa Rachik, Omar Zakary, Ilias Elmouki, A Multi-regions SIS Discrete Influenza Pandemic Model with a Travel-blocking Vicinity Optimal Control Approach on Cells, American Journal of Computational and Applied Mathematics , Vol. 7 No. 2, 2017, pp. 37-45. doi: 10.5923/j.ajcam.20170702.02.
Article Outline
1. Introduction
- Susceptible-Infected-Susceptible (SIS) epidemic models have been applied to situations in which it is supposed that an infected population could move immediately to the susceptible compartment after being recovered from an infection due to the lack of immunization. This kind of compartmental models is also useful to model the evolution of many phenomena in different situations, see as examples, subjects treated in [1-3].In their papers [4-7], Zakary et al. have devised new mathematical models which are based on multi-regions discrete-time and continuous-time SIR models, aiming to describe the spatial-temporal evolution of epidemics which emerge in different geographical regions, and also, in order to show the influence of one region on an other one via infection travel. In [4, 5], the mentioned authors have proposed an optimization approach for proving its effectiveness when applied to epidemics and pandemics in general, and they treated particular infectious diseases such as HIV/AIDS and Ebola in [6] and [7] respectively. In other papers, the authors have also suggested multi-regions discrete-time systems which describe infection dynamics of an epidemic based on SIRS and SEIRS cellular compartmental models [8, 9]. In this research article, we aim to control a region that is affected by an influenza pandemic due to movements of infected people which enter only from its neighboring regions, with the hypothesis that in all regions, there are no removed individuals due to the lack of the immunity.Grais el al. have discussed in their papers in [10, 11], concrete examples which show the impact of mobility of individuals via air travel, on the global spread of the influenza epidemic. In the same context, Mateus et al. reported different types of travel restrictions in roads, rails, air and borders, which have been followed in different regions and showed their effectiveness in the case of a human influenza [12], see also work of Epstein et al. in [13] and where the authors revealed the importance of mathematical models in exhibiting the effectiveness of such travel-restrictions control strategies in case of the pandemic flu.For all these reasons, we suggest first here, a new modeling approach which is based on a multi-regions SIS discrete-time model describing the spatial-temporal spread of an influenza pandemic which emerges in a global domain of interest represented by a gridded surface of colored cells which are uniform in size. These cells are supposed to be connected by movements of their populations, and they represent sub-domains or regions, and noting that only one of these cells, that is targeted by our control strategy.In [4], a region was represented by a sub-domain (Ωj)j=1,..,p which belongs to a domain Ω, while here, a region is denoted by a cell (Cpq)p,q=1,..,M. For this, we assume that the pandemic can be transmitted and propagated by movements of people, from one spatial cell Cpq, to its neighbors or cells belonging to its vicinity. In a geographical scale relatively small, some infectious diseases such as African Swine Fever [14], Bovine Viral Diarrhoea virus [15, 16] and Foot-and-Mouth Disease [17], follow that pattern of spread, and Cpq can represent a farm, while in a large geographical scale such as in the case of SARS [18], HIV/AIDS [6, 19, 20], Ebola Virus [7], and ZIKA Virus [21], a cell Cpq can represent a city, a country or larger domain. Thus, by following a control strategy which is based on the travel-blocking vicinity optimal control approach suggested in [8, 9], movements of infected people who are intending to enter other cells, could be effectively restricted, and then, the incidence rate for which an infection could occur, becomes less important. In fact, the optimization criteria are also chosen here in a way to restrict the movement of people coming from one or more cells and entering other cells. Explicitly, we seek to minimize an objective function associated to Cpq and subject to its associated discrete-time system, with optimal control functions introduced as minimizers of infection incidence in order to show the effectiveness of the travel-blocking operations followed between Cpq and its neighbors. Vpq represents the vicinity set which is composed by all neighboring cells of Cpq and which are denoted by (Crs)r=p+k,s=q+k′ with (k, k′) ∈ {−1, 0, 1}2 except when k = k′ = 0. Note also as we have mentioned before, these cells are attached just in the grid, but in reality, they are not necessarily joined together. Thus, the travel-blocking vicinity optimal control approach will show the impact of the optimal blocker controls on reducing contacts between susceptible people of the targeted cell Cpq and infected people coming from one cell Crs or more cells from Vpq. The paper is organized as follows: Section 2. presents the discrete-time multi-cells SIRS influenza pandemic system based on a colored cellular modeling approach. In Section 3, we announce a theorem of necessary conditions and characterization of the sought optimal controls functions related to the travel-blocking vicinity optimal control approach. Finally, in section 4, we provide simulations of the numerical results for an example of 100 cells when an infection starts from one cell of them and which has 5 neighboring cells, while aiming to control only one cell with 8 neighboring cells.
2. The Mathematical SIS Model
- We consider a multi-regions discrete-time epidemic model which describes SIS dynamics within a domain Ω which is divided into M2 regions or cells, uniform in size. In other words,
 with Cpq denoting a spatial location or region.We note that (Cpq)p,q=1,...,M could represent a country, a city or town, or a small domain such as neighborhoods, which belong respectively to a domain Ω that could represent a part of continent or even a whole continent, a part of country or a whole country, etc.We represent the S-I populations associated to a cell Cpq by the states
  and
and  and we note that the transition between them, is probabilistic, with probabilities being determined by the observed characteristics of specific diseases. In addition to the death, there are population movements among these three epidemiological compartments, from time unit i to time i + 1. We assume that the susceptible individuals not yet infected but can be infected only through contacts with infected people from Vpq (Vicinity set or Neighborhood of a cell Cpq), thus, the infection transmission is assumed to occur between individuals present in a given cell Cpq, and is given by
 where
where  is the constant proportion of adequate contacts between a susceptible from a cell Cpq and an infective coming from its neighbor cell
  with
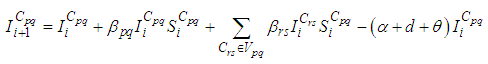
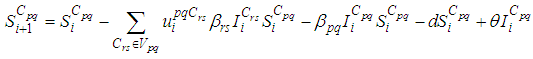
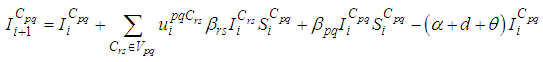
with SIS dynamics associated to a cell Cpq are described based on the following multi-regions discrete model. For p,q = 1, ..., M, we have
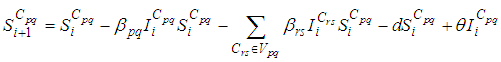 | (1) |
 | (2) |
 and
and  are the given initial conditions.d > 0 is the natural death rate while α > 0 is the death rate due to the infection, and θ > 0 denotes the recovery rate. By assuming that is all regions are occupied by homogeneous populations, α, d and θ are considered to be the same for all cells of Ω.
3. The Travel-Blocking Vicinity Optimal Control Approach
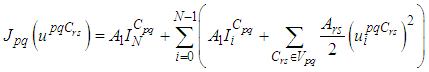
- The main goal of the travel-blocking vicinity optimal control approach is to restrict movements of infected people coming from the set Vpq and aiming to reach the cell Cpq. For this, we introduce controls variables upqCrs which limits contacts between susceptible of the targeted cell Cpq and infected individuals from cells Crs which belong to Vpq. Then, for a given cell Cpq in Ω, the discrete-time system (1)-(2) becomes
 | (3) |
 | (4) |
 | (5) |
 | (6) |
 such that
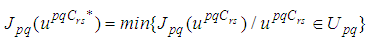 The sufficient conditions for the existence of optimal controls in the case of discrete-time epidemic models have been announced in [4] [5], [22], and [23].As regards to the necessary conditions and the characterization of our discrete optimal control, we use a discrete version of Pontryagin's maximum principle [4], [5], [24].For this, we define an Hamiltonian
  associated to a cell
  by
by 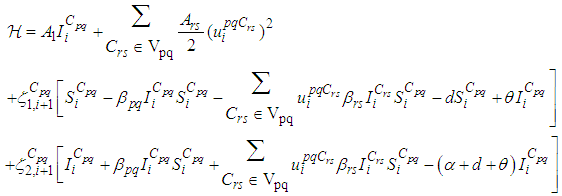
 with
with  the adjoint variables associated to
  and
and  respectively, and which are defined based on formulations of the following theorem.Theorem 1. (Necessary Conditions \& Characterization) Given optimal controls
  and solutions
  and
and  there exists
  the adjoint variables satisfying the following equations
 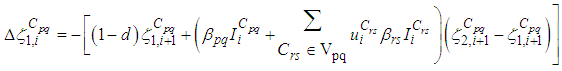 | (7) |
 | (8) |
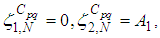 are the transversality conditions.In addition
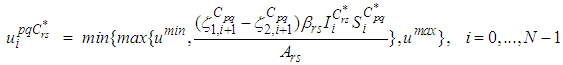 | (9) |
 and
and  we obtain the following adjoint equations
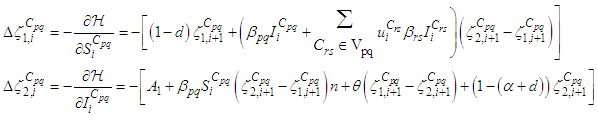 with
with  are the transversality conditions.In order to obtain the optimality condition, we calculate the derivative of
  with respect to
  and we set it equal to zero
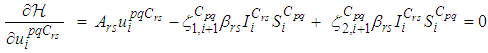 Then, we obtain
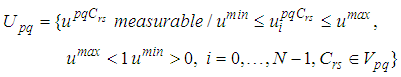
 By the bounds in
  we finally obtain the characterization of the optimal controls
  as
as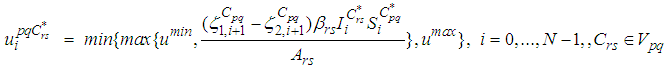
4. Numerical Results and Discussions
4.1. Brief Presentation
- In this section, we provide numerical simulations to demonstrate our theoretical results in the case when the studied domain
 represent the assembly of
  regions or cells (countries, cities, towns, ...). A code is written and compiled in MATLAB using data cited in Table 1. The optimality systems are solved using an iterative method where at instant
  the states
  and
and  with an initial guess, are obtained based on a progressive scheme in time, and their adjoint variables
  are obtained based on a regressive scheme in time because of the transversality conditions. Afterwards, we update the optimal controls values (10) using the values of state and costate variables obtained in the previous steps. Finally, we execute the previous steps till a tolerance criterion is reached. In order to show the importance of our work, and without loss of generality, we consider here that
  and then we present our numerical simulations in a
  grid and which represents the global domain of interest
 associated to a cell
  and which are utilized for the resolution of all multi-regions discrete-time systems (1)-(2) and (3)-(4), and then leading to simulations obtained from Figure 1 to Figure 4, with the initial conditions
  associated to any cell

 where we introduce 10 infected individuals and 40 susceptible ones.In all of the figures below, the redder part of the color-bars contains larger numbers of individuals while the blue part contains the smaller numbers.In the following, we discuss with more details, the cellular obtained simulations, in the case when there are yet no controls.
4.2. Cellular Simulations without Controls
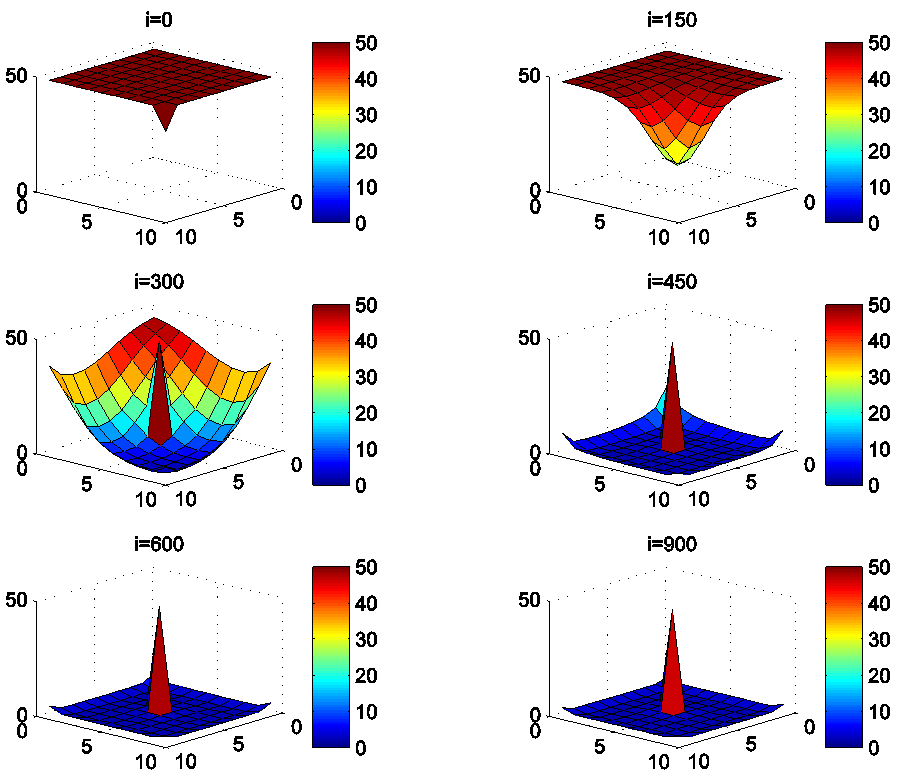
- In this section, Figures 1. and 2. depict dynamics of the susceptible population in the case when there is yet no control strategy, followed for the prevention of the epidemic, and we note that in all these figures presented here, simulations give us an idea about the spread of the disease in the case when the epidemic starts in a cell
 with
with  (located in the lower-left corner of
  It represents the case when the vicinity set
  associated to the source cell of infection, contains 3 cells).
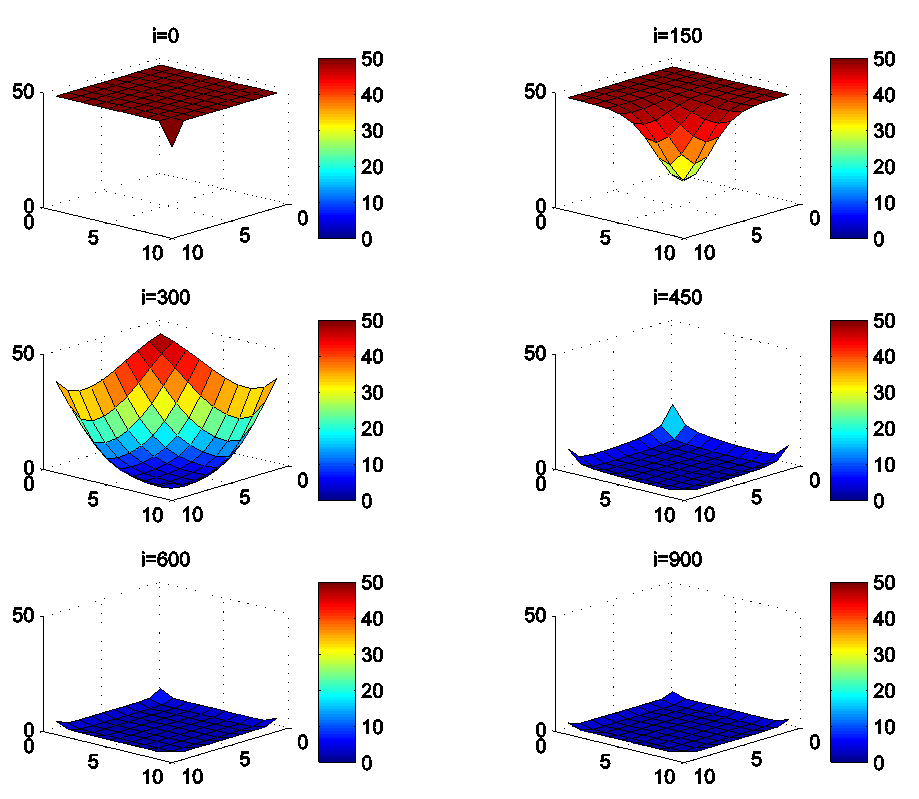 | Figure 1.  behavior in the absence of controls behavior in the absence of controls |
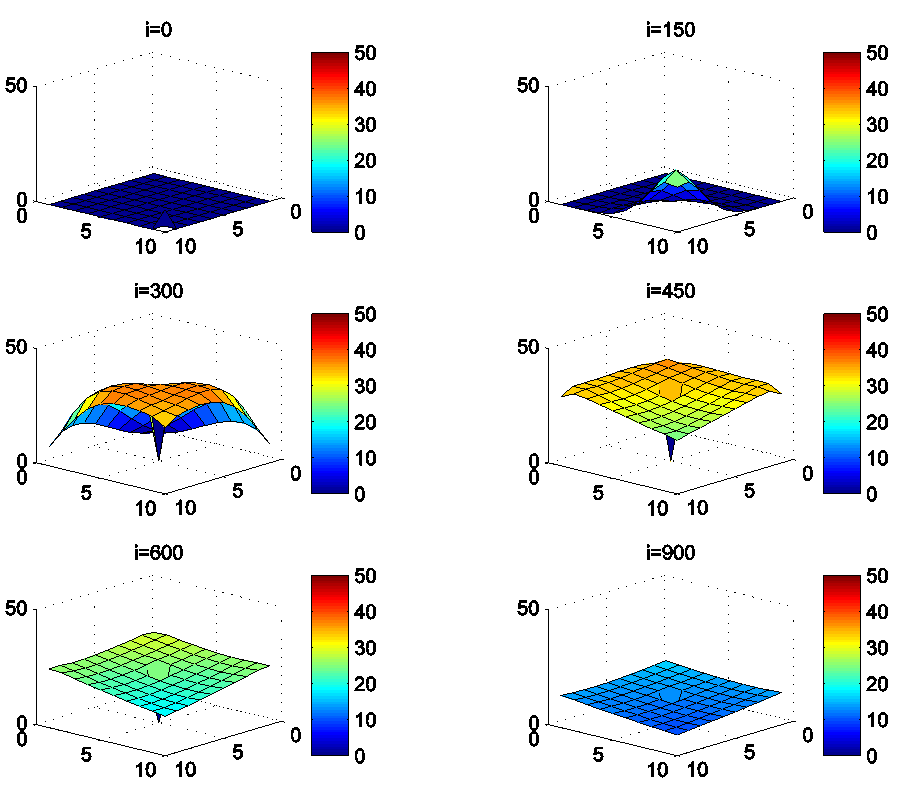
 | Figure 2.  behavior in the absence of controls behavior in the absence of controls |
 located at the lower-left corner of
  and 50 in each other cell, we can see that at instant
  , the number
  becomes less important and takes values close/or equal to 35, 40 and 45, while
  in cells of
  take values close/or equal to 30, and as we move away from
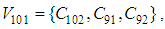
 remains important. At instant
  we can observe that in most of cells,
  becomes less important, taking values between 0 and 10 near the source of infection, while in other cells, it takes values between 20 and 40 except
  which conserves its value in 50 since it is located far away from the source of infection. At instant
  becomes zero except at the opposite corners and the borders of
  because these cells have vicinity sets smaller than other cells. Finally at last instants,
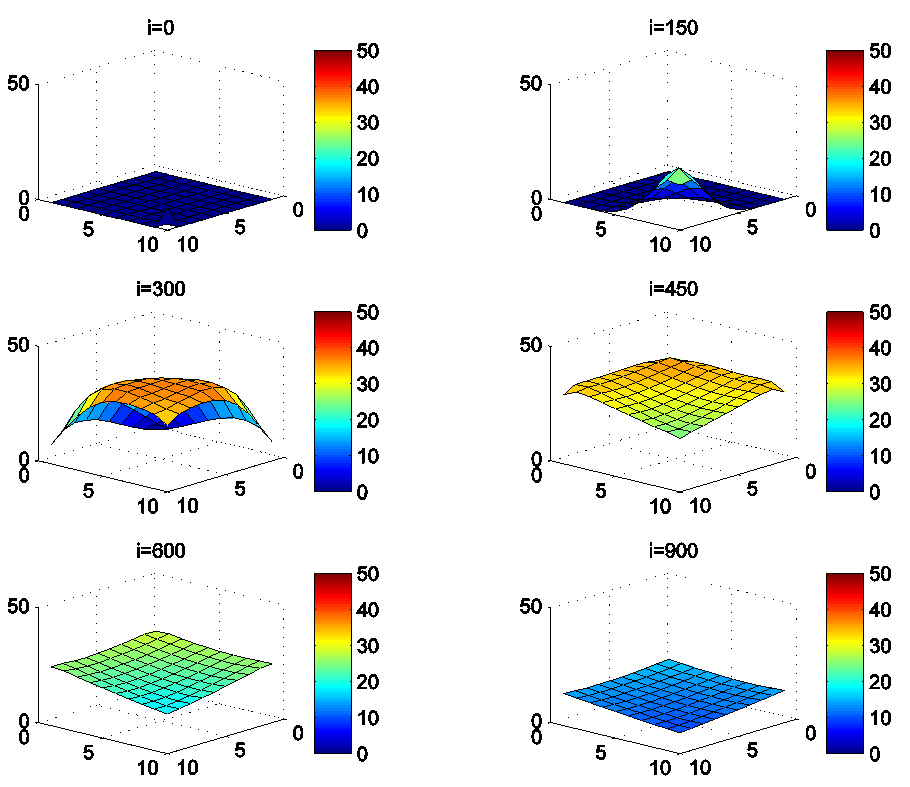
  converge to zero in all cells.Figure 2. illustrates the rapid propagation of the infection in
  and we can observe that at instant
  the number
  increases to a bigger value which is close/or equals to 25, while
  in cells of
  take values close/or equal to 15, and as we move away from
 remains less important. At instant
  we can see that in most cells,
  becomes more important, taking values that are bigger than 30 in cells which have/or are close to cells with 8 neighboring cells, while in few other cells, it takes values that are close to 15. From these numerical results, we can deduce that once the infection arrives to the center or to the cells with 8 cells in their vicinity sets, the infection becomes more important compared to the case of the previous instant. At instant
 takes values which equal/or are close to 28 or more in cells from where the epidemic has started, and 25 in and near to it, and as we move away towards the center and further regions, infection is important with the presence of 32 infected individuals in the 3 opposite corners and which becomes 25 at instant
  In fact, at the center of
  the number of infected people which has increased to 35 at the previous instant
  has been reduced, because once a cell becomes highly infected, it loses an important number of individuals which die, recover naturally after or become susceptible again, and this can be more deduced at further instants.
4.3. Cellular Simulations with Controls
- Figures 3. and 4. depict dynamics of the S-I populations when the travel-blocking vicinity optimal control strategy is followed.
 | Figure 3.  behavior in the presence of optimal controls (10) behavior in the presence of optimal controls (10) |
 | Figure 4.  behavior in the presence of optimal controls (10) behavior in the presence of optimal controls (10) |
 located in the lower-left border of
  As an example, we suppose that the cell aiming to control is
  In Figure 3., as supposed also above, there are 40 susceptible people in cell
  and 50 in each other cell. We can see that at instant
  the numbers
  and
and  are at most the same as in the case when there was no control strategy. However, the controlled cell
  contains 45 susceptible people at instant
  which is not exactly the same as in the case when there was yet no control strategy since in Figure 1.,
  has decreased more significantly. Thus, we can deduce that the travel-blocking vicinity optimal control strategy has proved its effectiveness earlier in time. At instants
  and
and 
 is also the same as done before but fortunately again, we reach our goal in keeping the number
  close to its initial value despite some small decrease. Thus, this demonstrates that most of movements of infected people coming from the vicinity set
  have been restricted in final times.In Figure 4., we deduce that at instant
  the numbers
  and
and  are at most the same as in Figure 2. At instant
  we can see that in most cells,
  is also similar to the case in Figure 3. but the controlled cell
  is still not really infected and contains only about one infected individual, and the number remains always not important at further instants.
ACKNOWLEDGEMENTS
- This work is supported by the Systems Theory Network (Réseau Théorie des Systèmes), and Hassan II Academy of Sciences and Technologies-Morocco.
References
| [1] | Safan, M., and Rihan, F.A., Mathematical analysis of an SIS model with imperfect vaccination and backward bifurcation; Mathematics and Computers in Simulation 96 (2014): 195-206. (2014). |
| [2] | Kandhway, K., and Kuri, J., How to run a campaign: Optimal control of SIS and SIR information epidemics; Applied Mathematics and Computation 231 (2014): 79-92. (2014). |
| [3] | Wu, Q., Lou, Y., and Zhu, W., Epidemic outbreak for an SIS model in multiplex networks with immunization; Mathematical biosciences 277 (2016): 38-46. (2016). |
| [4] | Zakary, O., Rachik, M., Elmouki, I., On the analysis of a multi-regions discrete SIR epidemic model: An optimal control approach; International Journal of Dynamics and Control, 1-14. (2016). |
| [5] | Zakary, O., Rachik, M., Elmouki, I., A new analysis of infection dynamics: multi-regions discrete epidemic model with an extended optimal control approach; International Journal of Dynamics and Control, 1-10. (2016). |
| [6] | Zakary, O., Larrache, A., Rachik, M., Elmouki, I., Effect of awareness programs and travel-blocking operations in the control of HIV/AIDS outbreaks: a multi-domains SIR model; Advances in Difference Equations, 2016(1), 1-17. (2016). |
| [7] | Zakary, O., Rachik, M., Elmouki, I., A multi-regional epidemic model for controlling the spread of Ebola: awareness, treatment, and travel-blocking optimal control approaches; Mathematical Methods in the Applied Sciences (2016). |
| [8] | Abouelkheir, I., El Kihal, F., Rachik, M., Zakary, O., Elmouki, I., A Multi-Regions SIRS Discrete Epidemic Model with a Travel-Blocking Vicinity Optimal Control Approach on Cells; British Journal of Mathematics and Computer Science. 20(4). 1-16 (2017). |
| [9] | El Kihal, F., Rachik, M., Zakary, O., Elmouki, I., A multi-regions SEIRS discrete epidemic model with a travelblocking vicinity optimal control approach on cells; International Journal of Advances in Applied Mathematics and Mechanics, 4(3). 60-71. (2017). |
| [10] | Grais, R. F., Ellis, J. H., Kress, A., Glass, G. E., Modeling the spread of annual influenza epidemics in the US: The potential role of air travel; Health care management science, 7(2), 127-134. (2004). |
| [11] | Grais, R. F., Ellis, J. H., Glass, G. E., Assessing the impact of airline travel on the geographic spread of pandemic influenza.; European journal of epidemiology, 18(11), 1065-1072. (2003). |
| [12] | Mateus, A.L.P., Otete, H.E., Beck, C.R., Dolan, G.P., Nguyen-Van-Tam, J.S., Effectiveness of travel restrictions in the rapid containment of human influenza: a systematic review; Bulletin of the World Health Organization. Volume 92, Number 12, December 2014, 868-880D. (2014). |
| [13] | Mateus, A.L.P., Otete, H.E., Beck, C.R., Dolan, G.P., & Nguyen-Van-Tam, J.S., Controlling pandemic flu: the value of international air travel restrictions; PloS one, 2(5), e401. (2007). |
| [14] | Sánchez-Vizcaíno, J. M., Mur, L., & Martínez-López, B., African swine fever: an epidemiological update; Transboundary and emerging diseases, 59(s1), 27-35. (2012). |
| [15] | Fray, M. D., Paton, D. J., & Alenius, S., The effects of bovine viral diarrhoea virus on cattle reproduction in relation to disease control; Animal Reproduction Science, 60, 615-627. (2000). |
| [16] | Thiaucourt, F., Yaya, A., Wesonga, H., Huebschle, O. J. B., Tulasne, J. J., & Provost, A., Contagious bovine pleuropneumonia: a reassessment of the efficacy of vaccines used in Africa; Annals of the New York Academy of Sciences, 916(1), 71-80. (2000). |
| [17] | Grubman, M. J., & Baxt, B., Foot-and-mouth disease; Clinical microbiology reviews, 17(2), 465-493. (2004) |
| [18] | Afia, N., Manmohan Singh, and David Lucy, Numerical study of SARS epidemic model with the inclusion of diffusion in the system; Applied Mathematics and Computation 229 (2014): 480-498. (2014). |
| [19] | Zakary, O., Rachik, M., Elmouki, I., On the impact of awareness programs in HIV/AIDS prevention: an SIR model with optimal control; Int J Comput Appl, 133(9), 1-6. (2016). |
| [20] | Samanta, G.P., Permanence and extinction of a nonautonomous HIV/AIDS epidemic model with distributed time delay; Nonlinear Analysis: Real World Applications, 12(2), 1163-1177. (2011). |
| [21] | Chunxiao, D., Tao, N., Zhu, Y., A mathematical model of Zika virus and its optimal control; In Control Conference (CCC), 2016 35th Chinese, pp. 2642-2645. TCCT, (2016). |
| [22] | Wandi, D., Hendon, R., Cathey, B., Lancaster, E., and Germick. R., Discrete time optimal control applied to pest control problems; Involve, a Journal of Mathematics 7, no.4:479-489. (2014) |
| [23] | Dabbs, K., Optimal control in discrete pest control models; Thesis. trace.tennessee.edu. (2010). |
| [24] | Sethi S.P., Thompson, G.L., What is optimal control theory?; Springer, US, pp 1-22. (2000). |