
-
Paper Information
- Paper Submission
-
Journal Information
- About This Journal
- Editorial Board
- Current Issue
- Archive
- Author Guidelines
- Contact Us
American Journal of Computational and Applied Mathematics
p-ISSN: 2165-8935 e-ISSN: 2165-8943
2016; 6(2): 74-81
doi:10.5923/j.ajcam.20160602.07

Accuracy of Predictions of Ice Slurry Properties and Technical Characteristics of Machines Producing It
 Abstract
 Reference
 Full-Text PDF
 Full-text HTML
Boris Menin
Mechanical & Refrigeration Consultant Expert, Beer-Sheba, Israel
Correspondence to: Boris Menin , Mechanical & Refrigeration Consultant Expert, Beer-Sheba, Israel.
| Email: |  |
Copyright © 2016 Scientific & Academic Publishing. All Rights Reserved.
This work is licensed under the Creative Commons Attribution International License (CC BY).
http://creativecommons.org/licenses/by/4.0/

The heat transfer properties of ice slurries and technical characteristics of ice-slurry makers remain unclear and need to be better understood. We aim to introduce a specific metric called the comparative error by which the discrepancy between the chosen model and the observed object is verified. Information theory methods are applied in order to calculate this error caused only by the finite number of recorded variables after they have been chosen by the conscious observer and before defining the model structure. The comparative error can be realized by field tests or computer simulation. We show that the quantity of information contained in the model is calculated and defines the required number of variables that should be taken into account. The use of the suggested approach can help researchers to find the value of the experimental error for the confirmation of the eligibility of the chosen model for different ice slurry applications. Examples of practical application of the considered concept for the measurement of ice slurry behaviors and the ice-slurry maker parameters are discussed.
Keywords: Error Analysis, Ice Slurry, Information Theory, Heat Transfer, Modeling, Theory of Similarity
Cite this paper: Boris Menin , Accuracy of Predictions of Ice Slurry Properties and Technical Characteristics of Machines Producing It, American Journal of Computational and Applied Mathematics , Vol. 6 No. 2, 2016, pp. 74-81. doi: 10.5923/j.ajcam.20160602.07.
Article Outline
1. Introduction
- Pumpable ice [1] technology is known from the 70th years of the twentieth century. It is based on the production of fluids or secondary refrigerants, also called coolants, with the viscosity of water or jelly and the cooling capacity of ice. Pumpable Ice is typically a slurry of ice crystals or particles ranging from 5 to 10,000 μm (1cm) in diameter and transported in brine, seawater, food liquid, or gas bubbles of air, ozone, or carbon dioxide [2]. Besides generic terms such as “pumpable”, “jelly”, and “slurry ice”, there are many trademark names [2] for such coolants, like "Deepchill", “Beluga”, “optim”, “flow”, “fluid”, “jel”, “binary”, “liquid”, “maxim”, “whipped”, and “bubble slurry” ice. These brands are authorized by more than 40 industrial ice-maker production companies [3]. Following the recommendations of the Working Party on Ice Slurries, we will use the term "ice slurry" (IS).Compared to crystal ice (crushed, plate, tube, shell, flake ice), IS is the most attractive cooling medium [4]. Many applications of it are possible and have already been realized [5, 6]. IS covers a full surface of a product protecting it from damage. IS removes heat from the product at significantly higher rates than other types of ice. The increased heat flux from IS causes a long-shelf life of products. The overall heat transfer coefficient between the cooled medium and boiled refrigerant is higher than during the production of other kinds of ice. IS is now well recognized not only as an incomparable cooling technology but also as an excellent preservation medium. These advantages have resulted in a huge interest in the development and manufacture of IS machines.In spite of many experimental and numerical investigations regarding the thermal-hydraulic characteristics of IS generator and IS itself (see Chapter 2), the industrial technical parameters of IS generators and IS properties are still unsatisfactory and there is a need to support everyday engineering problems and to develop a single simplified method that allows the use of engineering judgment based on experience. This will enhance our ability to understand the relative impact of the main technical and technological parameters of IS machines.At the same time, there is no universally accepted recommendation on how to calculate a pure ice concentration in IS. Although there is a standard for the calculation of the performance of generators of crystalline ice [7], the “Working Party on Ice Slurries” of the International Institute of Refrigeration has not yet put forward any relevant proposals. That is why the vast majority of industrial IS generator manufacturers currently do not provide sufficient technical information for understanding the real advantages and disadvantages of IS machines and establishing an objective comparison of specific indicators of ice machines. The companies use different technologies to produce their panels, as well as different methods of testing and verifying their claims. In this note, we prepared a comparison table of specific parameters of IS makers (see Table 1 at the end of the paper) made by several companies.
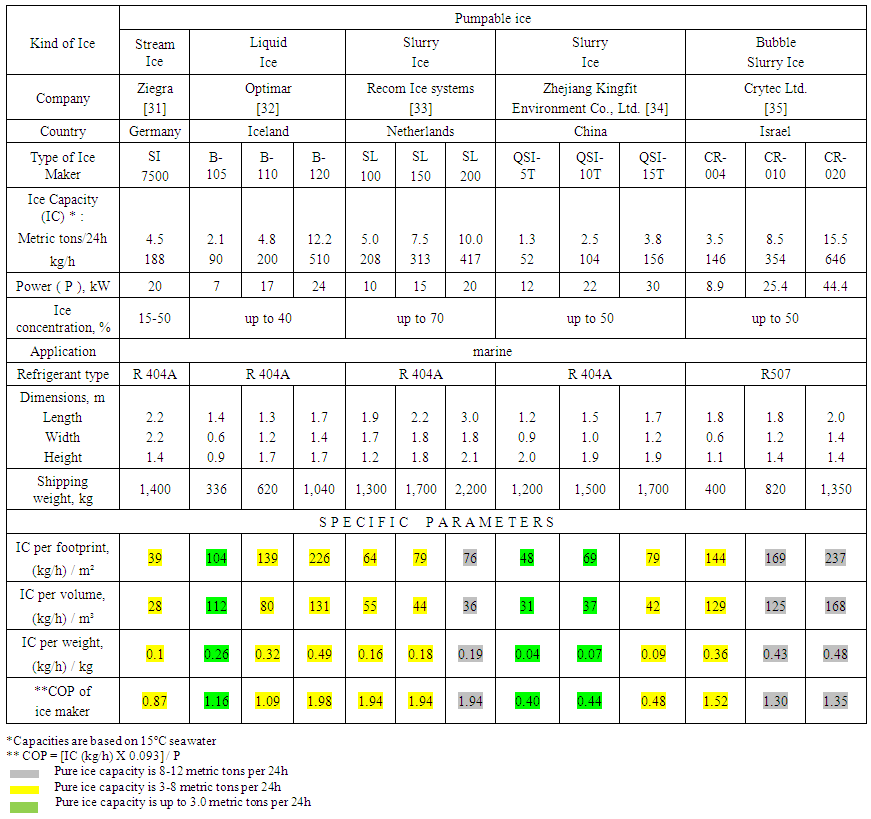 | Table 1. Comparison of IS maker characteristics |
2. Background
- It is obvious that in order to use the unique properties of IS and high energy efficiency IS makers in industry, agriculture, medicine and the fishing industry, we must have exact knowledge of the properties of IS and IS machine specifications.For these purposes, in recent years, there has been a dramatic increase in the use of mathematical modeling and numerical simulation as a tool of evaluation of multivariable or complex physical processes. Scientists, no doubt, are interested too in testing the veracity of models used in their investigations. However, comprehensive testing is currently impossible [9]. In practice, model validation aims to increase confidence in the accuracy of the model. Estimation of the model can be made with different levels of detail, but there is no generally accepted or standard procedure that would establish the minimum quantitative requirements for the making of a test model [10]. At the same time, the general strategies of matching models and MOs that have been particularly popular from both a theoretical and an applied perspective are verification and validation (V&V) techniques [11].Verification is the process of the conforming that a computational model accurately represents the basic mathematical model and its solution; validation is the process of determining the degree to which a model guarantees an accurate representation of the real world from the perspective of the intended use of the PMM [12].We can say that quality validation may be useful in certain scenarios, especially in the process of identification of possible causes of errors in the model. However, at the moment, the validation is not able to provide a quantitative measure of the agreement or difference between the experimental and computer data. A more detailed discussion of the existing developments in V&V is introduced in [13, 14]. Claims about V&V of PMM results, in general, are now routinely found in published literature.However, some scholars suggest that the V&V of numerical models of natural systems is impossible [15]. The authors argue that the model can never fully simulate reality in all conditions and, therefore, cannot be confirmed.Taking into account the above mentioned statements we reviewed several technical information sources (in English) about the activities related to IS and usage of V&V including publications of IJR (International Journal of Refrigeration) and Proceedings of IIR (International congresses on refrigeration). The review covers a total amount of publications of 1,006 papers and the period of 2000-2015 [17]. The number of articles specifically devoted to the study of the properties of IS is 78, while the numbers of articles focused on the calculation of the IS machine characteristics is 18. Most of the authors declare satisfactory results such as “model predictions are confirmed by experiments”, “model captures the trends found in experimental investigations”, “comparison showed a very good agreement between these data”, “it can supply plentiful parametric information in the interested region” and so on. As mentioned above, numerical models can be verified or validated. At the same time, the above-stated assertion regarding the research region in which we are interested is, unfortunately, far from the reality.Factually, no one has calculated a generalized absolute error (AE) of a specific goal function (similarity criterion/consolidated criteria) that describes the "life-activity" of the researched MO, characterizes the interaction of the MO with the environment, and is compiled from the observed physical variables measured at certain accuracy. Nobody has calculated the difference between the numerical predictions and experimental results with a total absolute error achieved during field tests. Thus, there is a sizable body of literature on the methods of development of PMMs that describe MOs with the lowest possible discrepancy. At the same time, nobody has tried to quantify the conceptual PMM error caused by choosing a finite number of variables to take into account. Using the proposed method, it will be possible to assess the proximity of the PMM to the real characteristics of IS and IS machine settings and to calculate the error observed in experimental studies or computer modeling. Besides that, by applying the suggested approach, one can significantly reduce the duration of the research and design phase and thus reduce the cost of the project.
3. Applied Techniques
- First of all, let us specify the concept of "comparative error." We define the "error" as the minimum discrepancy between the tested MO and PMM that was caused only by the fact that only a finite number of variables were taken into account. The comparative error ε [18] is the ratio between ΔU and S*:
 | (1) |
 | (2) |
 The dimension of any q in a frame of SI can only express a unique combination of the dimensions of seven main primary variables in different degrees [19]:
 | (3) |
 | (4) |
 | (5) |
 | (6) |
 This approach completely ignores the human evaluation of information. In other words, the set of 100 notes played by chimpanzees and the melody of Mozart's 100 notes in Piano Concerto No.21 Andante, have exactly the same amount of information. It is useful to be able to calculate information theory quantities for the chosen mathematical model as a part of an investigation into effective V&V methods or as a tool for quantifying the discrepancy between the developed PMM and MO. Based on these assumptions, the DS error of the PMM caused by the finite number of recorded variables
 can be obtained [24]
 | (7) |
 describing the same MO, preference should be given to the PMM for which the ratio τ is closer to 1, that is,
 | (8) |
4. Examples of Approach Applications
- It should be mentioned that a style of the examples below is instructive and didactic that can be explained by a necessity to show features of the אSI -hypothesis application. Besides that, the sizable body of publications does not provide enough input data for calculation and verification of the results obtained by (7). Here, an attempt will be made to analyze the published results and compare them with the data obtained by the approach introduced using Equation (7).
4.1. IS Properties
- 4.1.1. In [25], a similarity theory with non-dimensional numbers and criteria was applied in order to formulate the PMM describing the influence of the mass flow, pipe diameter or ice contents on the pressure drop characteristics and heat transfer process of flowing IS. The researchers measured the thermal and hydraulic characteristics of IS using original testing equipment. The experimental procedure and treatment of results were carefully explained.Due to analysis of the recorded variables dimensions, the PMM was classified with
 Let us calculate the conditions of realizing the minimum comparative error of the PMM (εmin)LMTθ:
 | (9) |
 | (10) |
 | (11) |
 | (12) |
 | (13) |

 and is equal to
 | (14) |
 non-dimensional parameters have been used. To study the heat transfer, at the beginning, 14 DS criteria and numbers were applied but after simplification the experimental results were given by only four
 The comparative errors of measurement of the pressure drop ε1exp and heat transfer ε2exp are the following:
 | (15) |
 | (16) |
 | (17) |
4.2. IS Generators
- 4.2.1. Similarity theory was applied for a novel system using direct contact heat transfer between air and water solution and generating IS [27]. The empirical formula connects the volumetric heat transfer coefficient with the main essential parameters including geometric, fluid, and thermal material properties. This formula of the volumetric heat transfer coefficient agreed with the experimental values with a relative error of less than 15%. Based on this formula, a laboratory-scale direct-contact IS generator was constructed and tested. According to the modeler’s claims, the charts built can help engineers to design and calibrate the size and operational conditions of IS generators for practical application in planned/envisaged practical applications. At the same time, V&V procedures are absent.The chosen PMM relates to
 and the minimum comparative error that could be reached at (z′′−β′′) ≈ 19 (14). In turn, during the theoretical research and experimental tests eleven DL variables and five DS criteria and complexes were recorded, which is far from the recommended 19. In other words, in the proposed approach, to achieve the lower error of the applied PMM, the use of a distinctive additional amount of DS complexes is required. Currently, engineers cannot conveniently look up the charts to design and calibrate the size of IS makers and operational conditions without carrying out complicated individual modeling and additional computations.4.2.2. Reference [28] presents a study in which an attempt was made to analyze the working mode of the serial production IS maker. Its ice capacity appears in the form depending on the selected essential parameters. The object of the research is a generator of pumpable (slurry) ice called the Wiped Surface Crystallizer and includes several horizontal double-walled crystallizers-evaporators, with a revolving rotor (shaft and plastic wipers) in each, compressor-condenser unit (with R507A refrigerant) and all required refrigeration and liquid accessories. As the goal function, the DS pure ice capacity X = G/P, (kg/s) of the IS generator was selected and presented as a product correlation function of one-parameter functions of the recorded essential parameters and a normalizing constant. G is the pure ice capacity (kg/s) and P is the flow rate of liquid (kg/s).Twelve (z') input DL parameters were taken into account in this study including the geometric characteristics of evaporators, fluid parameters, as well as the operational conditions. The total number of DS criteria and numbers that were used for analyzing the working modes was z' - β' = 4 where β' is number of primary variables: β'=8. In order to find the explicit form of one-parameter functions and the constant factor, each parameter was varied within the range of its admissible values. Then a procedure for obtaining experimental results was realized by the method of least squares, keeping all the other parameters at the main level. The achieved discrepancy between the experimental and computational data in the range of admissible values of the similarity criteria and dimensionless conversion factors did not exceed 11%.The PMM is classified with
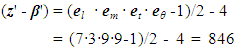
 Based on (12), we find z'-β' = 846. This corresponds to the lowest comparative error at (z''- β'') ≈ 19 (13). This value is higher in comparison to the number of DS criteria used in the reviewed article. The direct measurement errors are much smaller than the measured values, accounting for a few percent of those values or less. Then the error dX can be formally considered as a small increment ΔX of a measured variable: ΔX ≈ dX. In order to find the experimental value of the claimed error of ice capacity ΔXexp, the mathematical apparatus of differential calculus is applied [29]:
 | (18) |
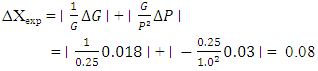
 are partial derivatives with respect to the corresponding values; ΔG is the DL error of measurement of pure ice capacity, 0.018 kg/s, ΔP is the DL error of measurement of liquid flow rate, 0.03 kg/s.So, the value of ΔXexp reached in the experiment equals
 | (19) |
 | (20) |
 is the given range of changes of DS ice concentration X allowed by the chosen PMM, 0.5 [28]. From (19) and (20), we get
 that is, the actual error in the experiment is 6.2 times (0.08/0.013) greater than the minimum. This means that at the chosen number of DS criteria the existing accuracy of measurement of DL variables is insufficient. In addition, the number of recorded DS variables z'-β'=4 is less than the recommended number ≈ 19 (13), which corresponds to the lowest comparative error. So, the declared discrepancy of 11% between the experimental and computational data does not guarantee that the choice of PMM structure is sufficiently complete at the number of variables taken into account. The PMM with formulated relationships between the main characteristics of the process under investigation may be wrong.For further experimental work it is necessary to use devices of a higher class of accuracy that is sufficient to confirm and clarify a new PMM designed with many DS variables. Hence, the use of the suggested approach can help researchers to find, in a few minutes, the minimum value of the required experimental error for the confirmation of the eligibility of the chosen PMM. This error will correspond to the error inherent in the model and caused only by its finiteness.
5. Conclusions
- In line with the aim of this study this work has formulated the approach and the mathematically calculated metric in order to choose the PMM’s number of recorded variables describing the researched phenomenon or process and corresponding to the measurement accuracy in the field experiments. For the chosen PMM, we proposed a formula for calculating the minimum absolute comparative error of the desired goal parameter with which it is possible to compare the experimental data and actual error of field tests. The formula suggested is very simple and is derived with reference to the number of variables recorded in PMM.The distance or similarity measure between the formulated PMM and the researched MO only requires calculation of the comparative error. Although IS properties and data on the characteristics of IS machines are used as a paradigmatic example, the formula can be applied to any physical phenomenon in different areas of science and technology. The author has supposed that the estimate of the error of the mathematical model caused by the model’s finiteness (number of chosen variables), can be a special metric for the adequacy of accuracy of the physical experiment measurements. Author intends that the suggested tool be used by researchers and designers interested in learning how efficiently the comparative error is used in the development of modern refrigeration equipment compared to other metrics. This tool allows users to input the qualitative and quantitative data needed to score results for any model.The physical meaning of
 lies in the fact that when any event or process is schematized, there is a discrepancy between the PMM and the МО called the threshold mismatch [30]. The value
 due to the threshold mismatch, should never be more than the permissible error of measurement. Otherwise, it is necessary to redefine the model before carrying out the experiment. In the above approach,
 represents a sort of "model noise" (similar to "thermal noise").