-
Paper Information
- Paper Submission
-
Journal Information
- About This Journal
- Editorial Board
- Current Issue
- Archive
- Author Guidelines
- Contact Us
American Journal of Computational and Applied Mathematics
p-ISSN: 2165-8935 e-ISSN: 2165-8943
2015; 5(2): 42-65
doi:10.5923/j.ajcam.20150502.03
Dengue in Tanzania - Vector Control and Vaccination
 Abstract
 Reference
 Full-Text PDF
 Full-text HTML
Laurencia Ndelamo Massawe1, Estomih S. Massawe2, Oluwole D. Makinde3
1Faculty of Science, Technology and Environmental Studies, The Open University of Tanzania, Dar es Salaam, Tanzania
2Mathematics Department, University of Dar es salaam, Dar es Salaam, Tanzania
3Faculty of Military Science, Stellenbosch University, Private Bag X2, Saldanha, South Africa
Correspondence to: Laurencia Ndelamo Massawe, Faculty of Science, Technology and Environmental Studies, The Open University of Tanzania, Dar es Salaam, Tanzania.
| Email: |  |
Copyright © 2015 Scientific & Academic Publishing. All Rights Reserved.
In this paper a mathematical model is presented to examine the effect of treatment, careful andCareless Susceptibles with control on the transmission of Dengue fever in the society. A nonlinear mathematical model for the problem is proposed and analysed quantitatively using the stability theory of the differential equations. The results show that the disease-free equilibrium point is locally and globally asymptotically stable if the reproduction number (R0) is less than unity. Then the endemic equilibrium is locally and globally asymptotically stable under certain conditions, using the additive compound matrices approach and Lyapunov method respectively. However treatment, careful Susceptibles and the control on the transmission of dengue fever disease will have a positive effect on decreasing the growth rate of dengue fever disease. The numerical simulation shows that on the application of vaccination, the number of infected individual is reduced.
Keywords: Dengue Fever Disease, treatment, Careful,Careless, Susceptible, Equilibrium, Control, infected, reproduction number, Vaccination
Cite this paper: Laurencia Ndelamo Massawe, Estomih S. Massawe, Oluwole D. Makinde, Dengue in Tanzania - Vector Control and Vaccination, American Journal of Computational and Applied Mathematics , Vol. 5 No. 2, 2015, pp. 42-65. doi: 10.5923/j.ajcam.20150502.03.
Article Outline
1. Introduction
- Dengue fever is a severe infection, flu-like illness transmitted to humans through the bites of infected female Aedes mosquitoes. Four different serotypes can cause dengue fever. A human infected by one serotype, on recovery, gains total immunity to that serotype and only partial and transient immunity with respect to the other three. Dengue fever can vary from mild to severe; the more severe forms of dengue fever include dengue hemorrhagic fever and dengue shock syndrome. Dengue hemorrhagic fever occurs when a person get infected by different type of dengue virus after being infected by another one sometimes before. Dengue shock syndrome is the most severe form of dengue infection. Dengue is found in tropical and sub-tropical climates worldwide, mostly in urban and semi-urban areas [1].Mathematical modelling of the population models continues to provide important insights into population behaviour and control. Over the years, it has also become an important tool in understanding the dynamics of diseases, and the decision making process regarding intervention programs for controlling population and disease problems in many countries [2].Mathematical modelling also became considerable important tool in the study of epidemiology because it helps in understanding the observed epidemiological patterns, disease control and provides understanding of the underlying mechanisms which influence the spread of disease and may suggest control strategies [1-8]. Moreover [9], presented a dynamical model that studied the temporal model for dengue disease with treatment. So far no research has considered a dynamical system that incorporates the control strategies to reduce the spread of the dengue fever disease through the campaign to educate the careless human susceptible, control vector human contact, removing vector breeding areas, insecticides application and control maturation rate from larvae to adult. In this work, we present an extension of the model of [9] to include temporary immunity, control strategies and Susceptibles with different behaviour i.e. the dynamical system that incorporates the effects Careful and Careless Susceptibles on the transmission of Dengue fever in the society with vaccination. In this paper, data reported by the ministry of health in Tanzania is used. In July 2010 for the first time in Dar es Salaam region -Tanzania, an outbreak of dengue fever was reported, over 40 people were infected and then also between May and July 2013,172 were infected with this disease. Moreover in the year 2014, the government of Tanzania announced the dangers of the disease in which people were alerted about the disease and the precaution to be taken. In this 2014, 399 people were infected in which 2 died of the disease in Dar es Salaam region (http://www.wavuti.com/2014/05/wizara-ya-afya-kitengo-cha.html). Data will be obtained from the different literature and estimated since there is no enough data in Tanzania. The purpose of this study is to match the empirical data with the modal simulation. Hence we formulate the SITRS (susceptible, Infected, Treated, Recovered, susceptible) and SVITRS (Susceptible, Vaccinated, Infected, Recovered, Susceptible) models for transmission of dengue fever disease.
2. Formulation of the Model
- In this section, we adopt the model presented in [10]. The model is based on two populations: humans and mosquitoes. Human population
 is divided into five groups such as
  - Careful human Susceptibles,
  - Careless human Susceptibles,
  - infected human,
  - treated infected human,
  - recovery infected human, so that we have
 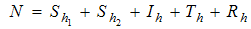 and the population of female mosquitoes, indexed by
  is divided into three groups that is
  -Aquatic phase (that includes the egg, larva and pupa stages),
  - Susceptibles (mosquitoes that are able to contract the disease),
  -Infectives (mosquitoes capable of transmitting the disease to human). In formulating the model, the following assumptions are considered:i. Total human population
  is constant,ii. The population is homogeneous, which means that every individual of a compartment is homogeneously mixed with the other individuals,iii. Immigration and emigration are not considered,iv. Each vector has an equal probability to bite any host,v. Humans and mosquitoes are assumed to be born susceptible i.e. there is no natural protection,vi. The coefficient of transmission of the disease is fixed and does not vary seasonally,vii. For the mosquito there is no resistant phase, due to its short lifetime,viii. The possibility of careless Susceptibles contracting dengue fever disease is higher than that for careful Susceptibles.Considering the above assumptions, we then have the following schematic model flow diagram for dengue fever disease with control:
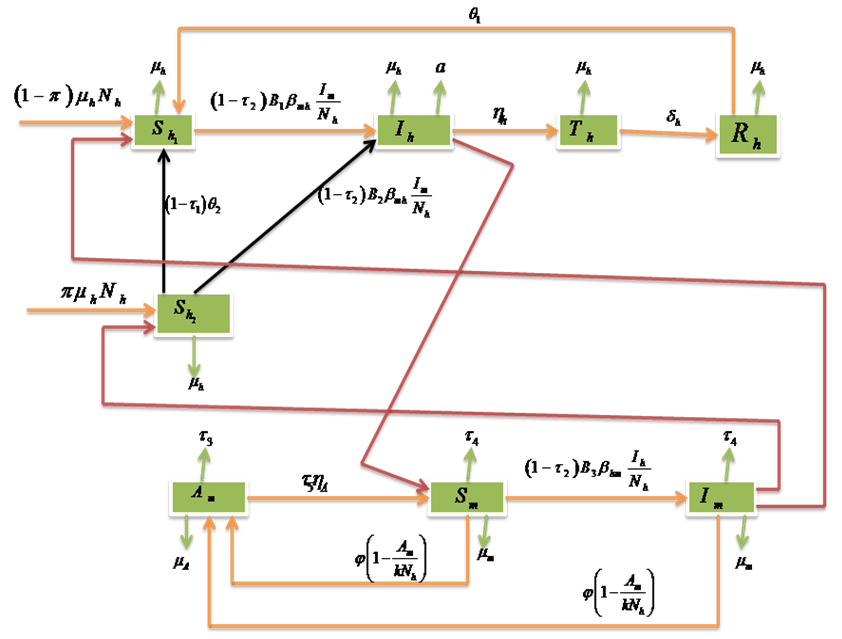 | Figure 1. Model Flow diagram for dengue fever disease with control |
 | (1) |
 is the transmission probability from
  (per bite),
  is the maturation rate from larvae to adult (per day),
  is the control maturation rate from larvae to adult,
  is the average daily biting (per day) for mosquito susceptible,
  is the transmission probability from
  (per bite),
  is the number of larvae per human,
  is the number of eggs at each deposit per capita (per day),
  is the fraction of subpopulation recruited into the population,
  is the average daily biting (per day) for careful human susceptible,
  is the average daily biting (per day) for careless human susceptible,
  is the Positive change in behaviour of Careless individuals,
  is the campaign of educating Careless human susceptible,
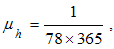
  is the average lifespan of humans (per day),
  is the per capita disease induced death rate for humans,
  is the natural mortality of larvae (per day),
  is the control of vector human contact ,
  is the reducing vector breeding areas,
  mean viremic period (per day),
  average lifespan of adult mosquitoes (per day),
  insecticide application,
  portion that moves from compartment
  to
to  due to loss of immunity and
  treatment parameter.
3. Model Analysis
- We study the solutions of System (1) in the closed set
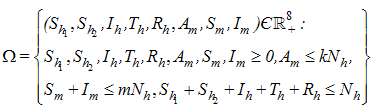 The set is positively invariant with respect to Equation (1) [10].
3.1. Disease Free Equilibrium (DFE)
- For the disease free equilibrium, it is assumed that there is no infection for both populations of human and mosquitoes i.e.
 and
and  , denoted by
  . Thus
  of the model system (1) is obtained as
 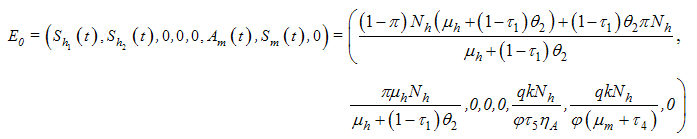 where
where 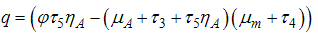
3.2. The Basic Reproduction Number, R0
- The basic reproduction number, denoted by
 , is defined as the average number of secondary infections that occurs when one infective individual is introduced into a completely susceptible population [11].The basic reproduction number of the model (1)
  is calculated by using the next generation matrix of an ODE [11]. Using the approach of [11].
  is obtaining by taking the largest (dominant) Eigen value (spectral radius) of
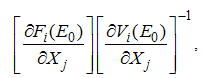 where,
  is the rate of appearance of new infection in compartment
  is the transfer of individuals out of the compartment
  by all other means and
  is the disease free equilibrium.
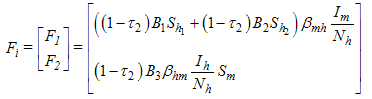 Using the linearization method, the associated matrix at DFE is given by
 This implies that
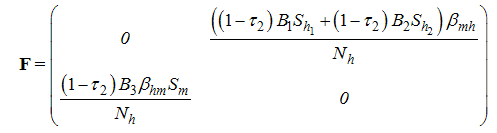 With
With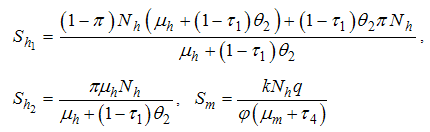 ,we have
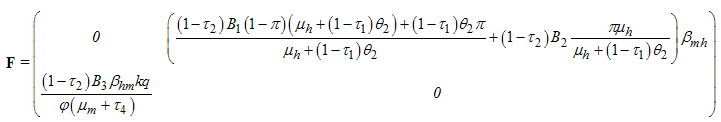 The transfer of individuals out of the compartment is given by
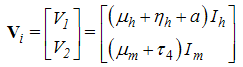 Using the linearization method, the associated matrix at DFE is given by,
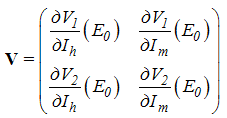 This gives
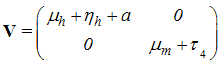 With
With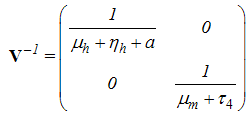 Therefore
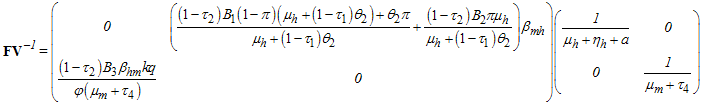 | (2) |
 This gives
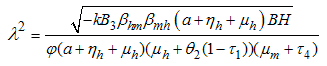 where
where 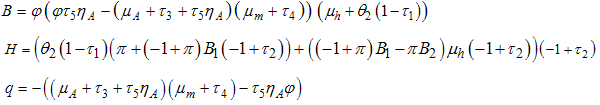 consequently
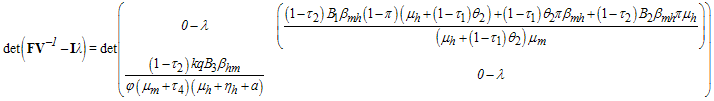
 It follows that the Basic Reproductive number which is given by the largest Eigen value for model system (1) denoted by
  is given by
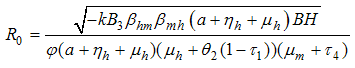 | (3) |
 , the disease cannot invade the population and the infection will die out over a period of time, and also, if
  , then an invasion is possible and infection can spread through the population. Generally, the larger the value of
  , the more severe, and possibly widespread the epidemic will be, [10].
3.3. Local Stability of Disease Free Equilibrium Point
- To determine the local stability of the disease free equilibrium, the variation matrix
 of the model system (1) corresponding to the disease free
  is obtained as
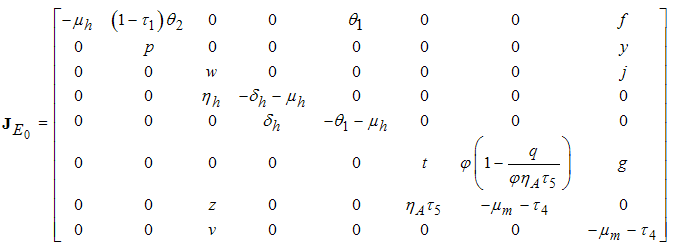 | (4) |
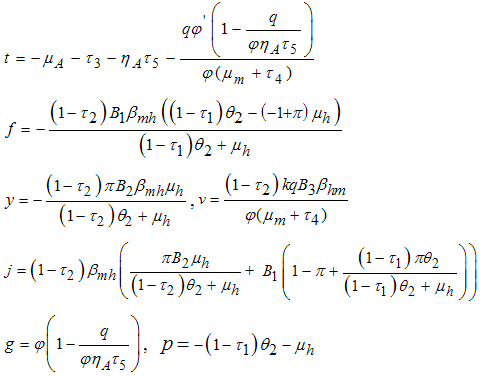
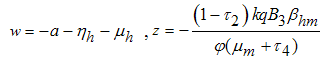 Therefore the stability of the disease free equilibrium point can be clarified by studying the behaviour of
  in which for local stability of DFE we seek for its all eigenvalues to have negative real parts. It follows that, the characteristic function of the matrix (4) with
  being the eigenvalues of the Jacobian matrix, by using Mathematica software gives the following values:
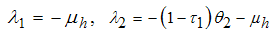 The other eigenvalues are given as
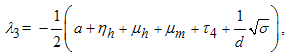 when
when  is not a real number,
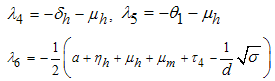 when
when  is not a real number,
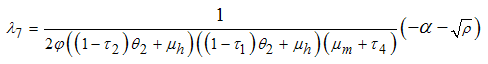 when
when  is not a real number, and finally.
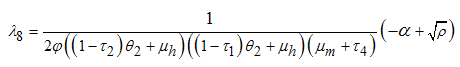 when
when  is not a real number, where
 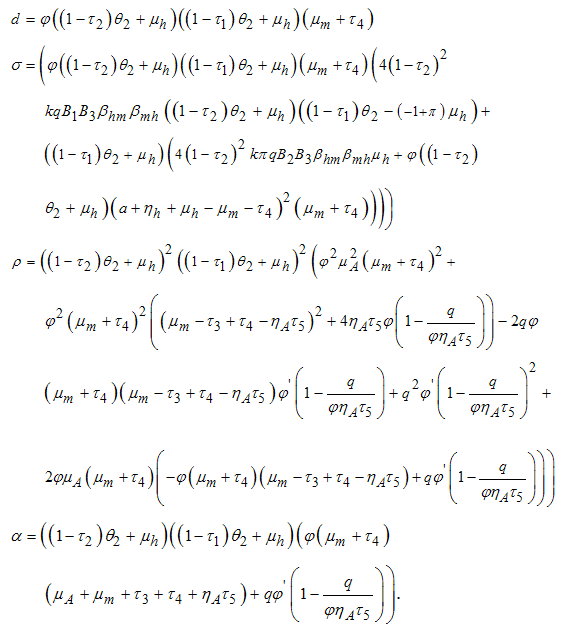 Hence under certain conditions the system is stable since all the eight eigenvalues are negative. These imply that at
  the Disease Free Equilibrium point is locally asymptotically stable.
3.4. Global Stability of Disease Free Equilibrium Point
- In this subsection, the global behaviour of the equilibria for system (1) is analysed. The following theorem provides the global property of the disease free equilibrium
 of the system. The results are obtained by means of Lyapunov function. In choosing the Lyapunov function, we adopt the idea of [12].Theorem1: If
  , then the infection-free equilibrium is globally asymptotically stable in the interior of
  .Proof: To establish the global stability of the disease-free equilibrium, we construct the following Lyapunov function:
 | (5) |
 along (4), we obtain
  Then substituting
 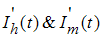 from system (1), we get
 it follows that
 where
where  Thus,
Thus,  is negative if
  and
and  if and only if
  is reduced to the DFE. Consequently, the largest compact invariant set in
 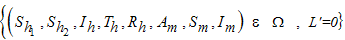 when
when  is the singleton
  . Hence, by LaSalle’s invariance principle, it is implied that
  is globally asymptotically stable in Ω [13]. This completes the proof.
3.5. Existence of Local and Global Asymptotic Stability of Endemic Equilibrium
- Since we are dealing with presence of dengue fever disease in human population, we can reduce system (1) to a 4-dimensional system by eliminating
 respectively, in the feasible region
  . The values of
  can be determined by setting
  to obtain
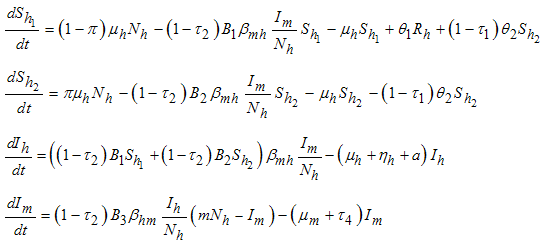 | (6) |
3.5.1. The Endemic Equilibrium and Its Stability
- Here, we study the existence and stability of the endemic equilibrium points. If
 then the host-vector model system (6) has a unique endemic equilibrium given by
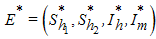 in
in  , with
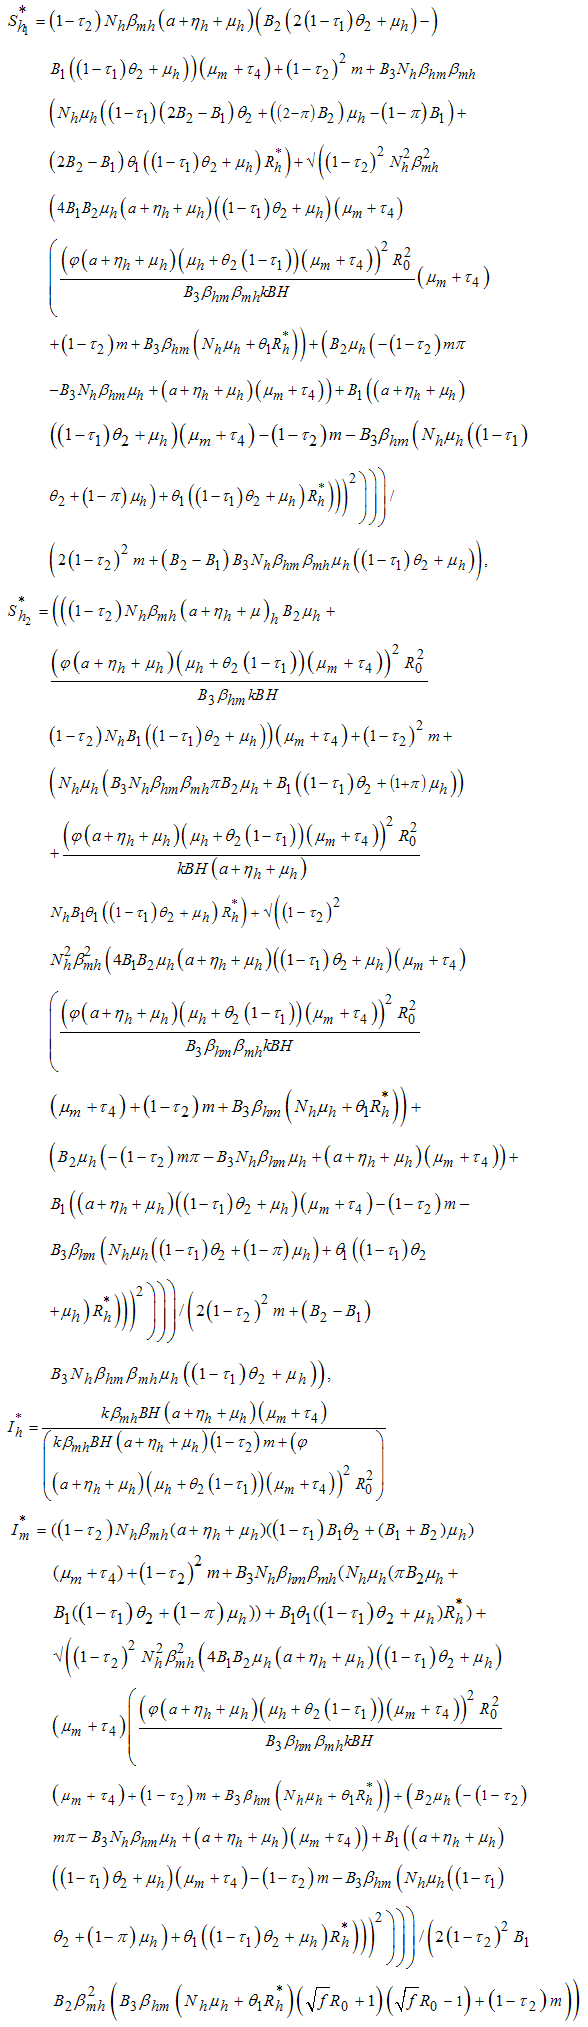 But from (3)
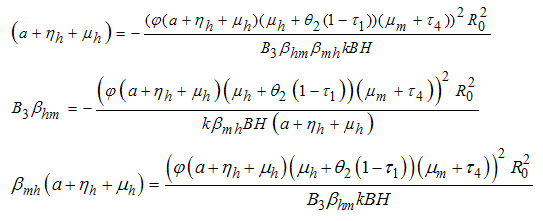 where
where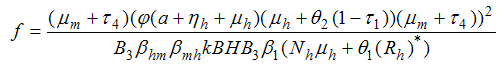
3.5.2. Local Stability of the Endemic Equilibrium
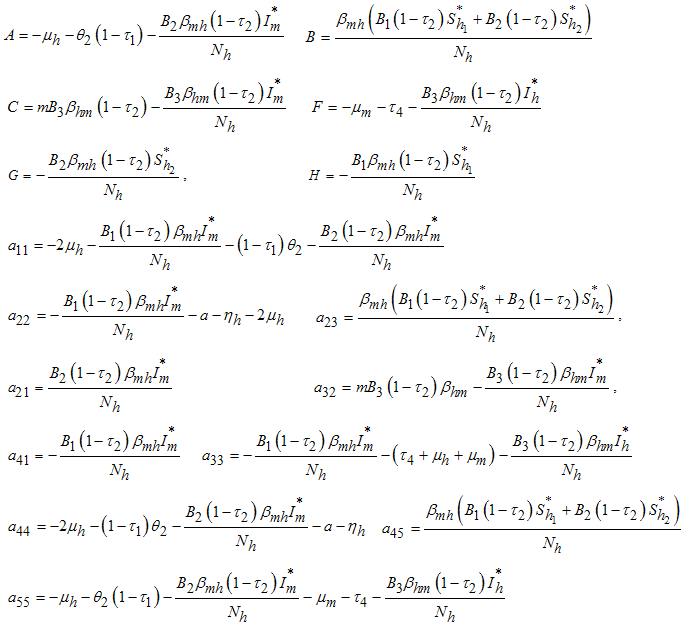
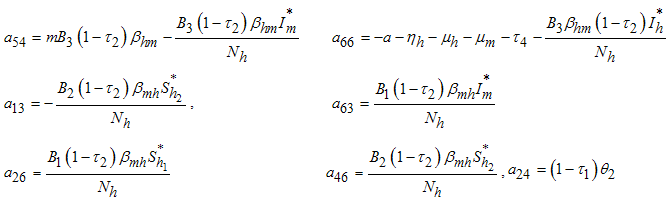
- In order to analyse the stability of the endemic equilibrium, the additive compound matrices approach is used, using the idea of [14]. Local stability of the endemic equilibrium point is determined by the variational matrix
 of the nonlinear system (6) corresponding to
  to get
 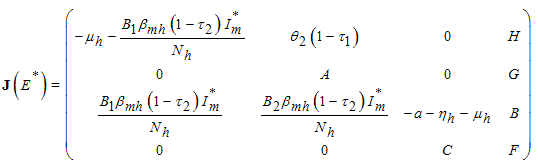 | (7) |
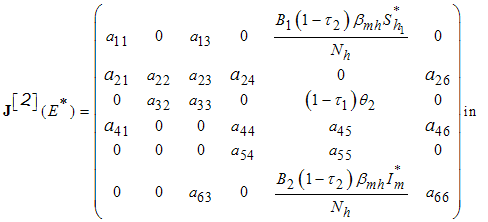 | (9) |
 The following lemma is stated and proved by [15] to demonstrate the local stability of endemic equilibrium point
  .Lemma 1: Let
  be a
be a  real matrix.If
  and
and  are all negative, then all eigenvalues of
  have negative real parts.Using the above Lemma, we will study the stability of the endemic equilibrium.Theorem 2: If
  the endemic equilibrium
  of the model (1) is locally asymptotically stable in
  .Proof: From the Jacobian matrix
  in (7), we have .
 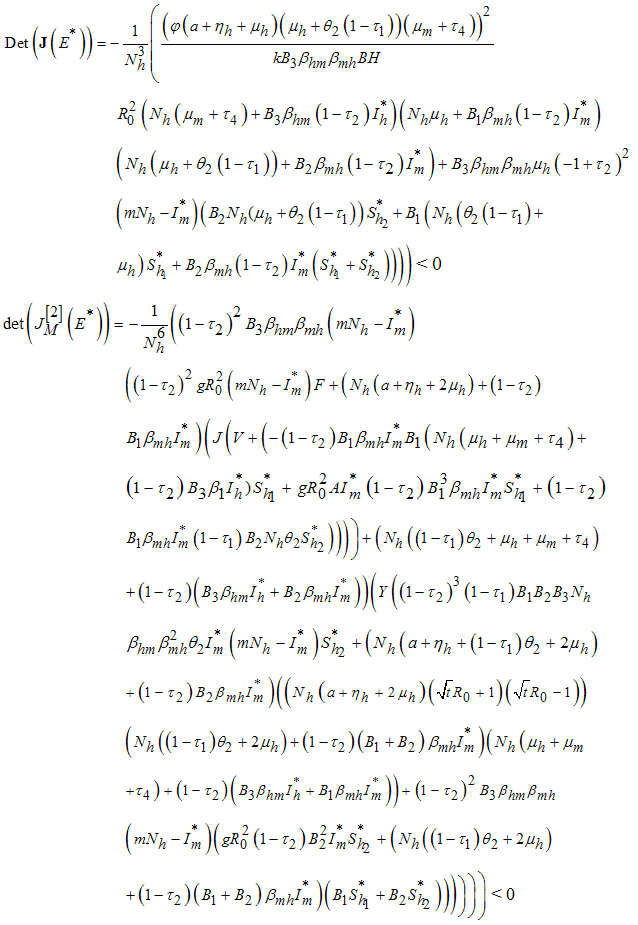 But
But  from (3)Let
 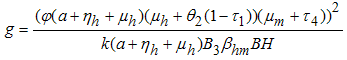 It follows that
 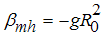 where
where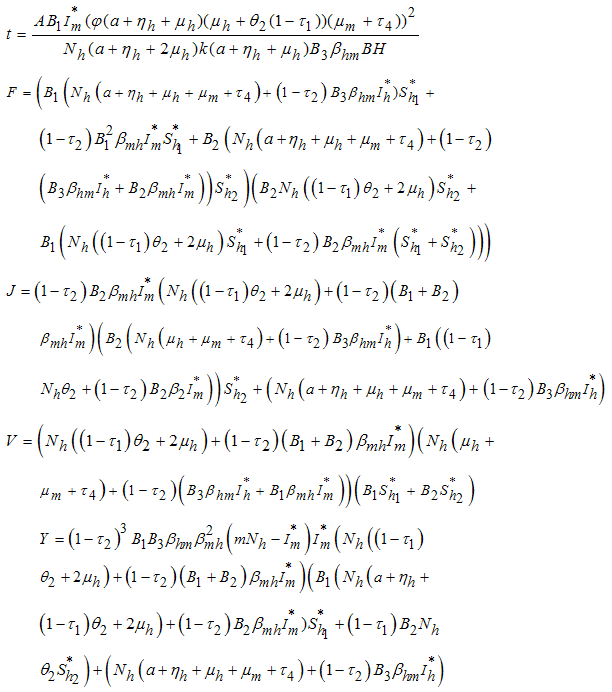 Thus, from the lemma 1, the endemic equilibrium
  of the model system (7) is locally asymptotically stable in
  .
.3.6. Global Stability of Endemic Equilibrium Point (EEP)
- Theorem 3: If
 the endemic equilibrium
  of the model system (1) is globally asymptotically stable.Proof: To establish the global stability of endemic equilibrium
  we construct the following positive Lyapunov function
  as follows;
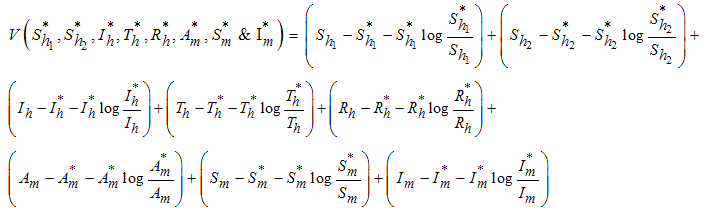 Direct calculation of the derivative of
  along the solutions of (1) gives,
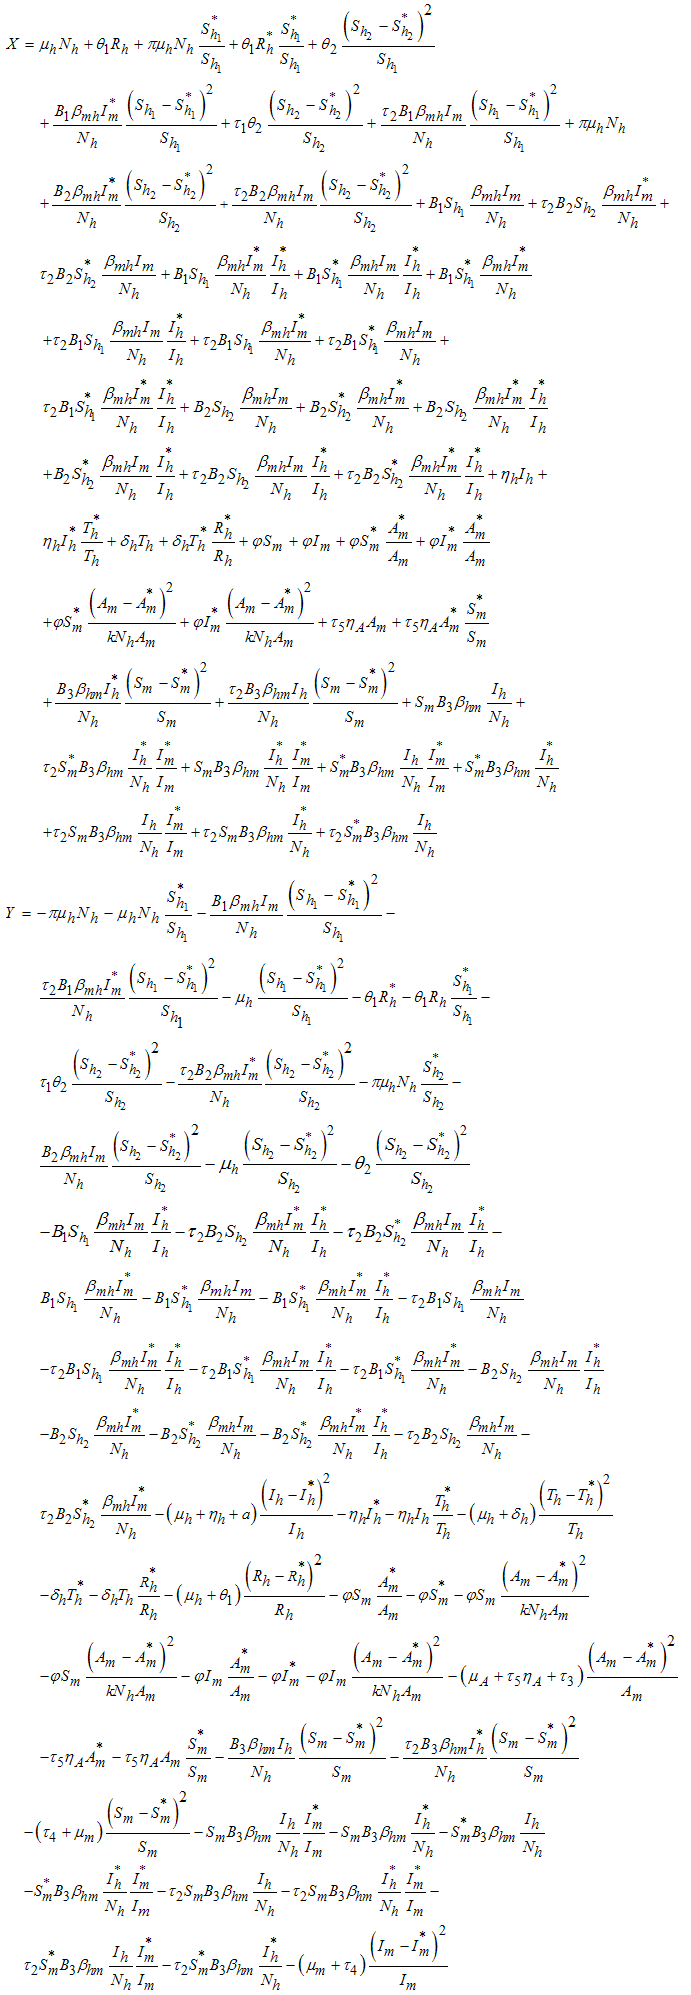
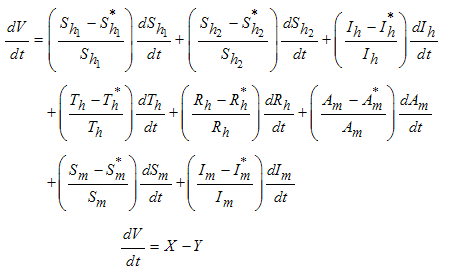 | (8) |
 Thus from equation (8), if
  Then
Then  will be negative definite, implying that
  . It then follows that
  if and only if
  . Therefore the largest compact invariant set in
  is the singleton
  where
where  is the endemic equilibrium of the model system (1). By LaSalle’s invariant principle, then it implies that
  is globally asymptotically stable in
  if
if  . This completes the proof.
4. Numerical Simulations
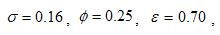
- Here, we illustrate the analytical results of the study by carrying out numerical simulations of the model system (1). Parameter values are obtained from the different literatures like (http://www.wavuti.com/2014/05/wizara-ya-afya- kitengo- cha.html), [9], [10] and [16]. Other parameter values are estimated to vary within realistic means and given as shown below.


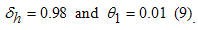 Figures 2 show the distribution of population with time in all classes of human and mosquito when no control is applied.Figures 2 show the human and mosquito populations in the absence of any control. The human infection reaches a peak between the 2th and the 20th day. The infection of the mosquitoes reaches a peak between the 10th and the 30th day. The total number of infected humans obtained from System (1) is higher than observations in Tanzania. The difference is due to the absence of the data in the whole country of Tanzania [17].
 | Figure 2. Distribution of population with time in all classes of human and mosquito when no control is applied i.e.   |
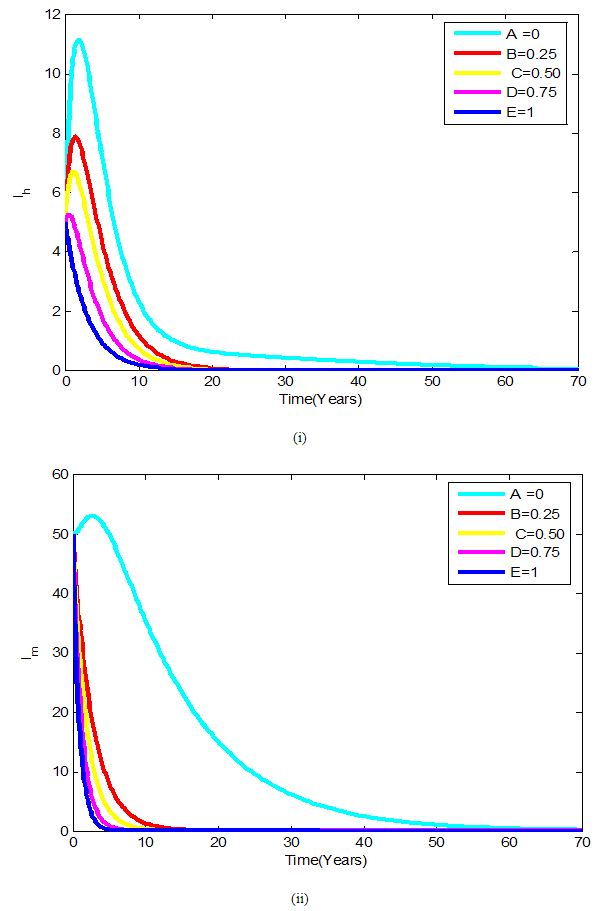 | Figure 3. (i)-(ii): Variation of infected human and mosquito populations with combine use of all five controls |
5. Formulation of the Model with Vaccination
- In this section, we develop a deterministic model that describes the dynamics of Dengue fever under application of Vaccination and treatment for humans where
 is the careful human susceptible population,
  is the careless human susceptible population,
  is the vaccinated human population,
  is the infected human population,
  is the treated human population and
  is the recovered human population,
  is the fraction of the vaccinated careful human susceptible,
  is the proportional rate at which vaccinated careful human susceptible loses effect,
  is the reaction of the vaccinated careless human susceptible,
  is the proportional rate at which vaccinated careless human susceptible loses effect,
  is the proportion of the vaccinated new born,
  is the infection rate of vaccinated careful human susceptible and
  is the infection rate of vaccinated careless human susceptible. Susceptible individuals acquire Dengue fever through the bite of female Aedes mosquito with force of infections given by
  , and
, and  where
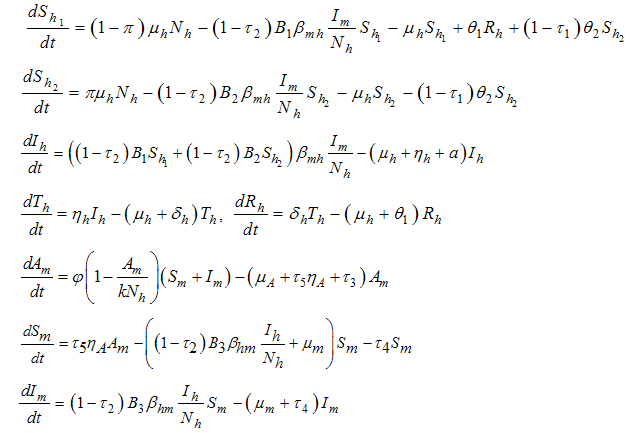
where  .Considering the above clarification, we then have the following schematic model flow diagram for dengue fever disease with vaccination:From the above flow diagram, the model will be governed by the following equations [17]:
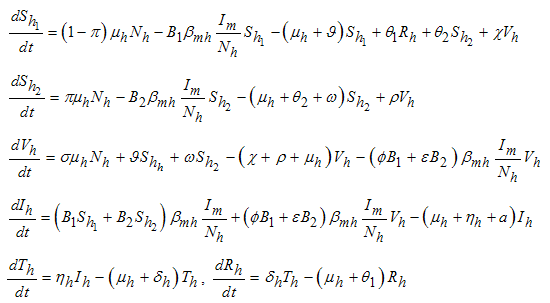 | (10) |
 of vaccinated new born. A fraction
  and
and  of careful and careless susceptible is vaccinated respectively. The vaccination reduces but does not eliminate susceptibility to infection. For this reason, we consider the infection rate of vaccinated people: when
  the vaccine is perfect and when
  the vaccine has no effect at all. The vaccination loses effectiveness at a rate
  and
and  careful and careless susceptible respectively [17].
5.1. Model Simulation
- Here, we perform numerical simulations of the model system (11) using the set of estimated parameter values. Parameter values are obtained from the different literatures like (http:/e/www.wavuti.com/2014/05/wizara-ya-afya-kitengo-cha.html), [9], [10], [16], other parameter values are estimated to vary within realistic means and given as
 ,
, 

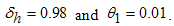 Figures 4 show the variation of infected human populations with different levels of infection rate of vaccinated careful human susceptible
  , infection rate of vaccinated careless human susceptible
  , fraction of the vaccinated careful human susceptible
  and fraction of the vaccinated careless human susceptible
  .From figure 4 we vary infection rate of vaccinated careful susceptible
  , infection rate of vaccinated careless human susceptible
  , fraction of the vaccinated careful human susceptible
  and fraction of the vaccinated careless human susceptible
  , and it is observed that the effectiveness of the vaccine reduces the disease spread.
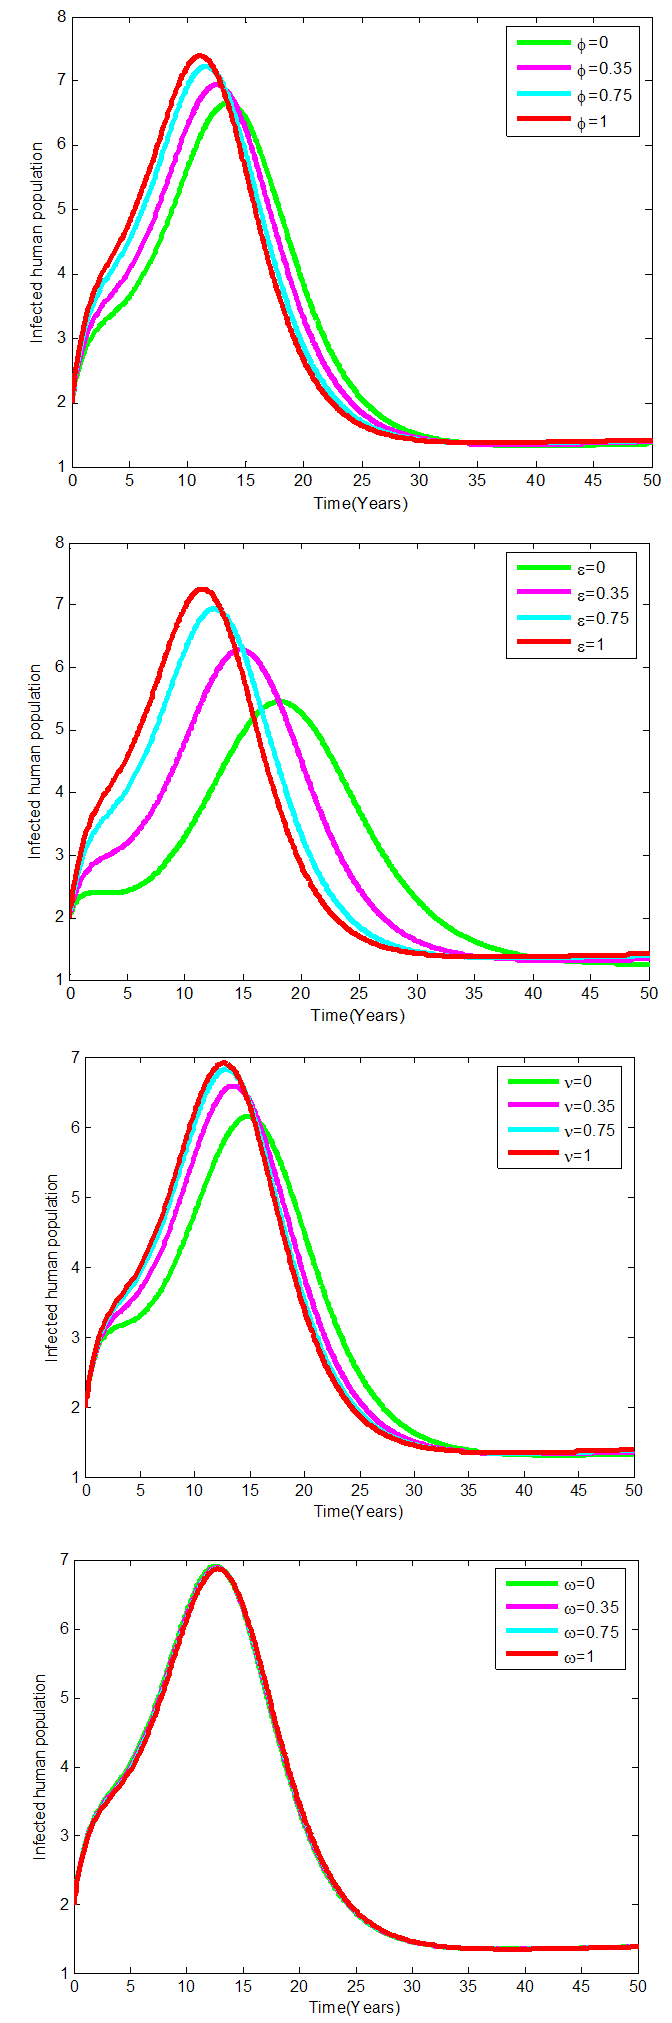 | Figure 4. Variation of infected human populations with different levels infection rate of vaccinated careful human susceptible  , infection rate of vaccinated careless human susceptible , infection rate of vaccinated careless human susceptible  , fraction of the vaccinated careful human susceptible , fraction of the vaccinated careful human susceptible  and fraction of the vaccinated careless human susceptible and fraction of the vaccinated careless human susceptible  |
 | Figure 5. Model Flow diagram for dengue fever disease with vaccination |
6. Conclusions
- A compartmental model for Dengue fever disease was presented, The was model based on campaign of educating Careless human susceptible
 , control vector human contact
  , reducing vector breeding areas
  , and insecticide application
  , control maturation rate from larvae to adult
  and treatment. The results show that Treatment and the controls on the transmission of dengue fever disease will have a positive effect on decreasing the growth rate of dengue fever disease. Then also shows that when
  the infected human population decrease and when
  the infected human population increase.