-
Paper Information
- Paper Submission
-
Journal Information
- About This Journal
- Editorial Board
- Current Issue
- Archive
- Author Guidelines
- Contact Us
American Journal of Computational and Applied Mathematics
p-ISSN: 2165-8935 e-ISSN: 2165-8943
2014; 4(6): 225-238
doi:10.5923/j.ajcam.20140406.06
Water Transport through the Membrane of PEM Fuel Cell
 Abstract
 Reference
 Full-Text PDF
 Full-text HTML
K. M. Salah Uddin1, Litan Kumar Saha2, Nabuyuki Oshima3
1Department of Management Information Systems, University of Dhaka, Dhaka, Bangladesh
2Department of Mathematics, University of Dhaka, Dhaka, Bangladesh
3Faculty of Engineering, Hokkaido University, Sapporo, Japan
Correspondence to: Litan Kumar Saha, Department of Mathematics, University of Dhaka, Dhaka, Bangladesh.
| Email: |  |
Copyright © 2014 Scientific & Academic Publishing. All Rights Reserved.
Transport of water through the membrane of a PEM fuel cell is one of the critical issues for PEFC performance improvement. Since, the water in the membrane is transported from anode side to cathode side by electro osmotic drag caused by the proton transport. On the other hand, water is diffuse from cathode to anode side by back diffusion flux. Therefore, a delicate water balance is necessary to attain high proton conductivity of the membrane. In order to predict the water distribution in the different layer of PEFC, a three dimensional water transport model is developed which is able to capture the physics occurs in the membrane for transporting water from anode side to cathode side or vice-versa. To check the feasibility of our developed model validation test was carried out by comparing the simulation result with experimental work. This comparison validated the applicability of our developed model quantitatively for low relative humidity and qualitatively for higher relative humidity. The water content profile through the membrane was observed flat for relative humidity 40%. The water content profile in the membrane under the channel was lower than under the rib. With the increase of relative humidity the water content distribution through the membrane increases. The water transport mechanism through the membrane also has been pointed out.
Keywords: Current Density, Numerical Simulation, Relative Humidity, Water Content, Water Transport
Cite this paper: K. M. Salah Uddin, Litan Kumar Saha, Nabuyuki Oshima, Water Transport through the Membrane of PEM Fuel Cell, American Journal of Computational and Applied Mathematics , Vol. 4 No. 6, 2014, pp. 225-238. doi: 10.5923/j.ajcam.20140406.06.
Article Outline
1. Introduction
- PEM fuel cell is thought to be a promising candidate for mobile and vehicle applications, because of its high power density and low operating temperature. However, some technical problems remain to be solved in achieving practicability and commercialization. Maintaining an optimal level of water is a critical issue in PEM fuel cell because sufficient water is needed to maintain the proton conductivity of the PEM but the accumulation of too much liquid water in the cathode can cause flooding, obstructing transport of the oxygen reactant from the gas channel to the reaction sites of the catalyst layer. The transport of water in the membrane of a polymer electrolyte fuel cell will be focused in this study. A key element in ensuring optimal performance of a PEM fuel cell is the proper management of water. There is a complex relationship between the water content of a PEM fuel cell and the cell’s performance. The water content, which has a close relationship to the proton conductivity, directly controls the performance of a PEM fuel cell [1]. Failing to manage water properly results in either flooding or drying out in the membrane of the cell [2]. There are four basic modes for water transport across the PEM.1. Back diffusion: Water transport as a result of the concentration gradient-driven flow from the cathode side to the anode side.2. Electro osmotic drag: Water transport from the anode side to the cathode side through the membrane as a result of proton transporting through the membrane.3. Hydraulic permeation: Water transport through the membrane as a result of gas or capillary pressure gradient between anode and cathode side.4. Thermo osmosis flux: Thermo osmosis water flux is caused by the temperature- gradient.Electro osmotic drag and back diffusion are basic mechanisms for water transport in the PEM fuel cell [3]. These two phenomena are strongly interrelated and ultimately determine the overall water flux in the membrane. Water transportation in the membrane by electroosmosis and back diffusion has been extensively studied [4, 5]. The effect of hydraulic permeation is generally negligible compared with the effects of electroosmotic and back diffusion because of very low hydraulic permeability is very low [6]. Recently, Kim and Mench [7] described temperature-driven water transport in the membrane by a process known as thermo-osmosis.In recent decades, a great deal of research effort has been devoted to transport phenomena of individual components; this work includes one-dimensional studies [1, 8, 9], two-dimensional studies [10, 11], and several three-dimensional models.Okada et al. [9] proposed a one-dimensional mathematical model of the water-content profile of the membrane. Their studies showed that the water content in the membrane is greatly influenced by the electrical current density and by the water transfer coefficient. Springer et al. [1, 8] developed a one-dimensional model that describes the transport of water through membrane. They measured the diffusion coefficient, the electroosmotic drag coefficient, and the membrane proton conductivity experimentally as functions of the water content. Fitted curves were incorporated into their one-dimensional model to capture the water-transport phenomena in the membrane. Fuller and Newman [10] developed a quasi-two-dimensional mathematical model of transport in the PEM fuel cell to address fuel utilization, water and heat management. The model developed by Nguyen and White [11] is identical to the model developed by Fuller and Newman, except that it incorporates variable hydration of the polymer electrolyte membrane, as proposed by Springer et al. [1, 8].In the current study, a three-dimensional, single-phase water transport model is proposed based on that of Springer et al. [1, 8]. Up to now, the structural models of the catalyst layer in the literatures can be categorized into three classes: interface models [12, 13], pseudo-homogenous models [14, 15] and heterogeneous models [16]. In the current modeling, the catalyst layer is treated as a very thin layer, so that it is not considered directly as a computational domain. However, all the variables and their gradients are computed in the line of the catalyst by an averaging model.
2. Governing Equation
- The three-dimensional, single-phase, isothermal mathematical model of a PEFC is based on previous works by Mazumder and Cole [18, 19]; Meng and Wang [20] and used later for Gas flow simulation and performance prediction by Saha et. al. [21] and Salahuddin et. al. [22, 23] where all the governing equa-tions except water transport model is well described.
2.1. Water Transport Modeling
- In general, the transport of gases in channels and porous media is driven by both convection and diffusion. Convection is induced by the consumption or production of materials in the electrochemical reaction. Convective flow through the porous media can also depend on the nature of the flow field that is used, especially in the case of a serpentine channel. Therefore, the current model will consider both diffusion and convection as means of gas-phase transport.The protonic conductivity of the membrane, which has a marked effect on the performance of the cell, depends on the level of hydration of the membrane. Therefore, to develop a model of the fuel cell it is important to understand the physics of water transport in the cell and how this affects the cell’s performance [24], and to develop a modeling framework that incorporates these factors. First, we need to understand the nature of the three phases of water (liquid-phase water, gas-phase water, and solid-phase water) that are transported in the fuel cell and to confirm the definitions of these phases. In the PEM fuel cell, water can be present as three phases: the solid phase, the gas phase, and the liquid phase. Each of these states of water is not necessarily present in every domain of the cell. For example, water vapor (gas phase) is always present in the gas diffusion layer but not in the membrane, whereas solid-phase water is present only in the membrane and the catalyst layer, where ionomers are present (i.e., within polymers). The PEM is a solid that contains no voids and which can chemically incorporate water in the form of the hydronium ion (H3O+). Water in this form in the auxiliary PEM is responsible for proton transport. Water molecules that are transported through the PEM from the anode to the cathode along with protons (H+) will be referred to as water content λ transport in the PEM, where λ is the dimensionless quantity defined as follows:
 | (1) |
 (kg/m3) is the dry density of the PEM, EW is the equivalent weight (mass) of the PEM (kg/mol),
  is the water vapor concentration (mol/m3), and Vex is the coefficient of expansion of the PEM.The liquid-phase (saturation) water s, expressed as a percentage of the volume of liquid water that is present in the void volume, is expressed by the following equation:
 | (2) |
 | (3) |
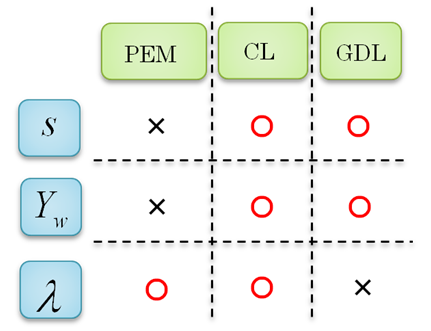 | Figure 1. Relationship between three kind of water and the materials of a PEM fuel cell (PEM = polymer electrolyte membrane, CL = catalyst layer, GDL = gas diffusion layer) |
2.1.1. Water Transport in the Membrane Region
- Transport of water in the membrane is generally described in terms of two major mechanisms: (i) back diffusion as a result of the presence of a water concentration gradient between the anode side and the cathode side, and (ii) the electro-osmotic drag caused by migration of water as protons are transported through the membrane. The diffusivity of dissolved water is strongly dependent on the temperature and the water content of the membrane, which is a function of the temperature and the water activity. The water content λ can be calculated from the ratio of the number of water molecules to the number of charged (SO3H+) sites.
 | (4) |
 | (5) |
 | (6) |
2.1.2. Water Transport in the Region of the Gas Diffusion Layer
- The gas diffusion layer is a porous medium made from carbon fiber or carbon cloth, which permit gas to flow readily in the pores of gas diffusion layer. The water that is produced can condense or evaporate in the gas diffusion layer, depending on the environment. To describe the distribution of liquid water and gas-phase transport of water vapor in our current model, we need to solve the two set of equations that are discussed below.The governing equation for the transport and formation of liquid water can be written as follows:
 | (7) |
 , where ε is the porosity of the porous medium), ρl is the density of liquid water, and ρg is the density of the gas mixture. The density of the two-phase mixture is defined as follows:
 | (8) |
 | (9) |
 | (10) |
 | (11) |
 | (12) |
 | (13) |
 | (14) |
 | (15) |
 | (16) |
 | (17) |
 is the effective mass diffusivity given by the following expression [20]:
  | (18) |
 | (19) |
 | (20) |
2.1.3. Water Transport in the Catalyst Layer Region
- In this model, the catalyst layer is considered to be a very thin layer and is therefore not considered directly as a computational domain. However, all the variables and their gradients are calculated in the line of the catalyst layer and the thickness of the catalyst layer is also taken into account in a special way. For the water content in the catalyst layer, the average profile of water content is used. In the catalyst layer, the water content in the polymer electrolyte is related to the activity of water in adjacent pores by using an experimentally derived relationship for Nafion:
 | (21) |
 | (22) |
 is the average mole fraction of water vapor.The basic equations for water transport together with the boundary conditions at every interface are listed in Table 1. The thin-layer modeling approach was used in our model.
|
2.1.4. Model Assumptions
- 1. The water produced in the cell is assumed to be water vapor and there is no condensation or evaporation.2. Flow is incompressible and laminar.3. Porous media are assumed to be isotropic and homogeneous.4. The temperature regime is assumed to be isothermal (no variations in the temperature).5. Gas and liquids (hydrogen, oxygen, or water vapor) do not penetrate into membrane.6. Contact resistance between any two parts of the fuel cell is negligible.
3. Computational Domain
- In the experiments performed by Tsushima et al. [17], magnetic resonance imaging (MRI) was used to investigate the distribution of water in the membrane of an operational PEM fuel cell, and the effects of relative humidity and current density on the through-plane water-content distribution in the membrane were examined. The experimental setup and the MRI visualization system are shown in Fig. 2. In the experiments, five parallel channels were used as flow channels. The design of the computational domain used in the present simulation is based on the geometry used in the experiments. However, to reduce the computational load and costs, only a single channel with half a rib region on both sides is considered.
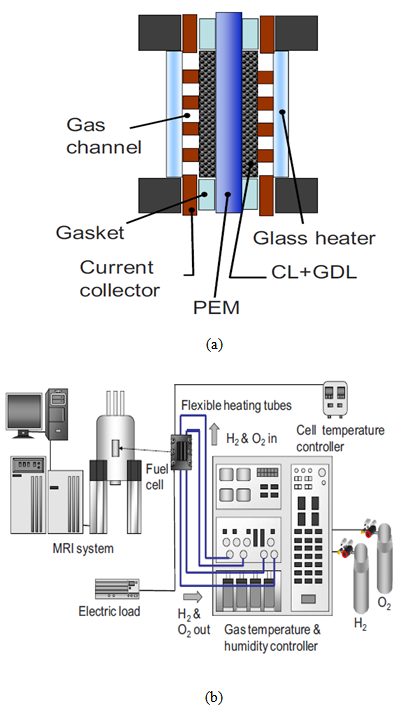 | Figure 2. (a) Schematic of a cross-sectional view of a PEM fuel cell for EMRI experiments (b) EMRI system for PEM fuel cell visualization [17] |
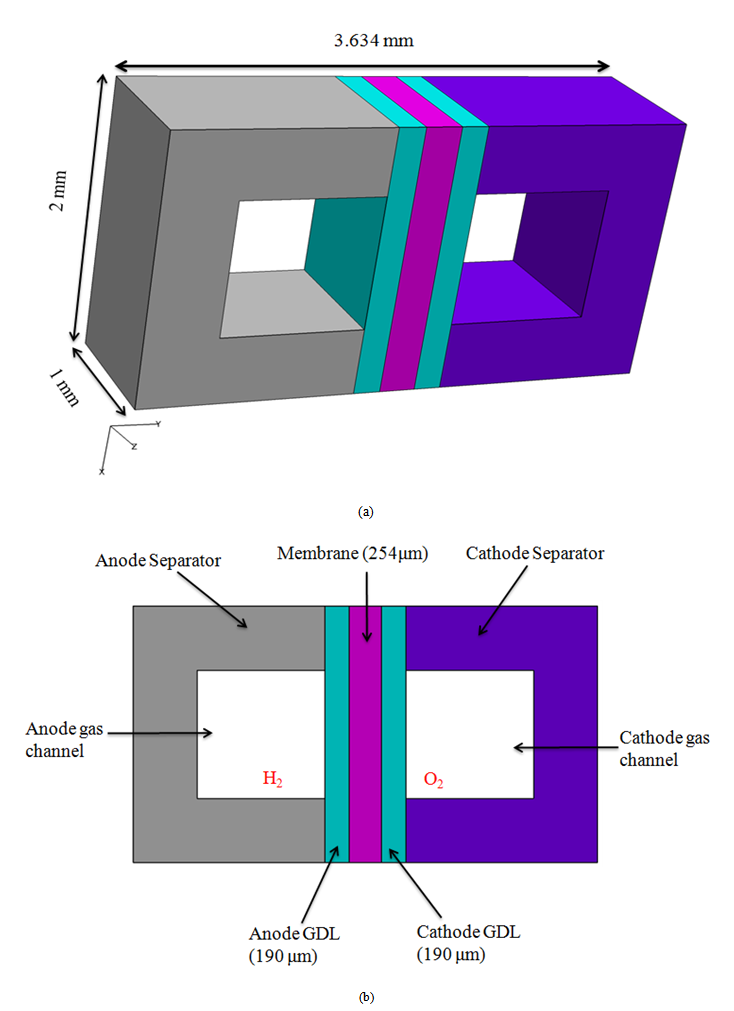 | Figure 3. (a) Computational domain and (b) cross-sectional view of the calculation domain |
4. Solution Strategy
- Equations for continuity, momentum, species, electrons, and protons, along with the equations for water transport through the membrane and for electrochemical reactions were solved simultaneously to obtain the results. The time-dependent conservation equations were discretized by the finite-volume method and solved by using the software FrontFlow/Red, which takes into account the porous nature of the computational domain.
5. Results and Discussion
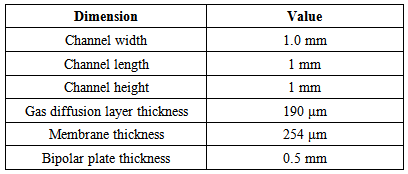
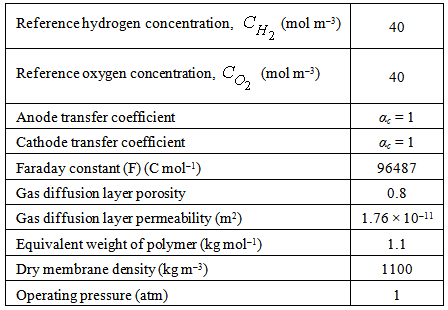
- The numerical scheme described above and the physical and operating parameters listed in Tables 2 and 3 were used to obtain the numerical results that are discussed below.
|
|
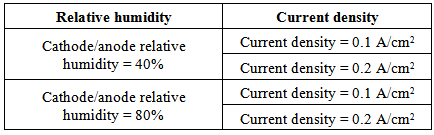
5.1. Effects of Low Relative Humidity
5.1.1. Convergence History
- Convergence and steady-state simulation are very important for analyzing real physics, because unsteady solutions can entail a great deal of variation; this is sometimes very impractical, as the results are dependent on the choice of initial conditions, algorithm, and grid. We therefore first needed to confirm that our simulations attained a steady state. In the simulation, we assumed that the membrane was initially hydrated at the appropriate level of humidity corresponding to each set of operating conditions. The initial level of hydration within the membrane was assumed to be uniform.The convergence history of the water content profile in the polymer membrane under the channel/rib is shown in Fig. 4.
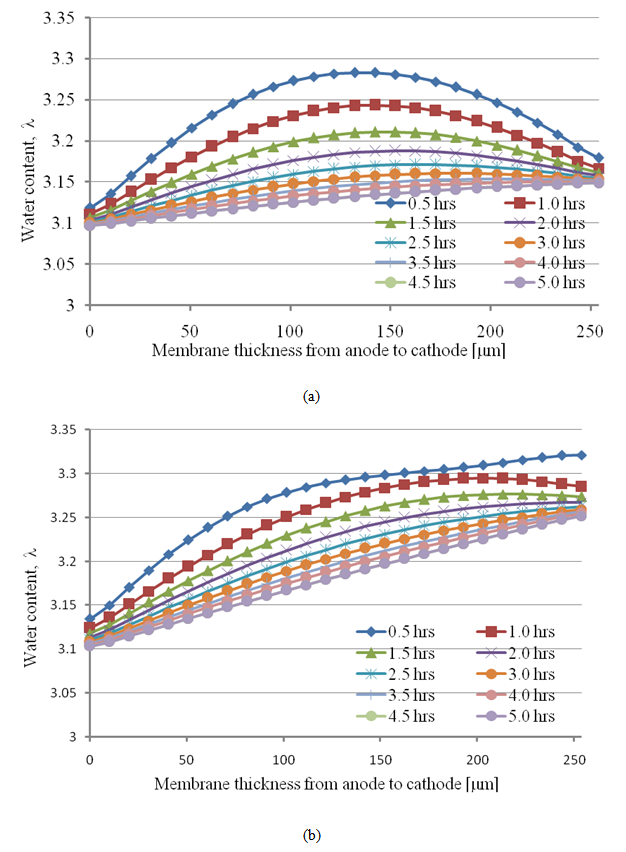 | Figure 4. The unsteady water content distribution through the membrane (a) under the channel and (b) and under the rib of a PEM fuel cell |
5.1.2. Current Density Distribution
- Fig. 5 shows the local current-density distribution in the middle of the membrane. The current density distribution in the membrane under the rib is higher than that under the channel. Therefore, amount of water produced under the rib is greater than that under the channel.
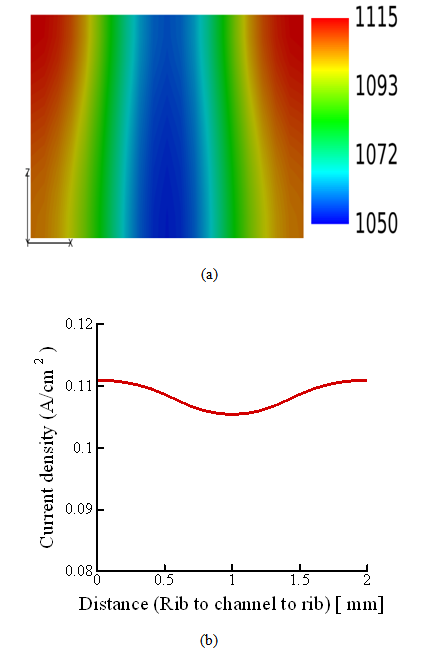 | Figure 5. (a) Local current-density distribution in the middle of the membrane; (b) current-density distribution along the center line fig. (a) in the direction from the rib to the channel |
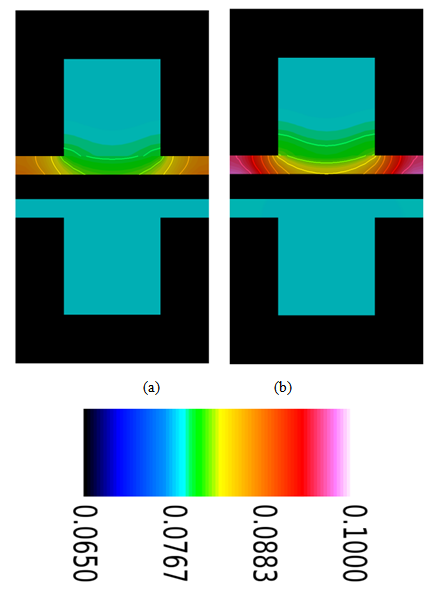 | Figure 6. Water concentration distribution in the gas channel and the gas diffusion layer (both anode and cathode sides) at a relative humidity of 40% and current densities of (a) 0.1  and (b) 0.2 and (b) 0.2  |
5.1.3. Water Concentration
- The removal of water from under the rib is less efficient than that under the channel, and this contributes to the accumulation of water under the rib. From Fig. 6 one can easily see that the water-concentration gradient through the membrane is steeper under the rib than under the channel. However, the water concentration gradient when the fuel cell is operated at the lower current density (0.1 A/cm2) is less than that when it is operated at the higher current density (0.2 A/cm2).The water content distributions for various operating current densities and a relative humidity of 40% are shown in Fig. 7. The water content in the membrane increases when the PEM fuel cell is operated at a higher current density. However, the increase of water content in the membrane is small and it is most pronounced in the section of the membrane underneath the rib.
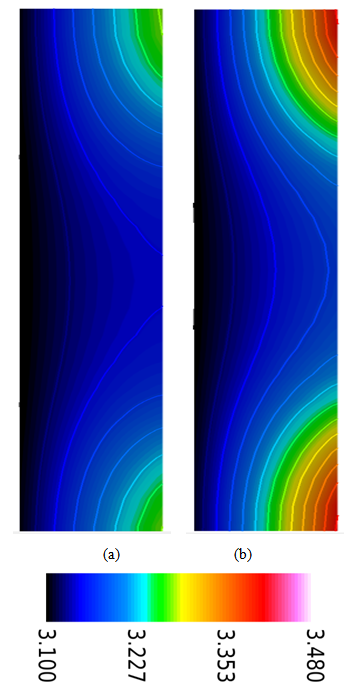 | Figure 7. Water content distribution in the membrane (anode and cathode sides) at a relative humidity of 40% and current densities of (a) 0.1 and (b) 0.2  |
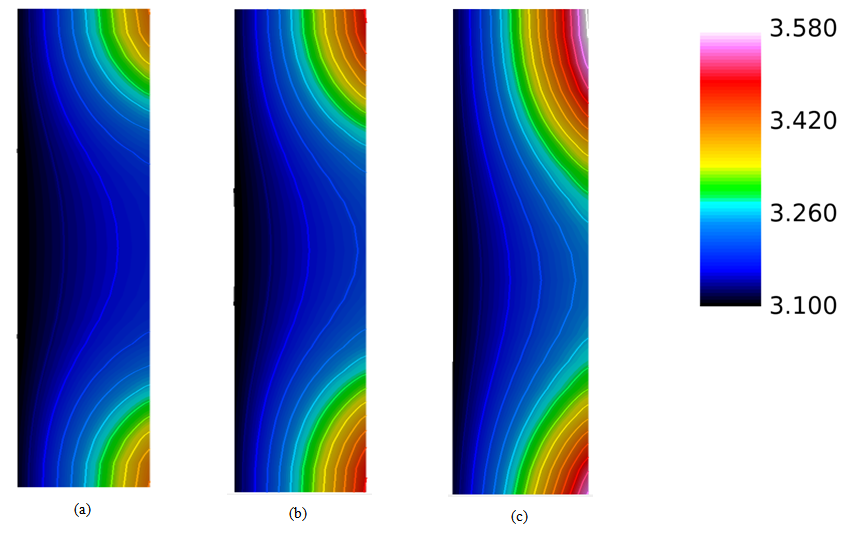 | Figure 8. Water content distribution (a) near to the inlet region, (b) at the middle of the cell, and (c) near the outlet region for a relative humidity of 40% and a current density of 0.2  |
5.1.4. Numerical Validation of the Developed Model at a Low Humidity
- To validate our computational model, we carried a numerical simulation using the same conditions as those used in the experimental study of Tsushima et al. [17].Calculated and experimental through-plane water-content profiles are presented in Figure 9 for various fuel-cell operating conditions; the results were obtained by averaging the profile of water content in the membrane under the channel with that in the membrane under the rib. The results of the numerical simulations with the present model agreed well with the experimental measurements. When the relative humidity was 40%, the water content profile in the membrane calculated by numerical simulation was flat and unaffected by the current density, in a similar manner to that shown by experiment. For a current density of 0.2 A/cm2, the calculated water content profile was also very close to the experimental profile. The results in Fig. 9 show that molecular diffusion in the membrane plays a major role in water transport in the membrane at a low relative humidity. Near the edge, however, there was a difference between the simulation and the experimental results.
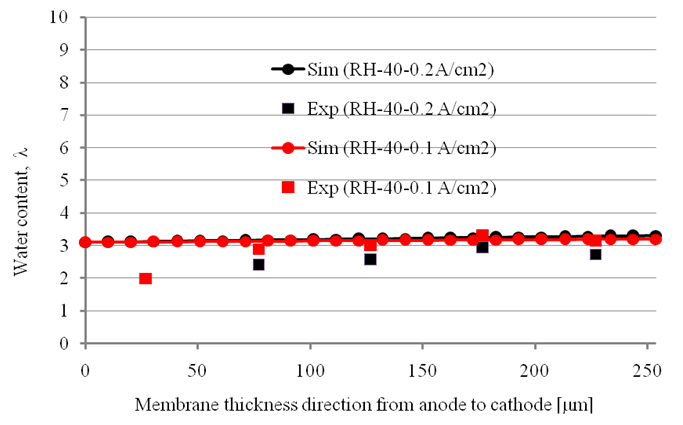 | Figure 9. Comparison of simulation (Sim) results with experimental ones (Exp) |
5.2. Effects of High Relative Humidity
- The water content and water concentration distributions in the membrane, the gas channel, and the gas diffusion layer were also predicted at a high relative humidity in a similar manner to that described above.
5.2.1. Convergence History
- Figures 10(a)–(b) show the steadiness of the water content profiles in the membrane underneath the channel and underneath the rib.
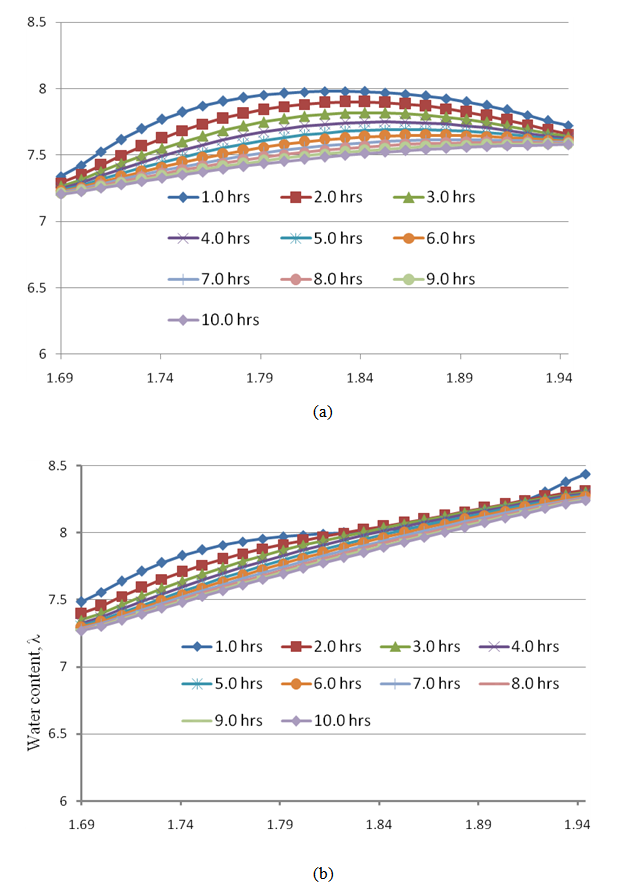 | Figure 10. Convergence history of water content through the membrane (a) under the channel and (b) under the rib at a high humidity (80%) and a current density of 0.1  |
5.2.2. Water Concentration
- The water vapor concentration in the gas channel and gas diffusion layer for a high relative humidity at a current density 0.1 A/cm2 is presented in Fig. 11. The water vapor concentration in the gas diffusion layer in the direction from the channel inlet to the outlet gradually increases as water is produced by electrochemical reaction and moves towards the outlet position as a result of convective flow. Therefore, the water concentration at the outlet region is higher than that at other positions in the cell.
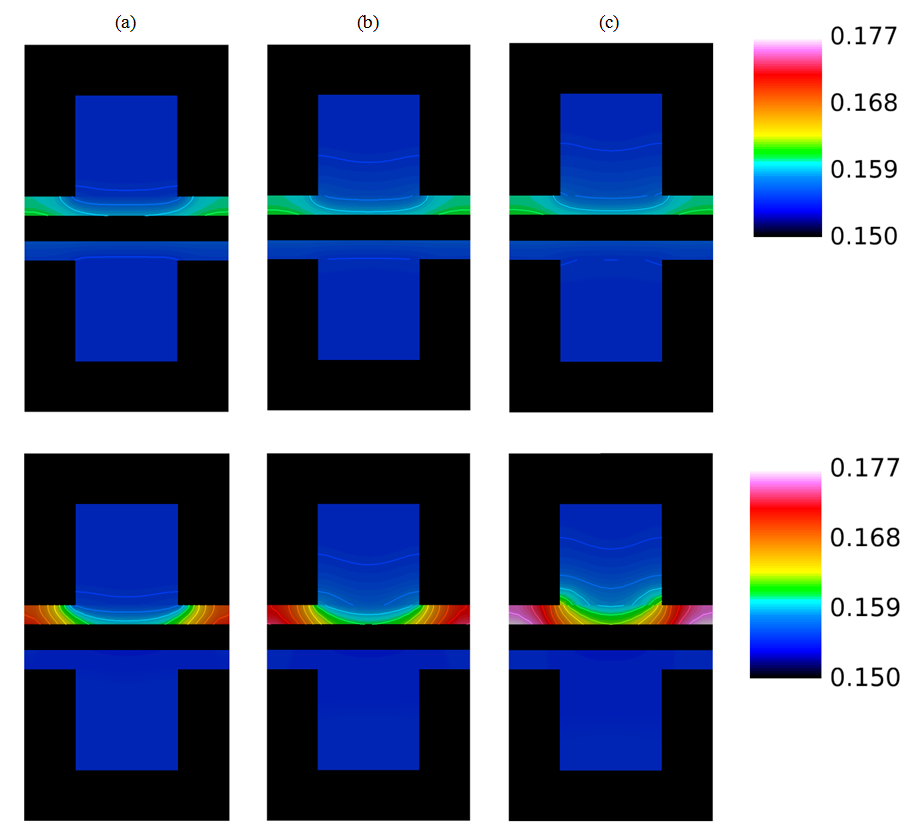 | Figure 11. Water concentration distributions (a) near to the inlet region (b) in the middle of the cell, and (c) near the outlet region for a high relative humidity (80%) and a current density of 0.1  and 0.2 and 0.2  |
5.2.3 Numerical Validation of the Developed Model at a High Humidity
- Finally, Figures 13(a)–(b) show a comparisons between the predicted and experimental water contents in the membrane for a high relative humidity and current densities of 0.1 A/cm2 and 0.2 A/cm2.In contrast to the low relative humidity, in the case of high relative humidity (80%), the water content profile through the membrane is not flat both in simulation and experiment. For current density 0.1 A/cm2, the water content profile through the membrane is linear. Since, with low current density, the influence of electro-osmotic drag flux is very small, therefore, back diffusion is only dominant factor for transporting water content in the membrane. Moreover, with the increase of current density, the water content profile through the membrane is non-linear. Therefore, diffusion flux caused by water concentration gradient and electro-osmotic flux playing an important role in transporting water in the membrane in the case of high relative humidity 80% and current density 0.2 A/cm2. Hence our developed model can capture the basic transporting phenomena of water content in the membrane.
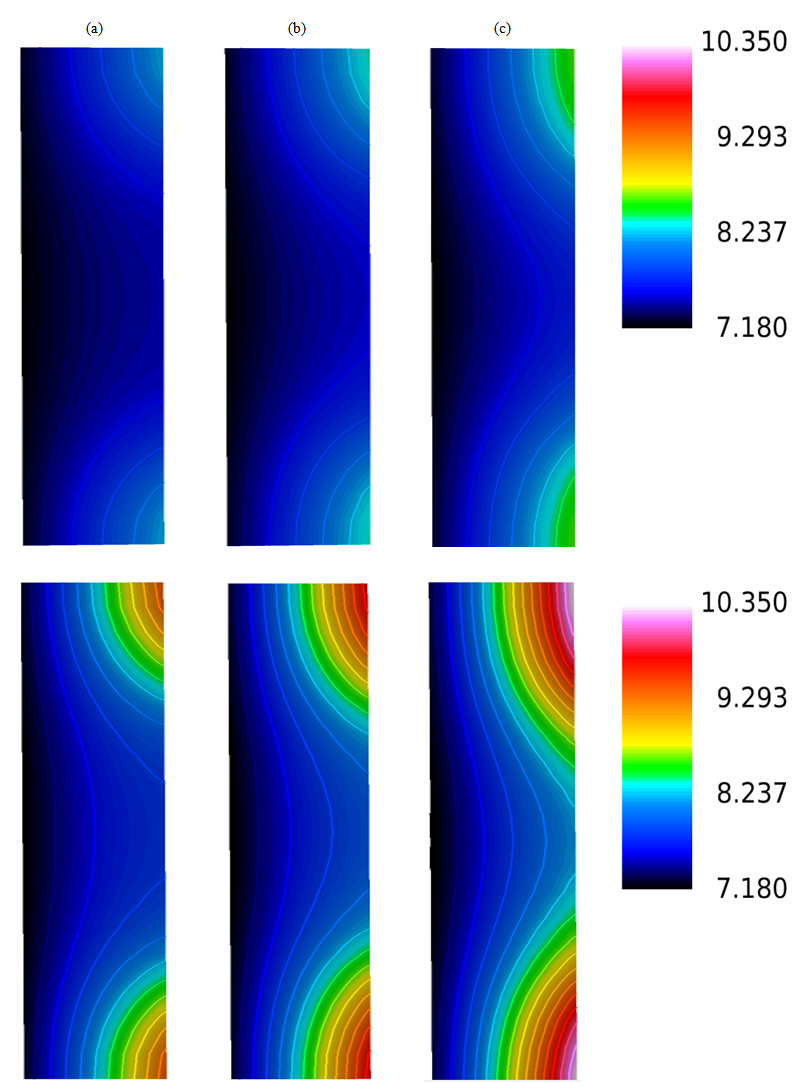 | Figure 12. Water content distributions (a) near the inlet region, (b) in the middle of the cell, and (c) near the outlet region for a high humidity (80%) and current densities of 0.1 and 0.2  |
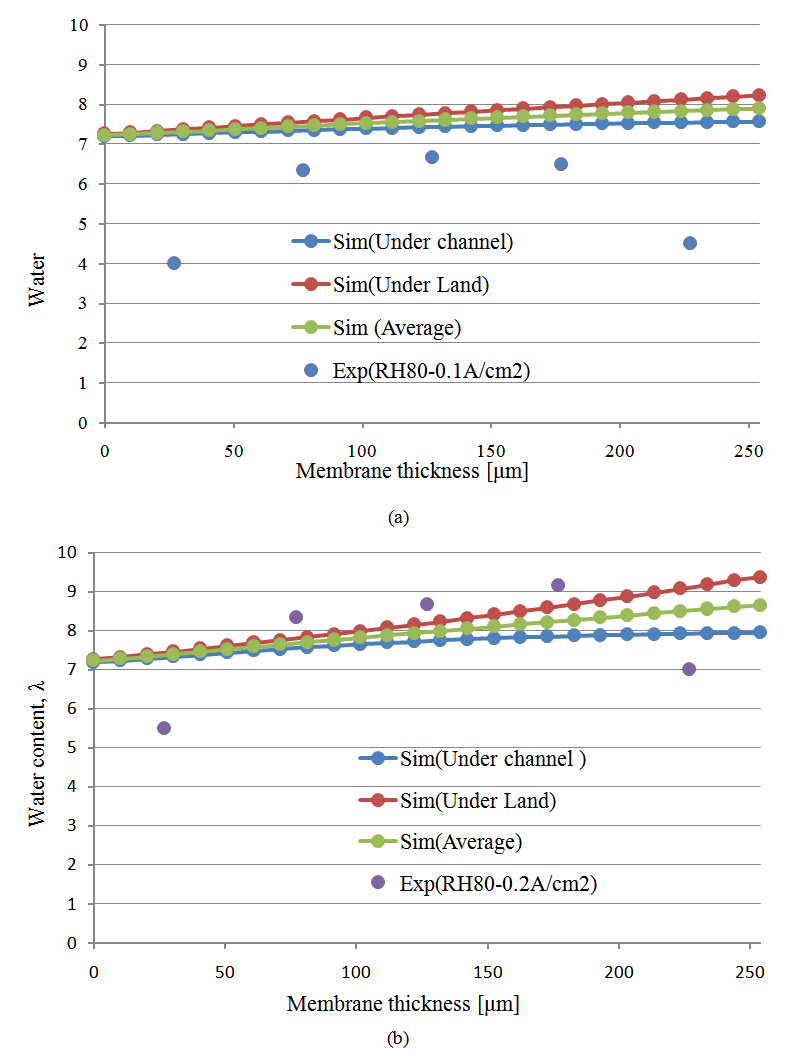 | Figure 13. Comparison of the experimental (Exp) and simulated (Sim) water content profiles in the membrane for a relative humidity of 80% and current densities of (a) 0.1 A/cm2 and (b) 0.2  |
6. Conclusions
- A three dimensional isothermal single phase model has been developed considering the variation of hydration in the membrane that was applied to an actual operating PEM fuel cell. This newly developed computational model has been validated quantitatively for low relative humidity (40%) and qualitatively for high relative humidity (80%), by comparing the results of the experimental study of Tsushima et al. [17]. With low relative humidity (40%) and under the current density 0.1 A/ cm2 and 0.2 A/ cm2, the water content profile in the membrane is flat and unaltered by current density. In the case of high relative humidity (80%), the water content profile within the membrane is linear (when current density 0.1 A/cm2) and non-linear (when current density 0.2 A/cm2). The water content within membrane increases with increasing current density. Finally, the water content profile observed through the membrane under the rib is higher than under the channel which is strongly marked for higher humidity.