| [1] | Adebola, F.B. and Adepetun, A.O. (2011): A new Tripartite Randomized Response Technique. Journal of the Nigerian Association of Mathematical Physics, Volume 19: pp 119-122. |
| [2] | Adebola, F.B. and Adepetun, A.O. (2012): On a Numerical Comparison of the Proposed Randomized Response Technique with Hussain and Shabbir. Journal of the Nigerian Association of Mathematical Physics, Volume 20: pp 379-384. |
| [3] | Adebola, F.B. and Adepetun, A.O. (2012): On a Qualitative Comparison of the Proposed Randomized Response Technique with Hussain and Shabbir (2007). International Journal of Mathematical Theory and Modeling, Volume 2:pp 61-67. |
| [4] | Adepetun, A.O. and Adebola, F.B. (2014): On the Relative Efficiency of the Proposed Reparametized Randomized Response Model. International Journal of Mathematical Theory and Modeling, Volume 4: pp 58-67. |
| [5] | Barabesi, L., Marcheselli, M. (2006): A practical implementation and Bayesian estimation in Franklin’s randomized response procedure. Communication in Statistics- Simulation and Computation, 35, 365-573. |
| [6] | Barabesi, L., Marcheselli, M. (2010): Bayesian estimation of proportion and sensitivity level in randomized response procedures. Metrika, 72, 75-88. |
| [7] | Christofides, T.C. (2003): A generalized randomized response technique. Metrika, 57, 195-200. |
| [8] | Folsom, R. E., Greenberg, B. G., Horvitz, D. G., Abernathy, J. R. (1973): The two alternate question randomized response model for human surveys. Journal of the American Statistical Association, 68, 525-530. |
| [9] | Greenberg, B., Abul-Ela, A., Simmons, W., Horvitz, D. (1969): The unrelated question randomized response: theoretical framework. Journal of the American Statistical Association, 64, 529-539. |
| [10] | Hussain, Z., Shabbir, J. (2009a): Bayesian estimation of population proportion of a sensitive characteristic using simple Beta prior. Pakistan Journal of Statistics, 25(1), 27-35. |
| [11] | Hussain, Z., Shabbir, J. (2009b): Bayesian Estimation of population proportion in Kim and Warde (2005) Mixed Randomized Response using Mixed Prior Distribution. Journal of probability and Statistical Sciences, 7(1), 71-80. |
| [12] | Hussain, Z., Shabbir, J. (2012): Bayesian Estimation of population proportion in Kim and Warde Mixed Randomized Response Technique. Electronic Journal of Applied Statistical Analysis, Vol. 5, Issue 2, 213 – 225. |
| [13] | Hussain, Z. Shabbir, J., Riaz, M. (2011): Bayesian Estimation Using Warner’s randomized Response Model Through Simple and Mixture Prior Distributions. Communications in Statistics- Simulation and Computation, 40(1), 159-176. |
| [14] | Kim, J. M., Tebbs, J. M., An, S. W. (2006): Extension of Mangat’s randomized response model. Journal of Statistical Planning and Inference, 36(4), 1554-1567. |
| [15] | Kim, J.M. and Warde, D.W. (2004): A stratified Warner’s Randomized Response Model. J. Statist. Plann. Inference, 120(1-2), 155-165. |
| [16] | Mangat, N.S. (1994): An improved randomized response strategy. J. Roy. Statist. Soc. Ser. B, 56(1), 93-95. |
| [17] | Migon, H., Tachibana, V. (1997): Bayesian approximations in randomized response models. Computational Statistics and Data Analysis, 24, 401-409. |
| [18] | O’Hagan, A. (1987): Bayes linear estimators for randomized response models. Journal of the American Statistical Association, 82, 580-585. |
| [19] | Oh, M. (1994): Bayesian analysis of randomized response models: a Gibbs sampling approach. Journal of the Korean Statistical Society, 23, 463-482. |
| [20] | Spurrier, J., Padgett, W. (1980): The application of Bayesian techniques in randomized response. Sociological Methodology, 11, 533-544. |
| [21] | Unnikrishnan, N., Kunte, S. (1999): Bayesian analysis for randomized response models. Sankhya, B, 61, 422-432. |
| [22] | Warner, S.L. (1965): Randomized Response: a survey technique for eliminating evasive answer bias. J. Amer. Statist. Assoc., 60, 63-69. |
| [23] | Winkler, R., Franklin, L. (1979): Warner’s randomized response model: A Bayesian approach. Journal of the American Statistical Association, 74, 207-214. |
 Abstract
 Reference
 Full-Text PDF
 Full-text HTML
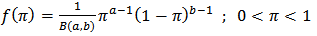
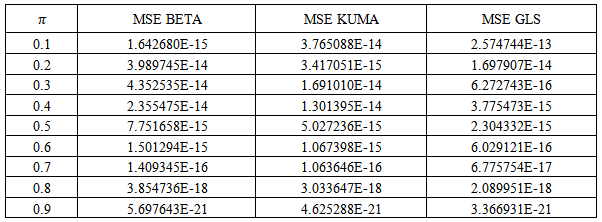
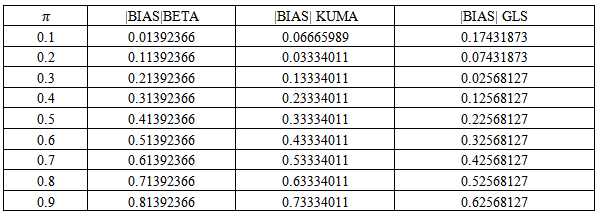
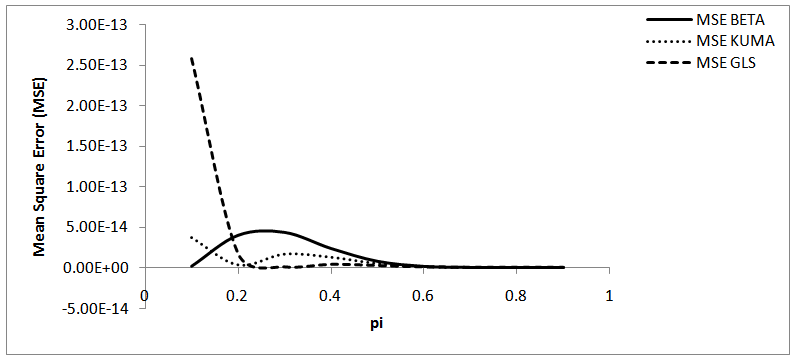
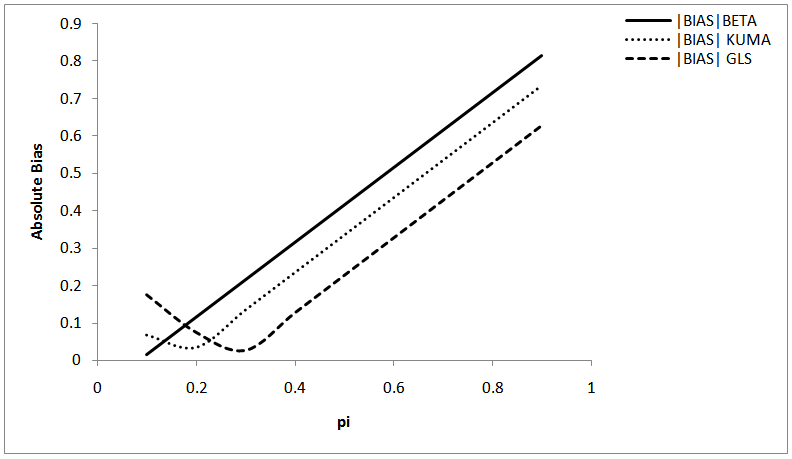
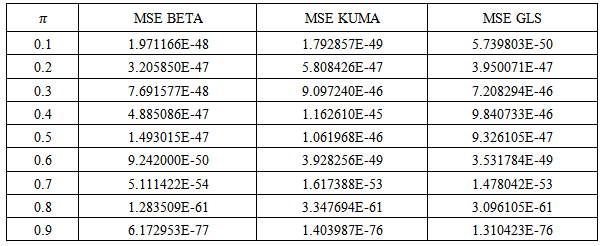
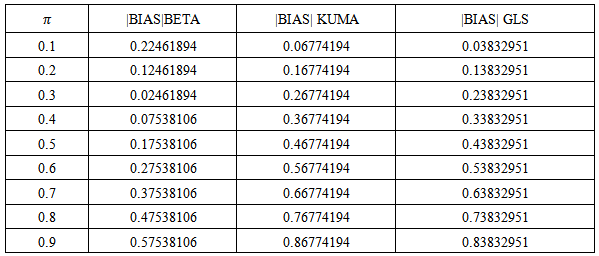
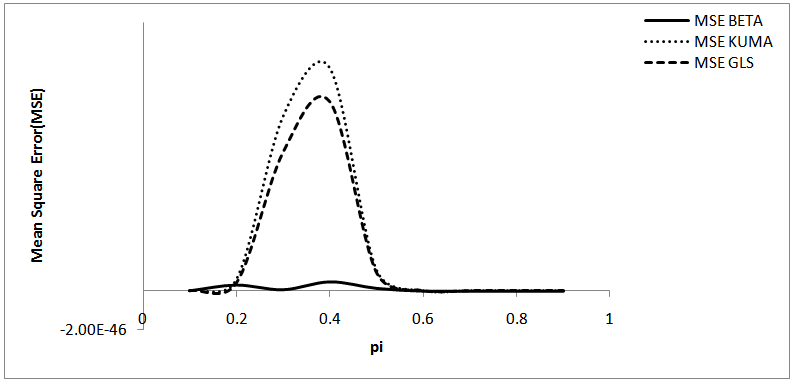
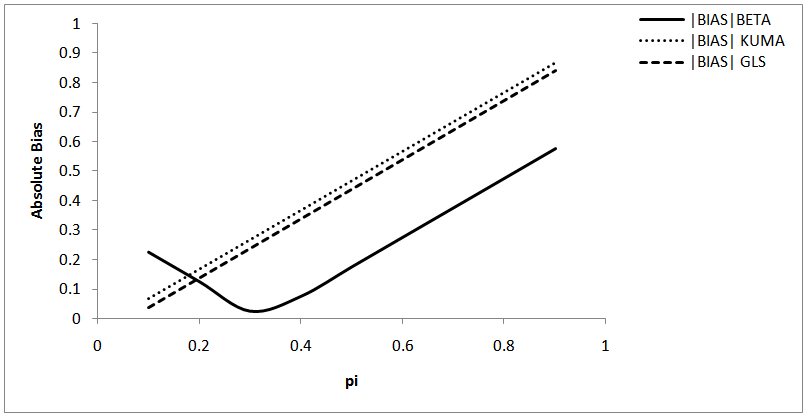
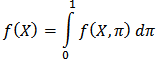
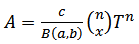
 are the shape parameters of the distribution and
  is the population proportion of respondents possessing the stigmatized attribute.By letting
  denotes the total number of the yes response in a sample of size n drawn from the population with simple random sampling with replacement (srswr). The conditional distribution of
  given
given  is
is 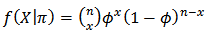
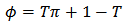 is the probability of “yes response” in a sample of size n and
  and
and  are the pre-assigned probabilities respectively.Then
 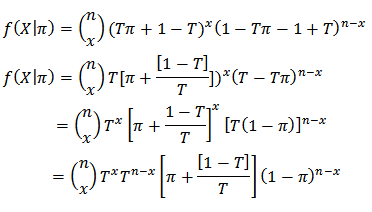 Let
Let 
 Using binomial series expansion
 and X was derived as follows
 given X was
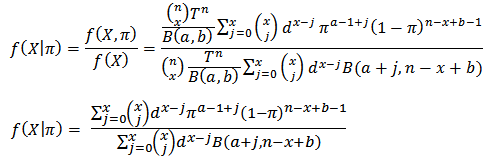
 corresponding to the sample of size n was given by
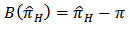
 Using Kumaraswamy Prior
 is given as
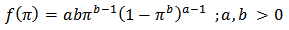
 and X with Kumaraswamy Prior is as follows
 Recall that
 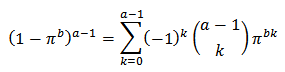 Then
Then 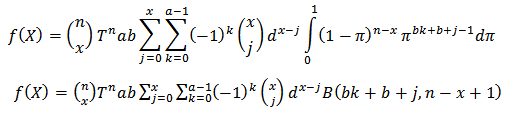
 Thus the posterior mean is
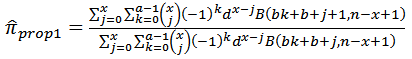
 is computed as
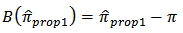
 Using Generalised Beta Prior
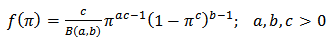
 are the shape parameters of the prior distribution as given in formula (3.7)We recall from Binomial series expansion that
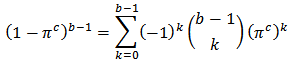 So that
 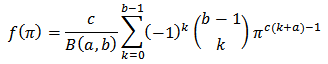 The joint density function of
  and X with generalized beta prior is
 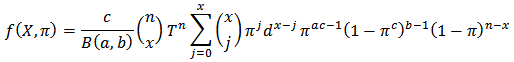 which simplify to
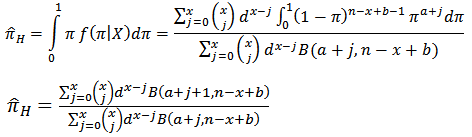
 The marginal probability density function is
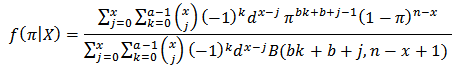
 given X is
 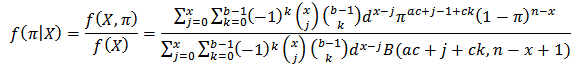 The posterior mean which is the Bayes estimator is found by using
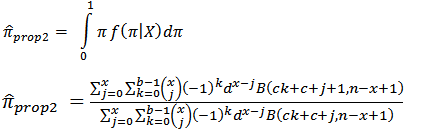
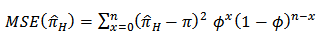
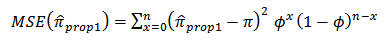
 is
is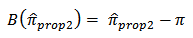
 is
is