-
Paper Information
- Next Paper
- Paper Submission
-
Journal Information
- About This Journal
- Editorial Board
- Current Issue
- Archive
- Author Guidelines
- Contact Us
American Journal of Computational and Applied Mathematics
p-ISSN: 2165-8935 e-ISSN: 2165-8943
2013; 3(6): 269-276
doi:10.5923/j.ajcam.20130306.01
Construction of Life Table and Some Mathematical Models for Male Population of Bangladesh
 Abstract
 Reference
 Full-Text PDF
 Full-text HTML
Md. Rafiqul Islam1, M. Korban Ali2, Md. Nurul Islam3
1Dept. of Population Science and Human Resource Development, University of Rajshahi, Bangladesh
2Bangladesh Islami University, Dhaka, Bangladesh
3Dept. of Statistics, University of Rajshahi, Bangladesh
Correspondence to: Md. Rafiqul Islam, Dept. of Population Science and Human Resource Development, University of Rajshahi, Bangladesh.
| Email: |  |
Copyright © 2012 Scientific & Academic Publishing. All Rights Reserved.
The purpose of the present study is to estimate male adult mortality by Widowhood Method using the secondary data for female marital status of Bangladesh. The male life table has been constructed from the number of persons surviving at an exact age x (lx) values obtained for linking male infant mortality as well as male adult mortality. Age specific death rates (ASDRs), crude death rate (CDR) and crude birth rate (CBR) for male has been estimated. Moreover, an effort has also been given concentration to fit some mathematical models to age structure, ASDRs and lx values for male population. Model validation technique, cross validity prediction power (CVPP), is applied to those mathematical models to test out either they are suitable or not. It is seen that the life expectancy at birth and CDR for male in 1961 are 43.43 and 21.80 respectively. And ASDRs show traditional U shape pattern. It is found that age distribution of population follows modified negative exponential model containing three parameters. And, ASDRs and the lx values follow 4th degree polynomial model. Moreover, it is investigated that the stability of R2of these models is more than 95%.
Keywords: Adult Mortality, Widowhood Method, Life Table, Modeling and Cross Validity Prediction Power (CVPP)
Cite this paper: Md. Rafiqul Islam, M. Korban Ali, Md. Nurul Islam, Construction of Life Table and Some Mathematical Models for Male Population of Bangladesh, American Journal of Computational and Applied Mathematics , Vol. 3 No. 6, 2013, pp. 269-276. doi: 10.5923/j.ajcam.20130306.01.
Article Outline
1. Introduction
- In any country, the success and overall improvement of a national plan and researches fully depend on the correct information about the population parameters based on national data. There are numerous agencies, organizations and researchers who have been providing the information about the population parameters of Bangladesh. But, very few of them give information on national based. Since in developing countries like Bangladesh, complete vital registration system has not been started yet. So, the majority of the data sources of information have been providing indirect techniques. Consequently, demands of indirect techniques have been increasing to estimate population parameters from very few limited and defected data. In last few decades, a number of indirect techniques have been developed. Widowhood Method is one of them. Hill has devised Widowhood Method to guesstimate adult mortality from widowhood information[1, 2]. Many researchers have used Widowhood Method to estimate the demographic parameters of Bangladesh[3, 4].In this study, an effort has been given attention to mull over the following objectives: i) to estimate male adult mortality of Bangladesh by Widowhood Method,ii) to construct an abridged life table for male from the calculated lx values, andiii) to fit some mathematical models for the estimated parameters of Bangladesh by means of census data.This paper is structured as follows. Sources of data of the study are presented in section 2. Section 3 describes the methods and methodological issues. Results and discussion of this paper are reported in section 4. Finally section 5 concludes the conclusion of the manuscript.
2. Sources of Data of This Study
- The age data for male and marital status data for female of 1961 census[5] have been used as raw data in the present study. For linking infant mortality, child mortality and adult mortality at the time of life table construction, l2 values have been taken from Statistical Year Book of Bangladesh[6].
3. Methods and Methodological Issues
3.1. Smoothing of Age Data for Male
- To evaluate the data, U.N. age sex accuracy index has been calculated. It is found to be 74.1 for both sexes. It is to be mentioned here that Whipple's index and Myer’s index have not been calculated because age structure for single age group is not found. This index indicates that male age distribution of 1961 census is highly inaccurate and for this reason this data need to be adjusted. That is why, age distribution of male of 1961 census population has been smoothed by latest smoothing method named 4253H, twice[7]. Smoothing method has been accomplished using the package Minitab Release 12.1. The observed and smoothed male population of Bangladesh have been presented in Table 1 and depicted in Fig. 1.
|

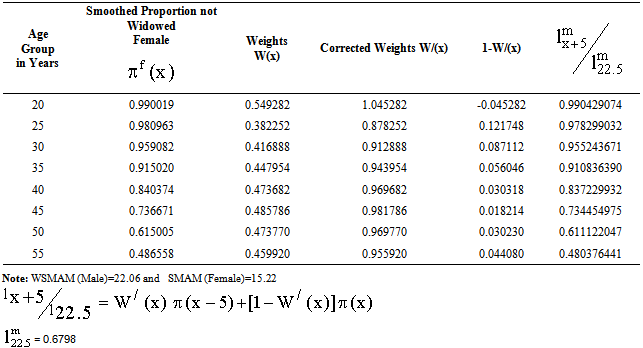
3.2. Construction of Life Table
- Widowhood method anticipated by Hill[2] has been used to estimate male adult mortality using 1961 census data on female marital status composition. For this, proportion not widowed πx has been transformed to the probability of surviving ratios using some weighting factors given by Brass[8] corresponding to singulate mean age at marriage (SMAM) for female and weighted singulate mean age at marriage (WSMAM) for male. Ultimately these probabilities of surviving ratios have been rehabilitated to lx values for male adult ages corresponding to the representative model life tables in the adult ages (Table 2).The lx values for male are estimated by linking l2 values with the male adult mortality. In this case a linear function Yx = a + b
 is to be fitted by trial and error method in accordance with Sivamurthy and Sitharam[9], where Yx is the logit of lx and
  is the logit survival function of
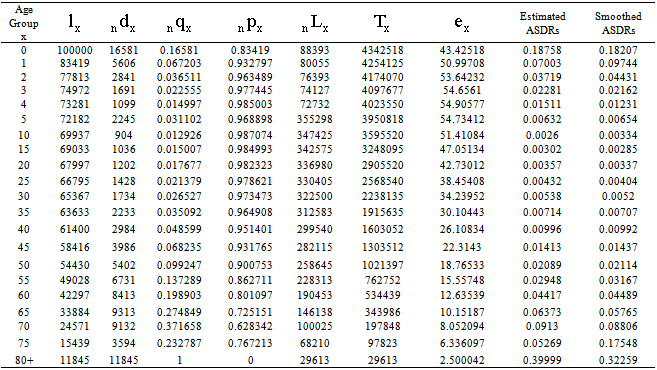
  of standard life table[10]. Then Yx values have been rehabilitated to lx values which are known as the number of persons surviving at an exact age x. The male life table has been constructed using the lx values and presented in Table 3.
3.3. Estimation of Some Mortality Measures
- In this section, some mortality measures are enumerated as follows:ASDRs have been estimated from the life table using the formula ASDR=
 [11] and presented in Table 3 and depicted in Fig. 2. Male crude death rate (CDR) has been estimated using these ASDRs and smoothed male population applying the formula CDR = ASDRxCx, where Cx is the age structure for male. It is found CDR for male is 21.80.
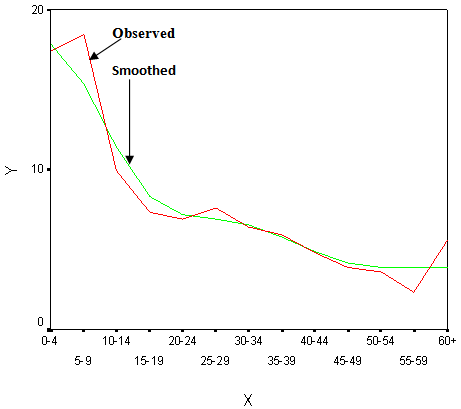 | Figure 1. Observed and Smoothed Percentage Distribution for Male Population by Age of Bangladesh. X: Age Group in Years and Y: Percent Population |
|
|
3.4. Model Fitting
- From the scattered plot of population by ages (Fig. 3), it is observed that the population is modified negative exponentially distributed with regard to ages. Therefore, a modified negative exponential model is considered. The model is
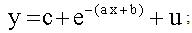 | (1) |
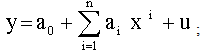 | (2) |
 is the constant;
  is the coefficient of
  (i =1, 2, 3, ..., n) and u is the disturbance term of the model. Here, a suitable n is found out for which the error sum of square is smallest amount.Again from the dotted plot of ASDRs for male by ages (Fig. 5), it also seems that ASDRs can be fitted by polynomial for different ages. In this case, an nth degree polynomial model is considered of the following form
 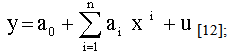 | (3) |
 is the constant;
  is the coefficient of
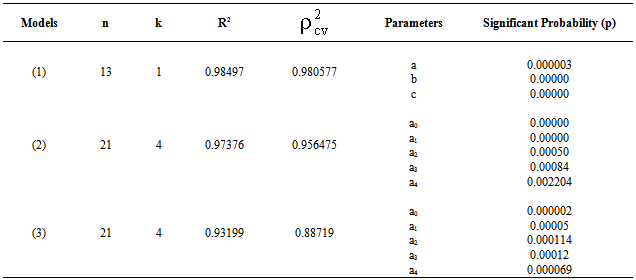
  (i =1, 2, 3, ..., n) and u is the error term of the model. At this juncture a suitable n is chosen such that the error sum of square is lowest amount.Using the software STATISTICA, all these mathematical models have been estimated. The information on model fittings has been presented in Table 4.Note that as usual models, i. e. Gompertz, Makeham and logistic models were also applied but seem to be worse fitted with respect to their shrinkages. Therefore, the findings of those models were not exposed in this study.
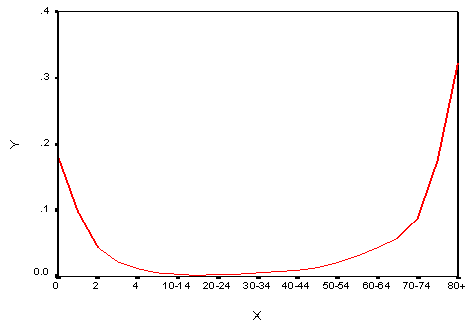 | Figure 2. The ASDRs for Male Population of Bangladesh. |
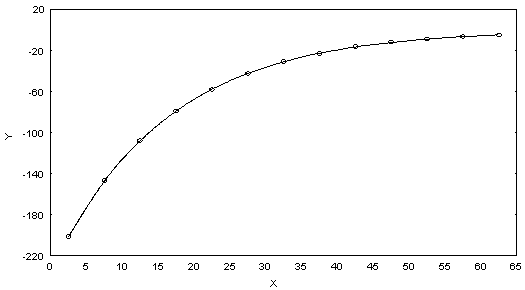
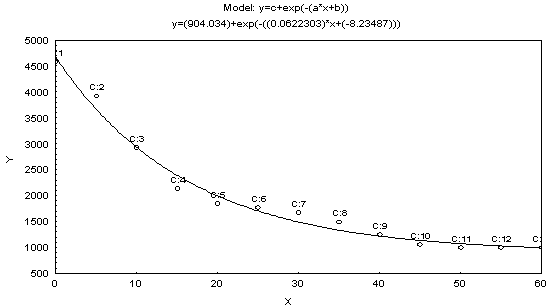 | Figure 3. Observed and Fitted Model for Male Age Distribution of Bangladesh. X: Age Group in Years and Y: Male Population |
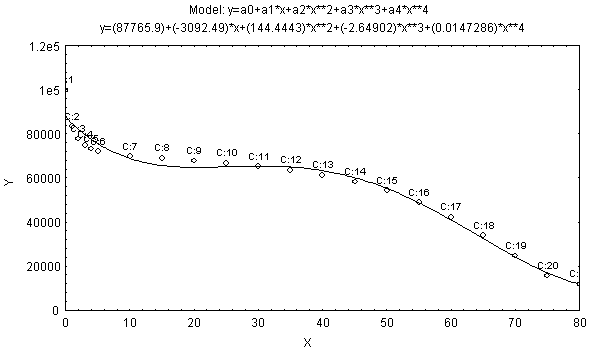 | Figure 4. Observed and Fitted Model of lx Values for Male of Bangladesh. X: Age Group in Years and Y: lx |
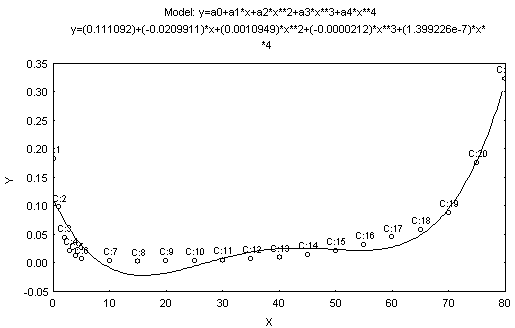 | Figure 5. Observed and Fitted Model for ASDRs for Male of Bangladesh. X: Age Group in Years and Y: ASDRs |
3.5. Model Validation Technique: Cross Validity Prediction Power (CVPP)
- To check how much those models are stable over the population, the CVPP,
 , is applied. Here
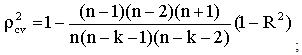 where, n is the sample size or number of cases, k is the number of predictors in the model and the cross validated R is the correlation between observed and predicted values of the dependent variable[13].
 3.6. Shrinkage of the Model
- The shrinkage of the model is Shrinkage =︱
 -R2︱; where
  is cross validity prediction power & R2 is the coefficient of determination of the model. Moreover, the stability of R2 of the model is equal to 1- shrinkage. The estimated CVPP,
  , corresponding to their R2 and shrinkage are shown in Table 4. Cross validity prediction power is also employed as validation technique[14-31].
3.7. Crude Birth Rate (CBR) for Male Population
- There are various types of measures in fertility. But, we estimate CBR only. Assuming intercensal growth rate between the intercensal period from 1951 to 1961 is equal to the growth rate ( r ) as in 1961. Now CBR has been estimated from the balancing equation CBR = CDR + r; assuming the net migration rate is zero. Intercensal growth rate has been estimated using the exponential growth rate formula. Note that the inter censual growth rate during 1951 to 1961 for male is 20.2 per thousand.
4. Results and Discussion
- Life table for male presented in Table 3 exhibits the life expectancy at birth for male in 1961 is 43.43. But it is observed that the life expectancy at birth for male in 1961 was 44.22 (BBS, 1980) which is close to our estimate. Therefore the life expectancy at birth for male in 1961 around 43 or 44 is quite reasonable.Again, the ASDRs for male of Bangladesh in 1961 presented in Table 3 and in Fig. 2 shows the traditional U shaped curve. It is seen that the curve is showing gradually decreasing in the continuous age interval[0, 20) but gradually increasing in the age interval[20, 80+].The CDR for male of Bangladesh in 1961 is to be found in the present study as 21.80 and the CBR for male of Bangladesh is 42.00 in 1961.The modified negative exponential model is assumed for male age structure of Bangladesh and the fitted equation is as follows:
 | (1) |
 =0.980577.The polynomial model is assumed for number of persons surviving at an exact age x (lx) for male of Bangladesh and the fitted equation is
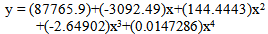 | (2) |
 is 0.956475.Again, another polynomial model is assumed for male ASDRs and the fitted equation is
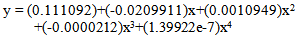 | (3) |
 =0.88719.From Table 4, it is shown that all the parameters of the fitted models are highly significant with significant proportion of variance explained. Moreover, Table 4 reveals that all the fitted models (1), (2) and (3) are highly cross-validated and their shrinkages are only 0.004393, 0.017285 and 0.0448, respectively. These imply that the fitted models (1), (2) and (3) will be stable more than 98%, 95% and 88%, respectively. Shrinkage coefficients show that the fit of these models are better well.From the above equation (1), the rate of change of y with respect to x, i. e. the velocity curve for age structure has been estimated and shown in Fig. 6. From this figure it is moreover seen that age structure curve is smoothly and strictly decreasing in accordance with ages in years.
|
 | Figure 6. The Velocity Curve for Male Population of Bangladesh. X: Age Group, Y: Velocity |
5. Conclusions
- In this paper, abridged life table for male has been constructed using the female marital status by widowhood method. It is seen that the life expectancy at birth and CDR for male in 1961 are 43.43 and 21.80 respectively. And ASDRs exhibit traditional U shape pattern. It is found that age distribution for male population of Bangladesh follows modified negative exponential model three parameters in which all parameters are highly significant with large proportion of variation. On the other hand, ASDRs for male follow 4th degree polynomial model containing five parameters in which all parameters are highly statistically significant. Moreover, the surviving function (lx) for male of Bangladesh follows bi-quadratic polynomial model in which all parameters are highly statistically significant. The stability of R2 of these models is more than 95%.