Neterindwa Ainea1, Estomih S. Massawe1, Oluwole Daniel Makinde2
1Mathematics Department, University of Dar es Salaam, P. O. Box 35062, Dar es Salaam, Tanzania
2Institute for Advance Research in Mathematical Modelling and Computations, Cape-Peninsula University of technology, P. O. Box 1906, Bellville 7535, South Africa
Correspondence to: Estomih S. Massawe, Mathematics Department, University of Dar es Salaam, P. O. Box 35062, Dar es Salaam, Tanzania.
| Email: |  |
Copyright © 2012 Scientific & Academic Publishing. All Rights Reserved.
Abstract
This paper examines the effect of Treatment and Infected Immigrants on the spread of Hepatitis C Virus (HCV) disease with Acute and Chronic stages. A nonlinear mathematical model for the problem is proposed and analysed qualitatively using the stability theory of the differential equations. The results show that the disease free equilibrium is locally stable at threshold parameter less than unity and unstable at threshold parameter greater than unity. Globally, the disease free equilibrium is not stable due existence of forward bifurcation at threshold parameter equal to unity. However the disease becomes more endemic due to the presence of infected immigrants in the community. It is also shown that in the presence of treatment, the rate of infected immigrants (acute and chronic) decreases and consequently the treated infected individuals decreases continuously. Numerical simulation of the model is implemented to investigate the sensitivity of certain key parameters on the treatment and infected immigrants on the spread of the disease with acute and chronic stages.
Keywords:
Treatment Of HCV, Infectious Disease, Infections By Immigrants, Spread Of Infectious Disease
Cite this paper: Neterindwa Ainea, Estomih S. Massawe, Oluwole Daniel Makinde, Modelling the Effect of Treatment and Infected Immigrants on the Spread of Hepatitis C Virus Disease with Acute and Chronic Stages, American Journal of Computational and Applied Mathematics , Vol. 2 No. 1, 2012, pp. 10-20. doi: 10.5923/j.ajcam.20120201.02.
1. Introduction
Hepatitis (plural hepatitides) is an inflammation of the liver characterized by the presence of inflammatory cells in the tissue of the organ[1]. The inflammation of liver causes soreness and swelling. Hepatitis is most commonly caused by one of the 5 hepatitis viruses; hepatitis A, hepatitis B, hepatitis C, hepatitis D and hepatitis E. Hepatitis C is usually spread through contact with blood products[2]. Blood products have been the main agents through which HCV is transmitted, but ever since 1992, when it became possible to detect the virus in blood, transmissions through transfusions, and organ transmissions have been minimal.Most common avenues through which HCV is spread are unprotected sex, sharing of contaminated needles among drug addicts and those with other STDs[3]. Some people also get this virus from tattoo and piercing salons. It is also possible to contract HCV at birth, as it can be transmitted from mother to baby.A HCV infection can be categorized into two stages, firstly an acute infection (following initial infection) and secondly a chronic infection. Acute means ‘new ‘or illness of a short period. A chronic hepatitis C infection is when the infection lasts for longer than six months.The goal of treatment is to reduce the amount of the HCV in the blood to levels that can't be detected after 24 weeks of therapy. HCV is treated with drugs that slow or stop the virus from damaging the liver. The treatment of HCV has advanced in recent years which have greatly improved the outlook for people with HCV. The usual treatment of HCV is a combination of two different medicines called pegylated interferon and ribavirin[2].[4] made an analysis on the immigration status, race and language barriers on chronic hepatitis virus infection management and treatment outcomes. The researchers found that HCV endemic regions of the word are diagnosed with HCV infection after immigration and subsequently referred to viral hepatitis chronics for disease management. They suggested that optimal care to all patients, indentifying and understanding barriers to care related to immigrant status, race and language in HCV management must be provided.[5] found that chronic HCV is a progressive condition that accounts for at least one quarter of all cases of chronic liver disease[6] predicted that the prevalence of chronic HCV (CH-C) remains high and the complications of infection are common[7] discovered that chronic HCV complications are increasing, especially among people older than 60 years[8] conducted a study on disease progression of Acute HCV[9] analyzed the screening of HCV in a Health maintenance Organization[10], investigated the effects of a HCV educational intervention or a motivational intervention on alcohol use and sexual risk behaviours among injection drug users[11] investigated the dynamic behaviour of an SEI (Susceptible- Exposed- Infective) model with acute and chronic stages. However the integration of treatment and infective immigrants to the population was not incorporated. In this paper, it is intended to study and analyze a model which incorporates the impact of treatment and infective immigrants on the spread of HCV transmission dynamics. Thus we study and analyse a deterministic model of the effect of treatment and infected immigrants on the spread of HCV disease with acute and chronic stages.
2. Model Formulation
A non linear mathematical model is proposed and analyzed to study the effect of treatment and infected immigrants on the spread of HCV disease with acute and chronic stages.In modelling the dynamics, the population is divided into five groups: Susceptible individuals  ; Exposed individuals
  ’ who are not yet infectious; Acute infected class
  who are individuals initially infected; Chronic infected class
  , who are infectious individuals; Treated group
  but not yet cured.The interaction between the classes will be assumed as follows: Exposed
  acute infected
  and chronic infected
  immigrants enter into the population with the rates
  respectively. Susceptible individuals
  are shifted to exposed class
  by the rate
  Also susceptible individuals
  may become acute infectious
  and chronic infectious
  shifted to Treatment class
  at the rates
  respectively. The number of new infectious individuals produced is therefore
 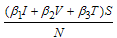 where
where  are the effective contact rate of individuals with acute hepatitis C chronic hepatitis C, and the individual still undergoing Treatment but not yet cured respectively.In formulating the model, the following assumptions are taken into consideration:i. Both treatment
  and chronic infectious individuals
  recover with the constant rates
  and
and  respectively,The recovered individuals go back to susceptible
  group,ii. The rate of transmission is directly proportional to the susceptible population and also to the ratio between the infected population and the total population. Total population at time
 is given by
 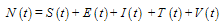 | (1) |
iii. Following the interactions of susceptible, exposed class, acute individuals, chronic infective and treated group in everyday activities, susceptible acquire HCV infection with the force of infection  ,iv. The population is homogeneously mixed and each susceptible individual has equal chance of acquiring HCV infection when he/she comes into contact with infectious individual,v. The population under study comprise of persons with at least fifteen (15) years old. In this case, it is assumed that there is no vertical transmission and all recruitments are immigrants. vi. All parameters in population are positive and all compartments suffer natural mortality at a rate
  .vii. Taking into account the above considerations, we then have the following schematic flow diagram (Figure1):
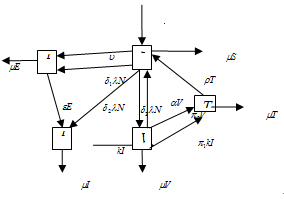 | Figure 1. Model flowchart. |
From the above flow chart, and with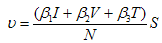 the model will be governed by the following system of equations:
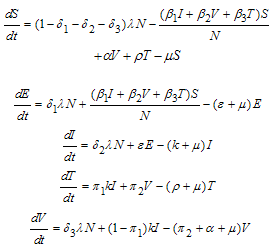 | (2) |
with nonnegative initial conditions and  where
where are the effective contact rates of individuals with acute hepatitis C, chronic hepatitis C, and the individual still undergoing treatment but not yet cured,
 are the rates at which exposed
  , acute infected
  and chronic infected
  immigrants enter into the population respectively,λ is the recruitment rate,μ is the death rate,
 is the rate of progression from acute infected class to both treatment and chronic infected class,ε is the rate of progression from the exposed to acute infected class,
 are the rates of progression from acute infected and chronic infected groups to treatment respectively,ρ,α are the rates of progression for treatment from acute infected and chronic infected group respectivelySince the model is homogeneous of degree one, the variables can be normalized by setting
 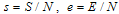 ,
, . This leads to the normalized system
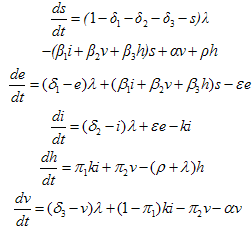 | (3) |
3. Model Analysis
The nonlinear system in Equation (1) will be qualitatively analyzed so as to find the conditions for existence and stability a disease free equilibrium points[12]. Analysis of the model allows us to determine the effect of treatment with infected immigrants on the spread of HCV disease with acute and chronic stages. Also on finding the reproductive number , one can determine if the disease become endemic in a population or not.
3.1. Disease Free Equilibrium (DFE)
The disease free equilibrium of the normalised model system of equations (3) is obtained by setting 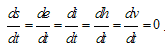 At disease free equilibrium we have
  Thus the system (3) becomes
 Therefore the disease free equilibrium (DFE) denoted by
 of the normalised model system (3) is given by
  .
.
3.2. Local Stability of Disease Free Equilibrium
The disease free equilibrium of the normalised model system (3) was given by  The local stability of is established by using the next generation operator method on the normalised model system (3). The basic reproduction number
  is defined as the effective number of secondary infections caused by typical infected individual during his/her entire period of infectiousness[13]. This definition is given for the models that represent spread of infection in a population. It is obtained by taking the largest (dominant) Eigen value, (spectral radius) of
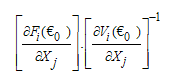 | (4) |
where  is the rate of appearance of new infection in compartment
 is the transfer of individuals out of the compartment
  by all other means,
 is the disease free equilibrium.Therefore
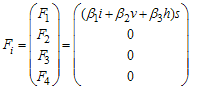 | (5) |
By linearization approach, the associated matrix at disease free equilibrium is obtained as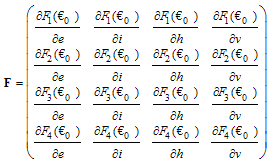 | (6) |
This gives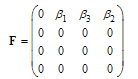 | (7) |
The transfer of individuals from the compartment  is given by
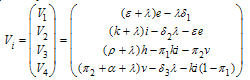 | (8) |
Again, by linearization approach, the associated matrix at disease free equilibrium is given byThis gives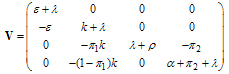 | (9) |
With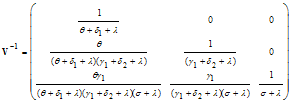 | (10) |
Therefore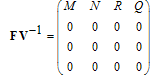 | (11) |
Where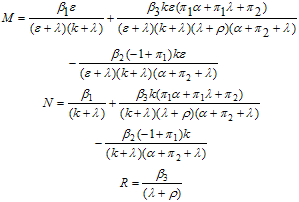 and
and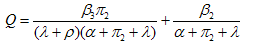 The Eigen values of
  are
are  where
where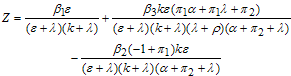 It follows that the basic reproduction number for the normalised model system (3) with infective immigrant and treatment denoted by
  is given by
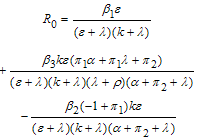 | (12) |
The disease free equilibrium of the treatment model system (3) with infective immigrants is locally asymptotically stable if  and unstable if
  . In order to assess the contribution of
  and
and  in terms of
  and
and  respectively from equation (12) above, we let
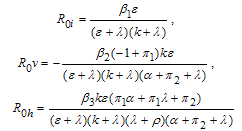 | (13) |
Then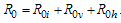 Lemma 1The disease free equilibrium of the treatment model system (3) with infective immigrants is locally asymptotically stable if
  and unstable If
  .Remark:From the equations (14) above, it is clear that
  which implies that acute infective
  have a significant contribution on the transmission of the HCV infection followed by individuals who are still undergoing treatment but not yet cured
  which keep the disease endemic (i.e.
  ) in the population through
  and
and  respectively compared to chronic infective
  under
under  .In the absence of infection, the population size approaches the steady state for a normalized model system (3). The results by[11] on
  are recovered only when
  and
and  from equation (12) above.
3.3. Endemic Equilibrium and Local Stability
To obtain an endemic equilibrium  , we set each equation in the model (3) equal to zero. Solving the system while expressing each equilibrium point in terms of
  at steady state, we get
  as an endemic equilibrium point. Thus
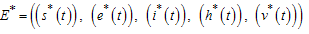 is an endemic equilibrium where
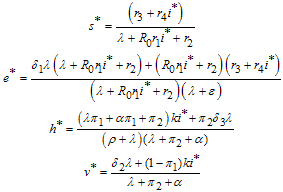 and
and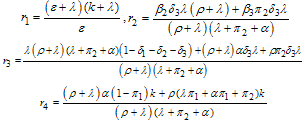 We note that
  are always positive and this will happen if and only if
  .
.
3.4. Global Stability of DFE
Theorem 1:If  , the endemic equilibrium
  of the model (3) is globally asymptotically stable.Proof:To establish the global stability of the endemic equilibrium
 , we construct the following Lyapunov function:
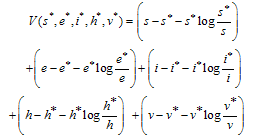 By directly calculating the derivation of
  along the solution of (3) we get
 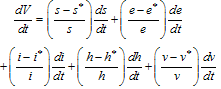 | (14) |
which gives Where
Where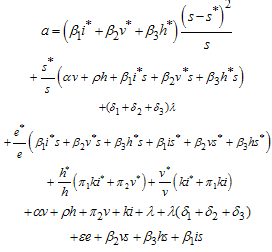 And
And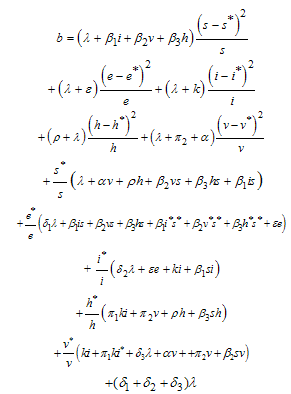 Thus from (14), if
  then
then  will be negative definite, implying that
  . Also
  if and only if
  Therefore, the largest compact invariant set in
  is the singleton
 , where
  is endemic equilibrium of the normalised system (3). By LaSalle’s invariant principle, it then implies that
  is globally asymptotically stable in
3.5. Determination of Forward or Backward Bifurcation
The existence and stability of endemic equilibrium is determined through the investigation of the possibility of existence of the backward or forward bifurcation due to existence of endemic equilibrium using the the centre manifold theory [14]. As a disease invades the population, it reduces the number of susceptible individuals in the population, which tends to reduce its reproductive rates. Figure (2) shows forward bifurcation for the chosen numerical data: 
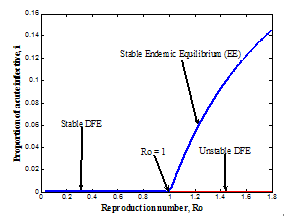 | Figure 2. The forward or transcritical bifurcation |
A Forward or Transcritical bifurcation at the stationary solutions occurs at  . If
. If no biologically meaningful endemic stationary solution exists, and the disease free stationary solution is a global attractor. But if
 the endemic solution exists and it is a global attractor, while the disease free solution is a saddle point. This is referred to as a forward bifurcation because in the neighbourhood of the bifurcation point, the endemic disease prevalence is an increasing function of
  .
.
3.6. Model with Infected Immigrants and Treatment When Treated HCV Infectives Do Not Transmit the Infection
 In this case, we consider the situation where the treated HCV infectives take the preventive measures and change their behaviour so as not to transmit the infection in the community
 . Thus the infection is transmitted by acute and chronic infectives individuals only. The basic reproduction number in this case is given by
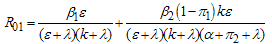 and we note that
  . We also note that
  as
as  . Therefore we can conclude that the endemicity of the infection is reduced when the treated HCV infectives show a positive attitude towards preventive measures and accelerate the transmission of the disease.
3.7. Model in the Absence of Treatment
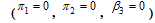 Here we consider the situation where there is no treatment of the acute infectives
  and chronic infectives
 . In this case the normalised model system (3) is reduced to the group of proportion of susceptibles, exposed individuals, acute infectives, and chronic infective individuals in the community. As there is no treatment, meaning that
  and
and  it implies that
  . We therefore obtain the basic reproduction number as
 We note that
  and
and  as
as  Therefore it can be concluded that in the absence of treatment, the endemicity of the infection increases.Considering the two epidemiological cases discussed above, it may be concluded that if both infected immigrants and treated HCV infectives take the preventive measures and do not spread the infection, then the disease tends to the endemic state if the rate of both infected immigrants and treated HCV infectives is small. If the annual infected immigrants and treatment rates are very high (say 100% of the initial population), the disease may tend to disease free equilibrium point. However if the infected immigrants (acute and chronic) and treated HCV infectives contribute to the transmission of the disease, then even if treatment rates are very high, the disease settles in the population as the system approaches asymptotically stable endemic equilibrium point. Analysis also shows that the endemicity of the disease is reduced by treatment of HCV infectives in the community.
4. Numerical Simulations
In order to verify the theoretical predictions of the model, the numerical simulations of the model (3) are carried out using the following set of estimated parameter values: Figures 4.1-4.4 below show the proportion of exposed population and HCV infective populations (acute, treated and chronic infectives) plotted against the proportion of susceptible population. The figures show the dynamic behaviour of the endemic equilibrium of the normalized model (3) using the estimated parameter values above for different starting values in four cases as shown below:
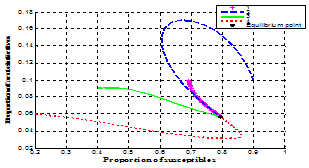
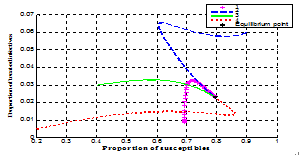
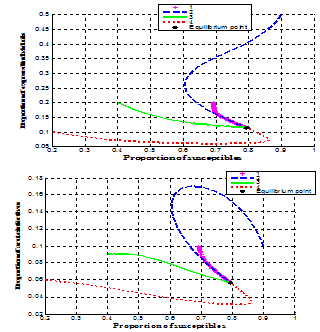 | Figure 4.1. Variation of proportion of exposed individuals against proportion of susceptible population |
 | Figure 4.2. Variation of proportion of acute infective population against susceptible population |
 | Figure 4.3. Variation of proportion of treated infective population against susceptible population |
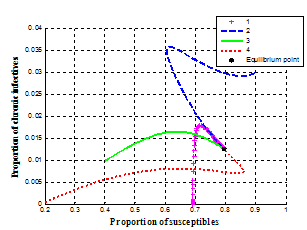 | Figure 4.4. Variation of proportion of chronic infective population against susceptible population |
In figures 4.1-4.4, the endemic equilibrium  was obtained as
 ,
,  It is can be observed from these figures that for any initial starting point, the solution curves tend to the endemic equilibrium point
  . Hence, we infer that the system (3) is globally stable about the endemic equilibrium point
  for the set of parameters chosen.In figure 4.5 below, the distribution of the proportion of population with time is shown in different classes without infective immigrant and treatment
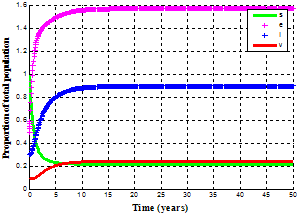 | Figure 4.5. Variation of proportion of the population without infected immigrants and treatment |
It is observed that in the absence of HCV infected immigrants and treatment class in the community, the susceptible population decreases continuously which results in an increase in infective population (acute, chronic and treated infectives) and then it decreases as some of the infected population recovery naturally due to strong immune systems. Other infected individuals will die out by disease induced deaths due to absence of HCV treatment.Figure. 4.6 below shows the distribution of proportion of population with time in all classes with the rates of infective immigrants  and the rate of treatment
 .
.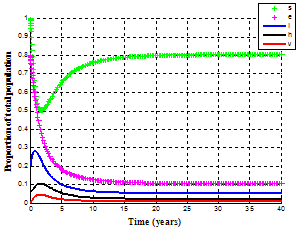 | Figure 4.6. Variation of proportion of the population with infected immigrants and treatment |
It is observed that, initially the proportion of susceptible population decreases with time due to immigration of infected immigrants and then increases with time due to recovery rates of individuals  and eventually it reaches equilibrium position. Also the susceptible class decreases with time since individuals moved to the acute infectives at the rate
  . The acute infected population decreases with time since infected individuals moved to both treatment and chronic infected class. As the rate of treatment increases, the infective individuals decreases with time leading to the increase of susceptible individuals and reaches the equilibrium position.Figure 4.7 below shows the variation of the proportion of susceptible individuals with different rates of infected immigrants
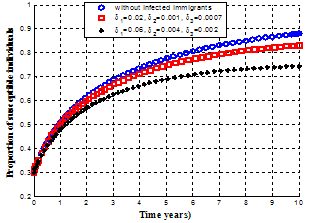 | Figure 4.7. Variation of proportion of susceptible population for different values of  |
It is observed that as the infected immigrants increase, susceptible individuals decreases with time resulting in the increase of the number of infective individuals in the community.Figs 4.8-4.11 below show the variation of proportion of exposed individuals, acute, chronic and treated infected populations respectively.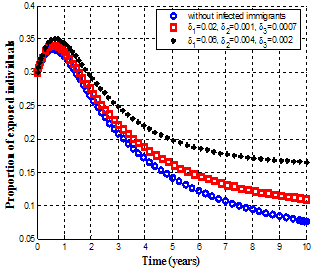 | Figure 4.8. Variation of proportion of exposed individuals for different values of  |
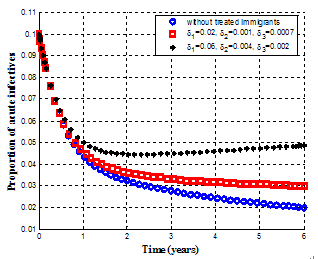 | Figure 4.9. Variation of proportion of acute infective population for different values of |
 | Figure 4.10. Variation of proportion of chronic infectives for different values of |
 | Figure 4.11. Variation of proportion of treated infected population for different values of  |
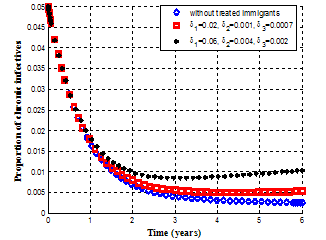
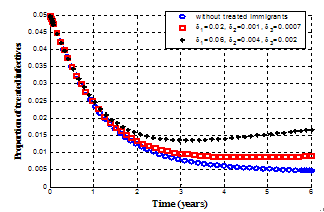
It is observed from figure 4.8 that as the infected immigrants increase, the exposed individuals increase with time. Figure 4.9 shows that the exposed individuals shift to acute class at the rate  which results in the increase of the number of acute infective individuals. Then, the acute infected individuals shifts to both treatment and chronic infected class at the rate
  , leading to the increase of the number of chronic infective individuals as seen in figure 4.10 and treated infective individuals as seen in figure 4.11.Figures 4.12 and 4.13 show the variation of proportion of acute and chronic infectives for different values of
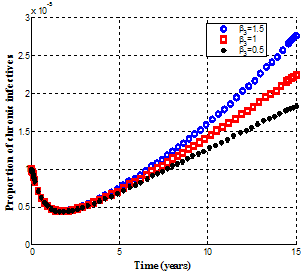
 | Figure 4.12. Variation of proportion of acute infective population for different values of  |
 | Figure 4.13. Variation of proportion of chronic infective population for different values of  |
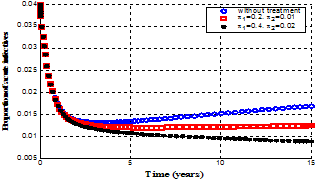
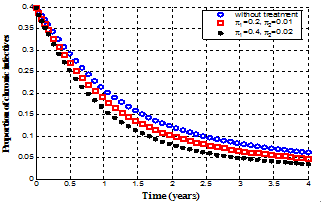
It is observed that the acute infective individuals decrease with time due to the increase of the rate of progression to treatment from acute infected individuals  as seen in figure 4.12. Also as the rate of progression to treatment from chronic infectives
  increase, the chronic infected individuals decrease as seen in figure 4.13.
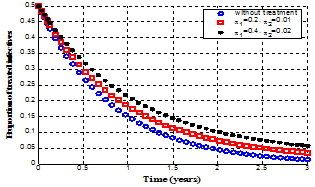 | Figure 4.14. Variation of proportion of treated infectives for different values of  |
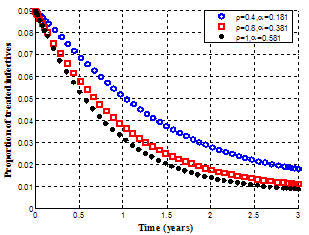
In figure 4.14, it is seen that the treated individuals increases with time due to the increase of the rate of progression to treatment from acute and chronic infectives  and
and  respectively.
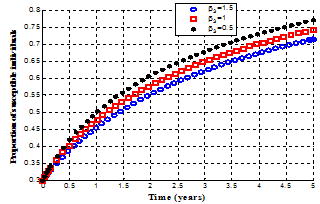 | Figure 4.15. Variation of proportion of susceptible population for different values of |
 | Figure 4.16. Variation of proportion of exposed individuals for different values of |
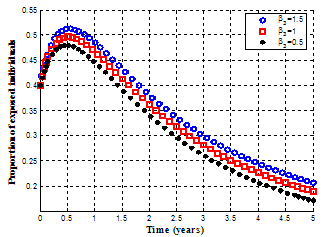
It is observed from figures. 4.15 and 4.16 that when the effective contact rate of individuals still undergoing treatment  become very small, the susceptible population increase with time.(see figure 4.15) and if the susceptible population increase, the number of exposed individuals decrease (see figure 4.16).
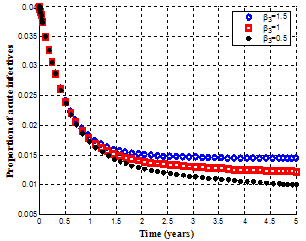 | Figure 4.17. Variation of proportion of acute infective population for different values of |
 | Figure 4.18. Variation of proportion of chronic infected population for different values of  |
It is observed from figures. 4.17 and 4.18, that when the effective contact rate of individuals still undergoing treatment  become very small, the susceptible population increase and therefore the number of exposed individuals decrease, leading to the decrease of the acute and chronic infected individuals. As the rate of progression to acute infected class from exposed class decrease, the exposed individuals who shifted to acute infected class decreases resulting to the decrease of the number of acute and chronic infective individuals in the community.Figures 4.19 and 4.20, show the variation of proportion of chronic infectives and treated population for different recovery rates.
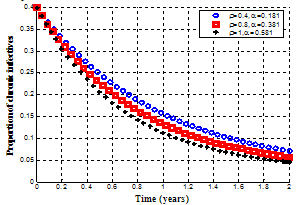 | Figure 4.19. Variation of proportion of chronic infective population for different values of  and and |
 | Figure 4.20. Variation of proportion of treated infective population for different values of  and and |
It is observed that as the recovery rates  increase, the chronic infectives decrease with time as seen in figure 4.19 leading to the decrease of treated group as seen in figure 4.20. This is an indication that, as the recovery rate increases, the rate of progression to treatment from acute infected and chronic infected groups
  and
and  respectively decrease, resulting to the decrease of infected individuals (acute, chronic and treated ) in the community.
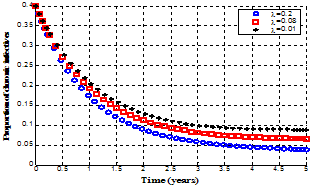 | Figure 4.21. Variation of proportion of chronic infective population for different values of  |
Figure 4.21 shows the variation of chronic infectives for different values of recruitment rate ( ) of the population. It is clear from the figure that as the recruitment rate increases, the chronic infected population decrease. This might be due to the effect of treatment in the community which leads to the decline of infected individuals (acute, chronic and treated infectives) in the community.
5. Discussions and Conclusions
In this paper, a mathematical model of HCV showing the effects of treatment and infected immigrants on the spread of HCV disease with acute and chronic stages has been established. Both qualitative and numerical analysis of the model was done. The model incorporates the assumption that infected immigrants enter the homogenous population. It was shown that there exists a feasible region where the model is well posed in which a unique disease free equilibrium point exists.The disease free and endemic equilibrium points were obtained and their stabilities investigated. A numerical study of the model has been conducted to see the effect of certain key parameters on the spread of the disease. It was observed that the disease become more endemic due to the presence of infected immigrants in the community. As the infected immigrants increase, the acute and chronic infective individuals also increase in the population. It was also shown that in the presence of treatment, the rate of infected individuals (acute and chronic) decrease and consequently the treated infected individuals decrease continuously. It was therefore shown that the disease can be eliminated at some point due to treatment and natural immunity of chronic infected individuals in the community.Finally from the analysis, it may be hypothesized that preventive measures, through reducing rates of transmission of HCV are therefore necessary to the community. Reduced transmission leads to lower prevalence of the disease in the long-term. The national health cares to HCV should therefore seek to ensure that all people at risk or that have been at risk in the past, have access to and are supported in the use of HCV education and prevention services, regardless of their social and economic status.
References
| [1] | J. Wales, L. Sanger, 2001. Acute hep C virus infection: Transmission, Diagnosis, Prevention and Treatment. Wikimedia Foundation, Inc |
| [2] | L. A. Moyer, E. E. Mast, M. J. Alter, 1999, Hepatitis C: Prevention counseling and medical evaluation. American Academy of Family Physicians |
| [3] | J. Wong, 2000,. “Silent killer”. American Journal of Public Health", Vol 90 |
| [4] | C. Giordano, E. F. Drugts, G. Garber, C. Cooper, Evaluation of immigration status, race and language barriers on chronic hepatitis C virus infection management and treatment outcomes, Wolters Kluwer Health: Lippincott Williams and Wilkins, 2008 |
| [5] | A. Mehta, R. Pawson, S. Rajan, G. Hazlehurst, G. Dusheiko, R. Miller, P. Hewitt (1999) “Hepatitis C lookback programme: a single hospital experience”, Transfusion Medicine , 9 (3) 189 - 193 |
| [6] | G. L. Davis, K. Yalamanchili, S. Saadeh, R. Lepe, 2009, The prevalence of hepatitis C virus infection in Taxes: Implications for future health care. Baylcr University Medical centre |
| [7] | L. Highleyman, 2010, “Chronic Hepatitis C Complications are Increasing, Especially among People Older than 60 Years”. Gastroenterology |
| [8] | C. D. Mazoff (2008), Disease Progression: Acute Hepatitis C. Alan Franciscus |
| [9] | L. R. Fischer, D. H. Tope, S. Kathleen, R. N. Conboy, B. D. Hedblom, E. Ronberg, D. K. Shewmake, J. C. Butter, 2000. Screening for hepatitis C virus in a health maintenance organisatio, American Medical Association |
| [10] | W. A. Zule, E. C. Costenbader, C. M. Coomes, W. M. Wechsberg, 2009. Effects of a hepatitis C virus educational intervention or a motivational intervention on alcohol use, injection drug use, and sexual risk behaviours among injection drug users. National centre for Biotechnology Information, U. S. National Library of Medicine, Bethesda MD, USA |
| [11] | L. Cai, X. Li, A note on global stability of an SEI epidemic model with acute and chronic stages. Beijing Institute of Information Control, PR China, 2007 |
| [12] | G. M. Gomes, L. J. White, G. F. Medley, 2004, Infection, reinfection, and vaccination under suboptimal immune protection: epidemiological perspectives, J. Theor. Biol. 228, p. 539-549 |
| [13] | O. Diekmann, J. A. P. Heesterbeek and J. A. P. Metz, 1990, On the definition and computation of the basic reproduction ratio in the model of infectious disease in heterogeneous populations. Journal. Math. Biol. 2(1), 265-382 |
| [14] | A. Gumel, C. Castillo-Chavez, R. E. Mickens and D. P. Clemence, 2009, Simulation of the pertusis epidemiology in the united states: Effects of Adult booster doses, maths equations and application of Biology and industry, www.publc.asu.edu/…/pubs.htm retrieved on 9 April, 2011 |
 Abstract
 Reference
 Full-Text PDF
 Full-text HTML