Abiona T. O. , Adebowale S. A. , Fagbamigbe A. F.
Department of Epidemiology, Medical Statistics and Environmental Health, Faculty of Public Health, College of Medicine, University of Ibadan, Ibadan, Nigeria
Correspondence to: Fagbamigbe A. F. , Department of Epidemiology, Medical Statistics and Environmental Health, Faculty of Public Health, College of Medicine, University of Ibadan, Ibadan, Nigeria.
| Email: |  |
Copyright © 2012 Scientific & Academic Publishing. All Rights Reserved.
Abstract
Mortality resulting from accidents and late admission of patients into modern health facility constitute a high proportion of all deaths in the developing countries. Information on patterns of admission of Accident and Emergency (AE) patients is valuable to caregivers in AE department in meeting patients’ seasonal needs. This retrospective study used gender-classified records of 79990 patients admitted into the AE unit between 1995 and 2006 in University College Hospital (UCH), Ibadan. We examined seasonal variation using trigonometric regression and moving average models. There exists significant difference in number of admission between males  and females
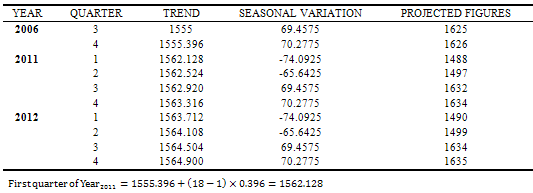
 .The analysis further showed that patient’s admission peaked in May and minimal in November. Seasonal index showed that the peak of number of patients admitted was observed in the last quarter of every year. This is an indication that admission occurs mostly during the festive periods where people travel home to celebrate with their love ones. The projected quarterly admissions for 2011 are (Q1=1488, Q2=1497, Q3=1632, Q4=1634) and for 2012 are (Q1=1490, Q2=1499, Q3=1634, Q4=1635). The hospital management should engage more caregivers and make available more resuscitating medical equipments during last quarter of each year and peak periods.
Keywords:
Time-series, Seasonal Variation, Admission, Projection, Trigonometrical Model
Cite this paper:
Abiona T. O. , Adebowale S. A. , Fagbamigbe A. F. , "Time Series Analysis of Admission in the Accident and Emergency Unit of University College Hospital, Ibadan, Southwestern Nigeria", American Journal of Computational and Applied Mathematics , Vol. 2 No. 1, 2012, pp. 1-9. doi: 10.5923/j.ajcam.20120201.01.
1. Introduction
The fundamental aim of most of the themes in Millennium Development Goals was to improve survival chances through improved health and quality of life for both children and adult. The Accident and Emergency Department (AED) in any modern health facility provides initial treatment to patients with a broad spectrum of illnesses and injuries which in most cases are severe and life-threatening. Emergency department was developed during the 20th century in response to an increased need for rapid assessment and management of such critical illness. The AED provides an insight to the quality of care available in the institution. In AED in UCH, the expectation of patients and their relatives are the same as elsewhere, but differ in the manner and extent to which this is met in terms of availability of ‘facilities and care givers’ relative to the number of patients on admission at a particular time. In Nigeria, it has been observed that some patients admitted to AED after trying to have their problem solved Elsewhere - churches, prayer home, traditional healers, drug dealers and self acclaimed pseudo-orthodox medical practitioners. The reasons for this delay in bringing patients to modern health care in Nigeria are multi-dimensional. Some patients would rather go for local medicine instead of coming on time to hospitals because they can’t afford the payments. However like most public facilities in Nigeria, the AED of most hospitals have their own share in terms of patients neglect due to poor and inadequate health facilities. Patients at times die as a result of inadequate valuable equipments that could be used to resuscitate patients who are in terrible conditions. Also poor electricity supply is another serious problem. In the face of these challenges, the AED in most Nigerian hospitals is striving to meet the health needs of the populace in terms of treatment and care. However, the patients’ family members who are desperate of immediate attention and care for their love ones shift blames on the care givers, believing that they have lackadaisical stance to their problem.Across all countries, the common cases of emergency admissions include; traumas–bodily injuries from Road Traffic Accident (RTA), fall, assaults, fire arms, cases of domestic accidents, violence and occupational hazards. Others are burns, ingestion of chemicals, acute renal failure, and cardiovascular problems such as heart attack and asthmatic conditions. Obstetrics emergencies, Paediatric (surgical) and Psychiatry emergencies are also reported. All these were assessed together as a variable and as the cases of emergency in this study with the view of observing its seasonal patterns, trends and projection.Seasonal Variation of emergency admissions in the AED of a hospital will provide information that would assist in decision making by hospital management, health boards and others regarding the future funding and development of AED services. It would provide doctors, nurses and other staff in AED with a valuable tool in structuring their service to meet the needs of patients. This will also help to prepare the medical team toward the peak period of influx of patients. Specific environmental factors underlying seasonal variability in the AED will be more understood for adequate planning strategies for improvement.This study aims to explore the seasonal variation of total patients in the Accident and Emergency unit of the University College Hospital within 12-year period of study (1995- 2006). It will also describe the seasonal variation separately for the segments 1995-1997, 1998-2000, 2001-2003 and 2004-2006 in attempt to examine whether there have been shifts in the time of maxima over the years.Emergency medical admissions have risen by 50% since 1984 and now account for almost half of all NHS admissions in England[1]. Over recent years there has been increasing concern that the number of hospital emergency admission is rising, and that this is placing an increasing financial burden on the NHS[2]Often, adult cases are commonly reported in the in Accident and Emergency unit. Age and deprivation take their toll. People aged over 65 accounts for only 15% of the Scottish population but 37% of emergency admissions[1]. This proportion may have grown because more elderly people live alone as family groups fragment, eroding informal support. Hospitals become "the career of last resort." Socioeconomic deprivation operates across the board, from illness behavior through to use of tertiary services. Deprivation increases emergency admissions, particularly for cardiovascular disease, self poisoning, and asthma. These, along with non- specific conditions, dominate the emergency admission workload[3].Worldwide, road traffic injuries are on the increase with most of morbidity and mortality occurring in Africa, Asia, the Caribbean and Latin America and the majority of deaths occur among pedestrians, cyclists, users of motorized two-wheelers and occupants of buses and mini buses[4]. Also[5] reported that in Nigeria one out of every three accident victim dies and since civil war, no other pathology or phenomenon has claimed the lives of more Nigerians than RTA. Injuries from RTA are most significant problem so much so that motor vehicle-related mortality has been described as disease of development[6]. Trading is a central part of Nigerian culture and traders travel large distances to markets, particularly to the inter-kingdom markets[7]. Bearing in mind the poor state of our highways, the deplorable condition of the automobiles on these highways and attitude of the drivers to highways-safety issues, the incidence of Road traffic accident in our environment will be expectably high.Moreover, in Nigeria, the prevailing economic circumstances have led to an upsurge in the use of motorcycles for private and commercial purpose[8]. Studies have reported that motorcycles users involved in collisions tend to sustain multiple injuries to various parts of the body. However, lower limbs are often injured[9]. Similarly[10] in a community based of commercial motor cyclist in Igbo-Ora, Oyo State reported that about 70% of the crash-involved motor cyclists and 50% of their passengers sustained injuries from the accident injury mainly affected the lower limb, upper limb and the head or face. Higher incidence of burns have been reported in urban areas than in rural areas, and most of the affected burn injury may occur in the scenario of Road Traffic Accidents, blasts and industrial mishaps at work place. Seasonal variation of burns in Ibadan, Nigeria[11] showed that most patients affected are above 15 years, with most burn occurring in December/January and least incidence is between April and July. The home was the site of injury in most cases (60%), accidents in the street e.g. pedestrian road traffic accidents (30%) and work related burn injury (4%). Similar study by [12] shows that in Malaga, Spain, most cases of burn injury occur in urban environment (89.5%). Most of these accidents occurred at home (65.8%) especially in the kitchen involving hot liquids.Further studies conducted in Europe suggested that greater number of children is injured during the summer months. Injuries presenting to the Accident and Emergency have shown that paediatrics emergency injuries has its peak during August when Scottish schools were on summer holiday. This is consistent with the findings of other studies. In Toronto, the highest numbers of presentation were recorded in August and September. The phenomenon could be explained by longer playing periods spent in playing unsupervised during holidays, rather than structured supervised activities in school. This seasonal variation suggests that specific injury control initiation should be implemented during school holidays[13].
2. Materials and Methods
2.1. Accident and Emergency Unit, UCH Ibadan
Established in 1984, the AE unit of UCH was established to take care of emergency cases with a broad spectrum of illnesses and injuries. The initial care of the medical team in the unit is aimed at saving life while on-going care focuses on prevention of complication. It is made up of several sections such as Endoscopy, Burns, Traumatology, Orthopaedics, Haematology, Operating theatre, Radiology and Pharmacy. The medical team comprises of Surgeons, Consultants, Doctors, Nurses and Pharmacists that run different shifts.Individuals with serious illnesses are then seen by a physician more rapidly than those with less severe symptoms or injuries. Patients are not delayed but are given immediate and adequate transfer to the respective places where they will be given further attention may be resuscitation room, wards for admission or to the theatre for operation.
2.2. Data collection and Analysis
The data were obtained from the central medical records in UCH. The data gave the monthly statistics of male and female patients attended to for the period of January 1995 to December 2006. The total number of patients recorded during the 12-years period of study was 79990. A time series data was plotted for the preliminary examination of the linear trend. Auto correlations were calculated and used to examine the existence of serial correlation in the series. The correlogram was also plotted as a preliminary means of investigating whether the series contained a seasonal variation of the sinusoidal type. An appropriate regression technique was then employed to fit a trigonometric curve to the data in order to measure the seasonal variation. We consider a model of the form  | (1) |
Where:μ = mean number of casualties per month between January 1995 to December 2006Yt = Number of casualties occurring in the t-th ordinal month starting from January 1995ω = frequency of the periodic variation = 2πf (since f = 1/T and T = 12 months)t = Time period (in month), a = Amplitude of the data, θ = phase which locates the peakεt = Error or residual term, (ωt + θ) is measured in radians.Re-parameterization transforms this model into a linear multiple regression of the form  | (2) |
Where;The time of the highest variation was obtained by solving the equation  which means
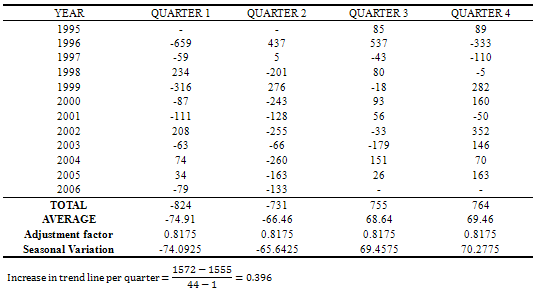
 Also,The extent of the seasonal variation above the mean level was measured by a/u while the highest variation was obtained by solving the equation cos(ωt+θ) = 0 for t. This was then converted to months and days. The above analysis was done for the series as a whole and separately for different time segments 1995-1997, 1998-2000, 2001-2003 and 2004-2006 in attempt to examine whether there have been shifts in the time of maxima over the years.Seasonal variation of the data was also examined using moving average method based on additive model. The need for additive model was because of the stationary pattern of the data. The adjusted seasonal variations were obtained for each quarter and were later used for projection of the quarters of the year 2011 and 2012.
| Table 1. Classification of the emergency cases that are handled at the AED of UCH |
| | Surgical Emergency | Medical Emergency | Gynecology Emergency | Psychiatry Emergency | Pediatric Surgical Emergency | | Trauma | Cardiovascular or Respiratory problems | Antepartum Hemorrhage | Violent Behavior | Foreign material in the body | | Acute Blunt abdominal/ chest injuries | Diabetic or liver problem | Postpartum Hemorrhage | Suicidal attempt | Chemical ingestion | | Severe Burn injuries | Chronic / Acute renal failure | Any reasons for virginal bleeding | | | | | Unconsciousness of any sort | Labour (Normal and abnormal) | | |
|
|
3. Results
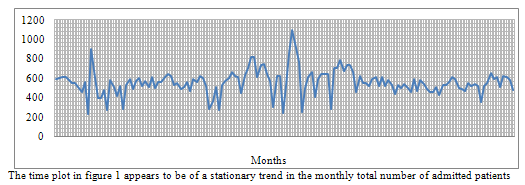 | Figure 1. Monthly Admission of patients in A&E Unit in UCH, Ibadan, 1995-2006 |
| Table 2. Autocorrelation for the Total Patients |
| | Lag K | Auto correlation | Lag K | Auto correlation | Lag K | Auto correlation | Lag K | Auto Correlation | | 1 | 0.324 | 11 | 0.054 | 21 | -0.051 | 31 | -0.036 | | 2 | 0.114 | 12 | -0.019 | 22 | -0.067 | 32 | 0.015 | | 3 | 0.008 | 13 | 0.053 | 23 | -0.013 | 33 | -0.022 | | 4 | 0.000 | 14 | 0.058 | 24 | -0.072 | 34 | -0.006 | | 5 | 0.045 | 15 | 0.076 | 25 | -0.104 | 35 | 0.0300 | | 6 | 0.010 | 16 | -0.067 | 26 | -0.001 | 36 | -0.078 | | 7 | -0.061 | 17 | 0.054 | 27 | 0.053 | 37 | -0.077 | | 8 | 0.060 | 18 | 0.04 | 28 | 0.077 | 38 | -0.010 | | 9 | 0.191 | 19 | 0.083 | 29 | 0.125 | 39 | -0.025 | | 10 | 0.093 | 20 | 0.041 | 30 | 0.114 | 40 | -0.105 |
|
|
Autocorrelation is important in identifying whether a time series (Xt) is stationary or not. This is done by using a correlogram which is the plot of rk against k, i.e the plot of sample of autocorrelation coefficient against lag k.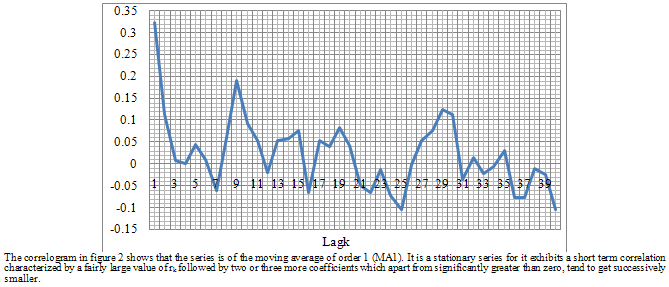 | Figure 2. Autocorrelation and Lagk of number of Admitted patients in A&E Unit in UCH, Ibadan, 1995-2006 |
Trigonometric Regression (T-R) Analysis| Table 3. Components Of The T-R Of The Total Patients For 1995-2000 |
| | T | Xt | XtSin ωt | XtCos ωt | T | Xt | XtSin ωt | XtCos ωt | | 1 | 592 | 296.11 | 512.62 | 37 | 615 | 307.61 | 532.54 | | 2 | 604 | 523.21 | 301.78 | 38 | 529 | 458.24 | 264.31 | | 3 | 606 | 606.00 | -0.38 | 39 | 543 | 543.00 | -0.34 | | 4 | 605 | 523.69 | -302.94 | 40 | 482 | 417.22 | -241.35 | | 5 | 574 | 286.48 | -497.40 | 41 | 503 | 251.04 | -435.88 | | 6 | 548 | -0.69 | -548.00 | 42 | 561 | -0.71 | -561.00 | | 7 | 543 | -272.19 | -469.85 | 43 | 464 | -232.59 | -401.49 | | 8 | 503 | -436.03 | -250.77 | 44 | 586 | -507.98 | -292.14 | | 9 | 454 | -454.00 | 0.86 | 45 | 556 | -556.00 | 1.05 | | 10 | 559 | -483.52 | 280.52 | 46 | 623 | -538.88 | 312.64 | | 11 | 230 | -114.54 | 199.45 | 47 | 595 | -296.30 | 515.97 | | 12 | 896 | 2.27 | 896.00 | 48 | 519 | 1.31 | 519.00 | | 13 | 673 | 338.10 | 581.91 | 49 | 282 | 141.67 | 243.83 | | 14 | 398 | 345.26 | 197.98 | 50 | 359 | 311.43 | 178.58 | | 15 | 399 | 399.00 | -1.26 | 51 | 508 | 508.00 | -1.61 | | 16 | 478 | 413.15 | -240.39 | 52 | 276 | 238.56 | -138.81 | | 17 | 270 | 134.16 | -234.31 | 53 | 531 | 263.85 | -460.81 | | 18 | 576 | -2.19 | -576.00 | 54 | 566 | -2.15 | -566.00 | | 79 | 512 | -263.35 | -439.08 | 55 | 595 | -306.04 | -510.26 | | 20 | 413 | -358.54 | -204.99 | 56 | 665 | -577.30 | -330.07 | | 21 | 522 | -521.99 | 2.31 | 57 | 625 | -624.99 | 2.77 | | 22 | 278 | -240.11 | 140.11 | 58 | 613 | -529.45 | 308.96 | | 23 | 527 | -261.28 | 457.67 | 59 | 449 | -222.61 | 389.93 | | 24 | 592 | 2.99 | 591.99 | 60 | 626 | 3.17 | 625.99 | | 25 | 483 | 243.70 | 417.01 | 61 | 699 | 352.68 | 603.50 | | 26 | 572 | 496.93 | 283.28 | 62 | 815 | 708.03 | 403.63 | | 27 | 602 | 601.99 | -3.43 | 63 | 817 | 816.99 | -4.65 | | 28 | 513 | 442.75 | -259.12 | 64 | 611 | 527.33 | -308.62 | | 29 | 564 | 279.01 | -490.15 | 64 | 731 | 361.62 | -635.29 | | 30 | 503 | -3.18 | -502.99 | 66 | 746 | -4.72 | -745.99 | | 31 | 605 | -305.92 | -521.96 | 67 | 638 | -322.60 | -550.43 | | 32 | 494 | -429.47 | -244.11 | 68 | 564 | -490.33 | -278.70 | | 33 | 557 | -556.99 | 3.87 | 69 | 301 | -300.99 | 2.09 | | 34 | 563 | -485.54 | 284.99 | 70 | 616 | -531.25 | 311.81 | | 35 | 605 | -298.63 | 526.16 | 71 | 616 | -304.06 | 535.73 | | 36 | 640 | 4.86 | 639.98 | 72 | 238 | 1.81 | 237.99 | | TOTAL | 19053 | 451.49 | 531.38 | TOTAL | 20063 | -135.40 | -473.09 |
|
|
| Table 4. Components Of The T-R Of The Total Patients For 2001-2006 |
| | T | Xt | XtSin ωt | XtCos ωt | T | Xt | XtSin ωt | XtCos ωt | | 1 | 527 | 263.60 | 456.34 | 37 | 493 | 246.59 | 426.90 | | 2 | 853 | 738.90 | 426.19 | 38 | 538 | 466.04 | 268.80 | | 3 | 1092 | 1092.00 | -0.69 | 39 | 494 | 494.00 | -0.31 | | 4 | 905 | 783.37 | -453.16 | 40 | 451 | 390.39 | -225.83 | | 5 | 765 | 381.80 | -662.91 | 41 | 587 | 292.96 | -508.67 | | 6 | 248 | -0.31 | -248.00 | 42 | 462 | -0.58 | -462.00 | | 7 | 498 | -249.64 | -430.91 | 43 | 581 | -291.24 | -502.73 | | 8 | 608 | -527.06 | -303.11 | 44 | 542 | -469.84 | -270.21 | | 9 | 664 | -664.00 | 1.26 | 45 | 485 | -485.00 | 0.92 | | 10 | 406 | -351.18 | 203.74 | 46 | 458 | -396.16 | 229.84 | | 11 | 590 | -293.81 | 511.64 | 47 | 459 | -228.58 | 398.04 | | 12 | 638 | 1.61 | 638.00 | 48 | 505 | 1.28 | 505.00 | | 13 | 636 | 319.51 | 549.92 | 49 | 426 | 214.01 | 368.34 | | 14 | 636 | 551.73 | 316.37 | 50 | 523 | 453.70 | 260.16 | | 15 | 286 | 286.00 | -0.90 | 51 | 523 | 523.00 | -1.65 | | 16 | 704 | 608.49 | -354.05 | 52 | 557 | 481.43 | -280.12 | | 17 | 702 | 348.82 | -609.20 | 53 | 610 | 303.11 | -529.36 | | 18 | 783 | -2.97 | -782.99 | 54 | 591 | -2.24 | -591.00 | | 79 | 674 | -346.67 | -578.01 | 55 | 492 | -253.06 | -421.93 | | 20 | 734 | -637.20 | -364.32 | 56 | 489 | -424.51 | -242.71 | | 21 | 737 | -736.99 | 3.26 | 57 | 461 | -461.00 | 2.04 | | 22 | 660 | -570.04 | 332.65 | 58 | 546 | -471.58 | 275.19 | | 23 | 456 | -226.08 | 396.01 | 59 | 518 | -256.82 | 449.85 | | 24 | 625 | 3.16 | 624.99 | 60 | 538 | 2.72 | 537.99 | | 25 | 543 | 273.97 | 468.81 | 61 | 521 | 262.87 | 449.82 | | 26 | 543 | 471.73 | 268.92 | 62 | 356 | 309.28 | 176.31 | | 27 | 521 | 520.99 | -2.96 | 63 | 518 | 517.99 | -2.95 | | 28 | 593 | 511.79 | -299.53 | 64 | 549 | 473.82 | -277.30 | | 29 | 611 | 302.26 | -531.00 | 64 | 648 | 320.56 | -563.15 | | 30 | 522 | -3.30 | -521.99 | 66 | 593 | -3.75 | -592.99 | | 31 | 609 | -307.94 | -525.41 | 67 | 612 | -309.46 | -528.00 | | 32 | 517 | -449.47 | -255.47 | 68 | 511 | -444.25 | -252.51 | | 33 | 577 | -576.99 | 4.01 | 69 | 615 | -614.99 | 4.28 | | 34 | 525 | -452.77 | 265.75 | 70 | 610 | -526.08 | 308.78 | | 35 | 434 | -214.22 | 377.45 | 71 | 583 | -287.77 | 507.03 | | 36 | 530 | 4.02 | 529.98 | 72 | 477 | 3.62 | 476.99 | | TOTAL | 21952 | 853.12 | -549.34 | TOTAL | 18922 | -169.53 | -607.16 |
|
|
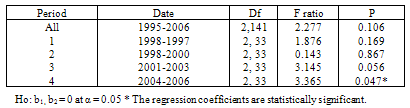
Table 5. Analysis of variance for T-R model
 |
| |
|
| Table 6. Trigonometric Regression Of The Total Patients In A&E Unit, UCH, (1995-2006) |
| | Period | A | P | ϴ(degrees) | ϴ(radians) | M(μ) | ti | a/μ | Estimated Time of Peak | | 1995-2006 | 20.62 | 0.106 | 42.31 | 0.7384 | 555.49 | 7.5888 | 0.0485 | July | | 1995-1997 | 38.74 | 0.169 | 139.65 | 2.4374 | 529.25 | 4.3443 | 0.0732 | April | | 1998-2000 | 27.33 | 0.867 | 164.03 | 2.8629 | 557.31 | 3.5318 | 0.0490 | March | | 2001-2003 | 56.36 | 0.056 | 57.22 | 0.9987 | 609.78 | 7.0917 | 0.0924 | July | | 2004-2006 | 35.02 | 0.047* | 15.61 | 0.2724 | 525.61 | 8.4786 | 0.0666 | August |
|
|
Table 6 shows the results of the trigonometric regression analysis for the series as a whole and for each of the four time segments after adjustment. In all cases the simple trigonometric model was only significant in the last segment (2004-2006). For the 12-year period of study, the monthly number of patients in the Accident & Emergency varied by about 5% above and below the annual mean with the estimated peak occurring in the month of July. The extent of the seasonal variation above mean level was about 7%, 5%, 9% and 7% in 1995-1997, 1998-2000, 2001-2003 and 2004- 2006 respectively. The estimated month of peak was in April for the first segment (1995-1997), March for the second segment (1998-2000), July for the third segment (2001-2003) and August in the last segment (2004-2006).
3.1. Estimating the Trend
In view of the results of Trigonometry Regression in which the most of the coefficients are not significant, the data was classified to 4quarters in a year (1st Jan.-Mar.; 2nd Apr-Jun; 3rd July-Sept; 4th Oct.-Dec.). We then estimated the trend of the quarterly data using least square method (Additive approach) and moving average method to estimate the quarter with the highest peak.| Table 7. Quarterly Data Of The Total Number Patients In UCH |
| | YEAR | Q 1 | Q 2 | Q 3 | Q 4 | Total | | 1995 | 1802 | 1470 | 1657 | 1687 | 6616 | | 1996 | 1149 | 2331 | 2472 | 1558 | 7510 | | 1997 | 1607 | 1525 | 1472 | 1395 | 5999 | | 1998 | 1727 | 1324 | 1580 | 1546 | 6177 | | 1999 | 1373 | 2088 | 1918 | 2189 | 7568 | | 2000 | 1726 | 1500 | 1758 | 1790 | 6774 | | 2001 | 1500 | 1447 | 1656 | 1606 | 6209 | | 2002 | 1885 | 1503 | 1770 | 2145 | 7303 | | 2003 | 1703 | 1608 | 1442 | 1738 | 6491 | | 2004 | 1685 | 1397 | 1808 | 1737 | 6627 | | 2005 | 1688 | 1470 | 1634 | 1741 | 6533 | | 2006 | 1489 | 1422 | 1602 | 1670 | 6183 |
|
|
3.2. Moving Average Method
The moving averages and centered moving averages are needed to eliminate seasonal variations and irregular fluctuations from the data. Here we used a 4-period moving average because the AE time series data are arranged in quarters for easy assessment. The time series is then modeled using additive decomposition model. The model is . Where TRt, SNt, CLt, and IRt are trend, seasonal, cyclical and irregular variations respectively. Then seasonal factors were obtained by normalizing the
  values so that the normalized values sum to zero. The normalization is accomplished by subtracting the quantity
  from each of
  values. That is the estimate of SNt is
| Table 8. Estimation Of Trend Using Moving Average Method |
| | T | Xt | 4-Quarter Moving Total | 4-Quarter Moving Average | Trend Line | Seasonal Variation | | 1 | 1802 | - | - | - | - | | 2 | 1470 | 6616 | - | - | - | | 3 | 1657 | 5963 | 12579 | 1572 | 85 | | 4 | 1687 | 6824 | 12787 | 1598 | 89 | | 5 | 1149 | 7639 | 14463 | 1808 | -659 | | 6 | 2331 | 7510 | 15149 | 1894 | 437 | | 7 | 2472 | 7968 | 15478 | 1935 | 537 | | 8 | 1558 | 7162 | 15130 | 1891 | -333 | | 9 | 1607 | 6162 | 13324 | 1666 | -59 | | 10 | 1525 | 5999 | 12161 | 1520 | 5 | | 11 | 1472 | 6119 | 12118 | 1515 | -43 | | 12 | 1395 | 5918 | 12037 | 1505 | -110 | | 13 | 1727 | 6026 | 11944 | 1493 | 234 | | 14 | 1324 | 6177 | 12203 | 1525 | -201 | | 15 | 1580 | 5823 | 12000 | 1500 | 80 | | 16 | 1546 | 6587 | 12410 | 1551 | -5 | | 17 | 1373 | 6925 | 13512 | 1689 | -316 | | 18 | 2088 | 7568 | 14493 | 1812 | 276 | | 19 | 1918 | 7921 | 15489 | 1936 | -18 | | 20 | 2189 | 7333 | 15254 | 1907 | 282 | | 21 | 1726 | 7173 | 14506 | 1813 | -87 | | 22 | 1500 | 6774 | 13947 | 1743 | -243 | | 23 | 1758 | 6548 | 13322 | 1665 | 93 | | 24 | 1790 | 6495 | 13043 | 1630 | 160 | | 25 | 1500 | 6393 | 12888 | 1611 | -111 | | 26 | 1447 | 6209 | 12602 | 1575 | -128 | | 27 | 1656 | 6594 | 12803 | 1600 | 56 | | 28 | 1606 | 6650 | 13244 | 1656 | -50 | | 29 | 1885 | 6764 | 13414 | 1677 | 208 | | 30 | 1503 | 7303 | 14067 | 1758 | -255 | | 31 | 1770 | 7121 | 14424 | 1803 | -33 | | 32 | 2145 | 7226 | 14347 | 1793 | 352 | | 33 | 1703 | 6898 | 14124 | 1766 | -63 | | 34 | 1608 | 6491 | 13389 | 1674 | -66 | | 35 | 1442 | 6473 | 12964 | 1621 | -179 | | 36 | 1738 | 6262 | 12735 | 1592 | 146 | | 37 | 1685 | 6628 | 12890 | 1611 | 74 | | 38 | 1397 | 6627 | 13255 | 1657 | -260 | | 39 | 1808 | 6630 | 13257 | 1657 | 151 | | 40 | 1737 | 6703 | 13333 | 1667 | 70 | | 41 | 1688 | 6529 | 13232 | 1654 | 34 | | 42 | 1470 | 6533 | 13062 | 1633 | -163 | | 43 | 1634 | 6334 | 12867 | 1608 | 26 | | 44 | 1741 | 6286 | 12620 | 1578 | 163 | | 45 | 1489 | 6254 | 12540 | 1568 | -79 | | 46 | 1422 | 6183 | 12437 | 1555 | -133 | | 47 | 1602 | - | - | - | - | | 48 | 1670 | - | - | - | - |
|
|
Table 9. Seasonal variation adjustment
 |
| |
|
Table 10. Projected Number Of Patients In Accident And Emergency Wards In Uch For The Period, 2011- 2012
 |
| |
|
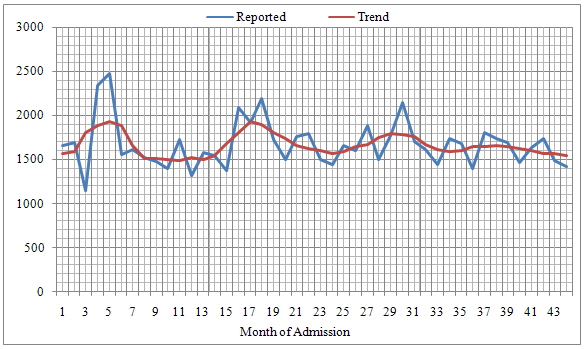 | Figure 3. Reported and Trend of number of patients in A&E Unit in UCH, Ibadan, 1995-2006 |
| Table 10. Descriptive Statistics of Males and Females in AE unit UCH, Ibadan 1995-2006, |
| | | Mean | N | Std. Deviation | Std. Error Mean | | Males | 306.63 | 144 | 69.555 | 5.796 | | Females | 248.85 | 144 | 65.274 | 5.439 |
|
|
| Table 11. t-test for Males and Females in AE unit UCH, Ibadan, 1995-2006 |
| | Variable | Mean | Sd | S.E | 95% C.I | df | Sig.(2-tailed) | | Male Vs Female | 57.78 | 40.923 | 3.41 | 51.037 | 64.519 | 143 | 0.000 | | Pre Vs Post Military Rule | 3.79 | 114.56 | 16.54 | -29.47 | 37.06 | 47 | 0.229 |
|
|
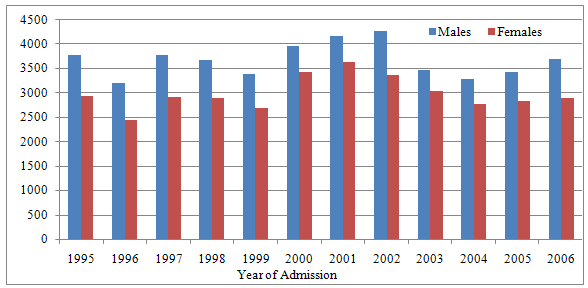 | Figure 4. Number of Admission by sex versus year of admission in A&E Unit in UCH, Ibadan, 1995-2006 |
4. Discussion
Seasonal index showed that the peak of number of patients admitted was observed in the last quarter of every year. This is an indication that admission occurs mostly during the festive periods where most people travel to their native homes to celebrate with their love ones. Our finding corroborates the findings of[14] where it was reported that “the incidences of the RTA are on the increase and characterized by seasonal factors as can be seen from the high values of the seasonal indices for the months of January, February, May, June, October, November and December”. However, our result is at variance with the findings in [15] and [16] where they claimed that highest number of RTA occurs during the rainy season, whereas our study suggested the peak is during the dry seasons. The estimated adjusted seasonal variations were used to make projections for years 2011 and 2012. The projected quarterly figures for 2011 (Q1=1488, Q2=1497, Q3=1632, Q4=1634) and 2012 (Q1=1490, Q2=1499, Q3=1634, Q4=1635). The number of males patients admitted into AE wards was consistently higher than numbers of females for each of the year. This finding is in agreement with the report made by [15,9,17] where they stated that number of male victims in RTA is higher than that of females. The monthly mean number of admitted males and females were compared using t-test over the periods under study and the analysis revealed that there is significant difference between males  andfemales
  number of admission (p<0.05). The differential can be accounted for going by more exposure of males to occupational and transport hazards than their female counterparts. For instance,[18] reported that accidents resulted from motorbike commercial riders in Nigeria constituted a high proportion of daily reported cases of accident. It is only men that engage in this business and as such, more vulnerable than women. Temporary internal migration was also more common among men than women in Nigeria, this make them more susceptible to accidents than women. This study also carried out a comparison of the study period divided into period of military rule and democracy. No significant difference existed between number of A&E patients admitted during the two periods (p>0.05). This can be explained by total collapse of socio-economic and health infrastructures including abject poverty that persisted for a long period during military regime which transcends to democracy rule. The dilapidated facilities need many more years for revitalization.
5. Conclusions
Time series analysis is a very important tool in medical outfit like UCH, since the predictions of future number of patients and cases of specific diseases must be incorporated into the decision-making process and planning. This will assist management to make intelligent decision. The foregoing results show that the number of patients seen at the accident and emergency unit of the UCH peaks in the last quarter of every year and are higher in males. The hospital management should engage more care givers and make available more resuscitating medical equipments during the last quarter of the year.
ACKNOWLEDGEMENTS
The authors are grateful to the Director Central Medical Record of the University College Hospital (UCH), Ibadan who gave permission for the use of data set. We also thank Professor Olushola Ayeni for his contributions and technical advice in the course of the paper write-up and those who made an input at one time or the other.
References
| [1] | Kendric S. (1996) The Pattern of increase in emergency Hospital admission in Scotland. Health Bull 1996; 54:169-83. |
| [2] | Capewell S, Povey C, (1997). Bed occupied by emergency patients: long term trends in patterns of short term fluctuations in Scotland. Health Bull, 1997; 55:167-75. |
| [3] | Thanni, L.O.A. and O.A. Kehinde, 2006. Trauma at a Nigerian teaching hospital: Pattern and documentation of presentation. Afr. Health Sci., 6: 104-107.Office for Scotland national statistics, 1997) |
| [4] | Peden Mc Gee & Krug E (Eds) (2004) World report on Road Traffic injuries. Geneva: World Health Organization, 2004. |
| [5] | Edeaghe Ehikamenor. The Role of NGOs in Management of Accident Victims in Nigeria. Preshop Disast Med 2001:16(2): 524. |
| [6] | Wintemute G. (1985) Is motor vehicle related mortality: a disease of development? Accident Analysis and Prevention , 17, 223-237 |
| [7] | Mills Tettey and Fadare O. (1991). Socio-economy and investment of characteristics of a traditional Yoruba Market. Third World Planning Review 13, 199-206 |
| [8] | Sola-gberu B.A, Ofoegbu CK, Nasir AA, Ogundipe OK et al. motorcycle injuries in a developing country and the vulnerability of riders, passengers and pedestrians. Inj. Prev. 2006; 12; 262-266 |
| [9] | Odelowo E.O, Pattern of Trauma resulting from motorcycle accidents in Nigerians: A two year prospective study. Afri J Med Sci 1994; 23 109-12. |
| [10] | Owoaje E.T, Amoran O.E, Osemikhain O.O, Ohnoferi O.E. Incidence of road traffic accidents and pattern of injury among commercial motorcyclists in a rural community in Southwestern Nigeria. Journal of community Medicine and Primary Health care June;17(1) :7 126. |
| [11] | Fasika, O.M, (1997) Changing Pattern of Epidemiology and Compliance Factor in Management at Ibadan. The Nigerian Postgraduate Medical Journal June 1997; 4 |
| [12] | Fernandez – Morales E (1997) Epidemiology of Burns in Malaga, Spain. Medline. 23(4): 323-32 |
| [13] | Hu X, Wesson D and Kenney B. Home Injuries to Children. Can J Public Health 1993: 84: 155-158 |
| [14] | J. Ohakwe, I.S. Iwueze and D.C. Chikezie, 2011. Analysis of Road Traffic Accidents in Nigeria: A Case Study of Obinze/Nekede/Iheagwa Road in Imo State, Southeastern, Nigeria. Asian Journal of Applied Sciences, 4: 166-175 |
| [15] | Oluwadiya K.S., Oginni I. M. Olasehinde A. A. and Fadiora S. O. (2004), Motorcycle Limb injuries in a developing countries, WAMJ Vol. 23 No 1 pp 42-47 |
| [16] | Eke, N., E.N. Etebu and S.O. Nwosu, 2000. Road traffic accident mortalities in port harcourt, Nigeria. Anil Aggrawals Internet J. Forensic Med. Toxicol., Vol 1(2). |
| [17] | Deaner R. M. and Fitchett V. H. (1975) Motorcycle trauma. J trauma, Vol 15, pp 678-681 |
| [18] | Adeloye E. and Odeku E. L. (1970) The pattern of road traffic accidents seen at University \college Hospital, Ibadan, Nigeria: A preliminary study. West African Medical Journal 1970, 153-157 |
 Abstract
 Reference
 Full-Text PDF
 Full-Text HTML