-
Paper Information
- Next Paper
- Previous Paper
- Paper Submission
-
Journal Information
- About This Journal
- Editorial Board
- Current Issue
- Archive
- Author Guidelines
- Contact Us
American Journal of Computational and Applied Mathematics
p-ISSN: 2165-8935 e-ISSN: 2165-8943
2011; 1(2): 98-100
doi: 10.5923/j.ajcam.20110102.19
Modeling and Predicting Cumulative Population of Bangladesh
 Abstract
 Reference
 Full-Text PDF
 Full-Text HTML
Md. Rafiqul Islam
Dept. of Population Science and Human Resource Development, University of Rajshahi, Bangladesh
Correspondence to: Md. Rafiqul Islam , Dept. of Population Science and Human Resource Development, University of Rajshahi, Bangladesh.
| Email: |  |
Copyright © 2012 Scientific & Academic Publishing. All Rights Reserved.
The purpose of the present study is to build up some mathematical models for male and female forward cumulative population of . For this, the secondary data for population of have been taken from census of 2001. To check up the validity of the models, the model validation technique, cross-validity prediction power (CVPP), is employed in this paper. It is seen that male and female forward cumulative population of follow four parameters polynomial model. It is found that the parameters of these fitted models are highly significant with large proportion of variance explained. Moreover, these models are stable more than 99%. The stability of R2 of these models is more than 99%. Hence, the fittings of these models are well.
Keywords: Male and Female Population of , Polynomial Model, Cross- Validity Prediction Power (CVPP), T-Test, F-Test
Cite this paper: Md. Rafiqul Islam , "Modeling and Predicting Cumulative Population of Bangladesh", American Journal of Computational and Applied Mathematics , Vol. 1 No. 2, 2011, pp. 98-100. doi: 10.5923/j.ajcam.20110102.19.
Article Outline
1. Introduction
- In , population census usually carried out at ten year interval of time is the most important source of data on size, structure and distribution of population by region or any other demographic and socio-economic phenomena. The Government and Non-government organizations do require the up-to-the-minute information on population. As a consequent, one can easily utilize to formulate realistic devices for development for the present as well as future time. The Government along with demographers is not only the users of population but also trade unions, social organizations, university and other social research institutes and centers, market research analysis, housing developers and business communities frequently do need these estimates for their individual purposes. Population or population by region, religion, age and sex is used to serve as the denominator for the estimation of socio-demographic, health and development related indicators. For that reason, population should be accurate as well as error free for the estimation of different indicators. But not only in but also in any developing countries census population are tremendously affected by various types of errors. So, these might be removed by fitting mathematical model. Islam (2003) mentioned that age structure for male, female and both sexes population of follows either negative exponential model or modified negative exponential model. Islam et al. (2003)reported that age related population for male of in 1991 follows modified negative exponential model. Islam (2004) showed that proportion of married women of in the reproductive life span follow 3rd degree polynomial model. It was observed that age structure for population of both sexes of follows negative exponential model (Islam et al., 2005). In Islam (2007), it was investigated that the age specific marital fertility rates (ASMFRs) in rural area of follows 2nd degree polynomial model and simple linear regression model where as forward cumulative ASMFRs follows 3rd degree polynomial model.At this juncture, an attempt would be made to mull over the pattern for cumulative population of in 2001 census using mathematical model. Therefore, the fundamental objectives of this study are as follows:i) to build up some mathematical models for male and female forward cumulative population of in 2001 census, and ii) to apply CVPP to test the adequacy of the model.This paper is divided into five divisions. Introduction is included in the first section. Second section is data and data source of the study. Section three contains methods and various methodological issues in which data smoothing, model building, validation technique of model and F-test are described. Results of model fittings and discussion are narrated in section four. As a final point, conclusion of this study is in division five.
2. Data and Data Source of the Study
- To fulfill the objectives mentioned in the introduction section of this manuscript, the secondary data on population for male, female and both sexes of by age group in years have been taken from 2001 census (BBS, 2003). These have been utilized as raw materials in the present study and shown in Table 1.
3. Methods and Various Methodological Issues
3.1. Data Smoothing
- The cumulative population for male, female and both sexes by age group in years smoothed before going to fit the mathematical model to this data set. For this, using the Package Minitab Release 12.1 by the latest smoothing method named “4253H, twice” (Velleman, 1980) is employed here. After that, the smoothed data are used to fit model and these smoothed data have been launched in Table 1.
3.2. Model Building
- If the forward cumulative distribution of population by age group is plotted in the graph paper then it can be seen that cumulative distribution of population are distributed by polynomial model in terms of ages. Therefore, an nth degree polynomial model is treated and the structural formation of the model is addressed by
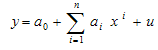 (Montgomery and Peck, 1982)Where, x is the mean value of the age group; y is forward cumulative distribution of population;
  is the constant; is the coefficient of
  (i =1, 2, 3, ..., n) and u is the stochastic error term of the model. Here, a suitable n is chosen such that the error sum of square is minimum.
3.3. Validation Technique of Model
- To probe the validity of these models, the CVPP,, is applied. The mathematical formula for CVPP is known by
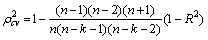 Where, n is the number of classes, k is the number of explanatory variables in the model and the cross-validated R is the correlation between observed and predicted values of the dependent variable (Stevens, 1996). The shrinkage of the model is equivalent to
 ; where
 is CVPP and R2 is the coefficient of determination of the model. Moreover, 1-shrinkage is the stability of R2 of the model. The estimated CVPP analogous to their R2 and information on model fittings are presented in Table 2. It was informed that CVPP was also employed as validation method by Islam (2003 and 2007) and Islam et al. (2003 and 2005).
|
3.4. F-test
- To find out the measure of overall significance level of the fitted models as well as the significance of R2 , the F-test is employed here. The F-test is given by
 with (l-1, n-l) degrees of freedom (d.f.).Where, l = the number of parameters is to be estimated, n is the number of cases and R2 is the coefficient of determination of the model (Gujarati, 1998).
4. Results of Model Fittings and Discussion
- The fitted model for forward cumulative distribution of population for male of in 2001 is:
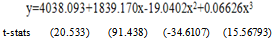 | (1) |
 | (2) |
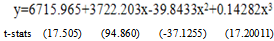 | (3) |
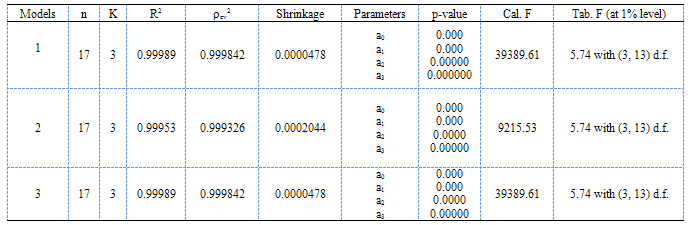
 , corresponding to their R2 of these models is shown in Table 2. From this table it appears that all the fitted models (1) - (3) are highly cross- validated and their shrinkages are 0.0000478, 0.0002044 and 0.0002044 respectively. Moreover, it is found that the parameters of the fitted model (1) - (3) are highly statistically significant with large proportion of variance explained. Moreover, these models are stable more than 99%. The stability of R2 of these models is more than 99%.The calculated values of F statistic for the models (1) - (3) are 39389.61, 9215.53 and 39389.61 with (3, 13) d.f. respectively whereas the analogous tabulated values are only 5.74 at 1% level of significance. Therefore, from these statistics it is seen that these models and their analogous R2 are highly statistically significant. Hence, the fits of these models are well.
5. Conclusions
- In this study, it is observed that forward cumulative distribution of male, female and both sexes population follow 3rd degree polynomial model, i. e., cubic polynomial models containing four parameters. Hope one might be used these predicted population of in 2001 census for further higher study as more smoothened as well as more reliable data than that of observed data aggregate.
References
| [1] | BBS (2003). Bangladesh Population Census 2001, National Report, Government of the People’s Republic of , |
| [2] | Gujarati, Damodar N. (1998). Basic Econometrics, Third Edition, McGraw Hill, Inc., |
| [3] | Islam, Rafiqul (2003). Modeling of Demographic Parameters of -An Empirical Forecasting, Unpublished Ph.D. Thesis, |
| [4] | Islam, Rafiqul, Islam, Nurul, Ali, Md. Ayub & Mostofa, Md. Golam (2003). Construction of Male Life Table from Female Widowed Information of Bangladesh, International Journal of Statistical Sciences, Vol. 2, Dept. of Statistics, University of Rajshahi, Bangladesh, Page 69-82 |
| [5] | Islam, Rafiqul (2004). Indirect Estimation of fertility Parameters of Bangladesh, Journal of Indian Anthrop. Soc. Vol.39, No. 2, Page 195-202 |
| [6] | Islam, Rafiqul, Islam, Nurul, Ali, M. Korban & Mondal, Md. Nazrul Islam(2005). Indirect Estimation and Mathematical Modeling of Some Demographic Parameters of , The Oriental Anthropologist, Vol. 5(2), Page 163 - 171 |
| [7] | Islam, Rafiqul (2007). Mathematical Modeling of Age Specific Marital Fertility Rates (ASMFRs) in Rural , Middle East J. of Age and Ageing, Vol. 4(4) |
| [8] | Stevens, J. (1996). Applied Multivariate Statistics for the Social Sciences, Third Edition, Lawrence Erlbaum Associates, Inc., Publishers, |
| [9] | Velleman, P. F. (1980). Definition and Comparison of Robust Nonlinear Data Smoothing Algorithms, Journal of the American Statistical Association, Volume 75. Number 371, Page 609-615 |