-
Paper Information
- Paper Submission
-
Journal Information
- About This Journal
- Editorial Board
- Current Issue
- Archive
- Author Guidelines
- Contact Us
American Journal of Computer Architecture
2023; 10(1): 15-19
doi:10.5923/j.ajca.20231001.03
Received: Jun. 27, 2023; Accepted: Jul. 16, 2023; Published: Jul. 24, 2023

The Data Warehouse’s Role in Supporting the Data Trilogy
 Abstract
 Reference
 Full-Text PDF
 Full-text HTML
Sankul Seth
AVP, Data, Analytics & Science, Pensacola, Florida, United States
Correspondence to: Sankul Seth, AVP, Data, Analytics & Science, Pensacola, Florida, United States.
| Email: |  |
Copyright © 2023 The Author(s). Published by Scientific & Academic Publishing.
This work is licensed under the Creative Commons Attribution International License (CC BY).
http://creativecommons.org/licenses/by/4.0/

Business intelligence, predictive analytics, and data monetization, which are collectively known as the data trilogy, analyze and deploy data to help businesses make informed decisions, predict outcomes, and generate revenue. These strategies all depend on the data warehouse, which collects data from disparate sources and transforms it to a common format. The function of a data warehouse is to ensure sure that data is standardized, accessible, and secure. Success with the data trilogy depends on allowing sufficient time to train data models, identifying proper use cases, and involving skilled employees.
Keywords: Big Data, Predictive Analytics, Business Intelligence, Data Monetization, Data Warehouse
Cite this paper: Sankul Seth, The Data Warehouse’s Role in Supporting the Data Trilogy, American Journal of Computer Architecture, Vol. 10 No. 1, 2023, pp. 15-19. doi: 10.5923/j.ajca.20231001.03.
Article Outline
1. Introduction
- Across sectors, businesses are increasingly turning to data to make decisions and generate revenue. Data-driven decision intelligence includes three key components: business intelligence, predictive analytics, and data monetization. Together, these three pillars create the “data trilogy.” (Figure 1) All three involve the gathering, analysis, and deployment of data. Business intelligence focuses on using data to give stakeholders information that can be used to make more informed decisions about the company’s future. Predictive analytics uses historical data to make predictions. Finally, data monetization refers to the process of analyzing data in order to generate revenue. These three interrelated strategies are all deeply dependent on the backbone of the data trilogy: the data warehouse. A data warehouse is a centralized repository of integrated data from various sources across the organization that is used to support business intelligence activities such as reporting, querying, and analysis. By bringing together data from disparate sources and transforming it into a common format, a data warehouse enables organizations to gain a holistic view of their operations, customers, and markets.
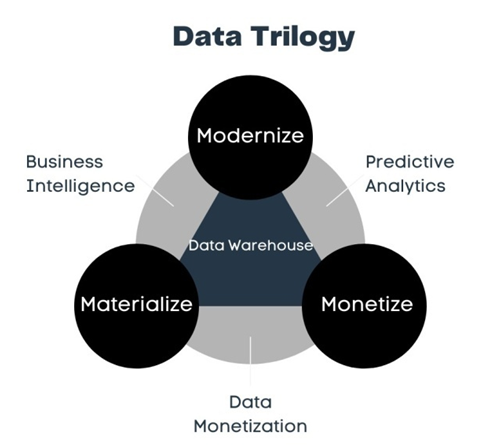 | Figure 1. The data trilogy of business intelligence, predictive analytics, and data monetization is supported by the data warehouse |
2. Business Intelligence
- The purpose of business intelligence is to use data to create an image of the current state of a company, which can then be used to make more informed decisions about the company’s future. To accomplish that, historical data related to business operations, performance, and metrics are gathered and analyzed. This includes data from various sources such as sales transactions, customer interactions, financial records, and operational data. This centralized data is presented in a meaningful fashion via data dashboards, visualizations, and reports so it can be understood by non-technical stakeholders. Business intelligence typically requires structured data, such as numerical values, categorical data, and time-series data, but the specifics will vary from industry to industry. In a financial organization, the data could include mortgage and loan data, credit and debit card transactions, cardholder data, and more. In the retail industry, data visualization might focus on customer orders, shipments, transactions, and product information. Business intelligence is related to, but distinct from, business analytics, which focuses more on statistics and quantitative tools. Since 2010, both business analytics and business intelligence have increased in prominence, driven by factors such as the availability of inexpensive, high-capacity storage, advances in processing power, and the rise of cloud computing. [1] Other primary drivers of changes in business intelligence include technology developments, the growing availability of data, and evolving business needs. Additionally, the emergence of self-service and democratized business intelligence platforms like Microsoft Power BI, Tableau, Qlik, MicroStrategy, and SAP BO have played a significant role in enabling analysts and business users to develop and gain data insights more efficiently. These platforms allow users to connect directly to data sources, such as data marts, and provide user-friendly interfaces and tools that facilitate faster and more reliable data analysis and visualization.
3. Predictive Analytics
- Predictive analytics is the process of using data, statistical algorithms, machine learning techniques, and artificial intelligence to identify the likelihood of future outcomes, based on potentially hundreds of variables. Predictive analytics uses statistics and machine learning to determine the likelihood of various outcomes. It involves collecting historical data as well as additional third-party data that may have predictive value. This can include both structured and unstructured data from various sources, such as customer demographics, past behavior, social media activity, sensor data, and external factors like economic indicators or weather data. To be most effective, predictive analytics requires a diverse range of data types, including numerical data, text data, images, and more. It often involves combining different data sources to build predictive models and identify patterns or trends. In an interesting example of predictive analytics, the Chinese e-commerce provider Alibaba determined that customers were more likely to buy products during the full moon. The company was able to use this information to increase sales. [2]Predictive analytics is a growing and well-publicized field, but it is not without its challenges. Many predictive models turn out to be inaccurate. Very few models attempting to predict the spread of COVID-19, for example, provided accurate results. The difficulties involved in predictive analytics include finding enough data to train the algorithm and discovering the right variables, which can number in the hundreds. It can also be difficult to find professionals with expertise in predictive analytics. Perhaps the biggest obstacle to developing accurate and useful predictive analytics models, however, is time. Refining a model to achieve 70-80 percent accuracy can take as long as six to eight months. It is important for organizations to have realistic expectations regarding when they can expect results from their predictive analytics models.
3.1. Key Performance Indicators in Predictive Analytics
- In predictive analytics, key performance indicators (KPIs) refer to metrics used to measure the effectiveness and success of predictive analytics initiatives. These indicators help organizations evaluate the performance of their predictive models and determine if they are achieving their desired outcomes. The appropriate metrics to evaluate the performance of predictive models depend on the data type and specific task requirements. For best results, it is important to consider multiple metrics and domain knowledge. In the financial industry, one frequently used predictive model is the delinquency model, which utilizes various key performance indicators (KPIs) such as credit score, account longevity, missed payments, debt-to-income ratio (DTI), loan-to-value ratio (LTV), and others. This model predicts the likelihood of an account becoming delinquent within the next 180 days, enabling financial institutions to proactively assist customers by offering various options to manage their finances and prevent delinquency. Common KPIs in predictive analytics include:• Prediction accuracy. This measures the accuracy of predictions made by the model, assessing how closely the predicted values align with the actual outcomes.• Precision and recall. These are evaluations of a model’s ability to correctly identify positive and negative instances. Precision measures the proportion of correctly predicted positive instances, while recall measures the proportion of actual positive instances correctly predicted by the model.• Mean absolute error (MAE) and root mean square error (RMSE). These metrics quantify the average difference between predicted and actual values. MAE measures the average absolute difference, while RMSE measures the square root of the average squared difference.• Lift. This is a measure of the improvement in predictive power compared to random chance.• Area under the curve (AUC). AUC is a measurement of the performance of the model’s predicted probabilities calculated by evaluating the area under the receiver operating characteristic (ROC) curve. It is commonly used in binary classification problems.• Model training time. This measures the time required to train the predictive model. It is especially important in real-time or time-sensitive applications where speed is crucial.• Return on investment (ROI). This metric evaluates the financial benefits achieved from predictive analytics initiatives. It considers the cost of implementing the model and the value generated from its predictions.
4. Data Monetization
- The sheer amount of data created by online activity in the modern world is staggering. It has been estimated that each minute, 204,166,667 e-mails are sent, and two million online searches are conducted. This mass of activity means that there is a monumental pool of data for organizations to analyze and potentially monetize. [2] Data monetization is the process of using statistical analysis to generate revenue for the company. It focuses on leveraging data as an asset to generate revenue or business value. This can involve collecting and aggregating data from multiple sources, which may include internal data, third-party data, public data, or data acquired through partnerships. Often, data monetization involves analyzing personal data to target customers with customized messages. The specific data required for data monetization depends on the business model and the target audience. It can include customer profiles, behavioral data, market trends, consumer preferences, or any other data that can be valuable to external entities or partners. Frequently, the process begins with the division of customers or users into “data segments” based on categories such as age. These data models are used to target new markets, members, and products. Strategic use of data liquidity, which refers to the ability to transform and reuse data for different purposes, can enhance the potential for data monetization. Customer and product data, for example, are highly suitable for monetization, especially when liquidized. [3]Data monetization has evolved due to organizations’ increasing need for personalized customer experiences and the desire to acquire new customers. Data plays a crucial role in defining customer journeys and creating targeted content through data models and customer personas. Building a robust data analytics marketing platform is a critical step in this process. Advancements in technology, such as the availability of open-source tools like Python, facilitate the conversion of unstructured datasets into structured ones, enabling deep insights. These insights can then be used to engage customers through platforms like HubSpot, Salesforce Marketing Cloud, Adobe Campaign, and Marketo.Currently, Amazon is the industry leader when it comes to data monetization. The company tracks each move a customer makes on its platform and uses this to target ads toward them. Amazon has been successful both because of the volume of data the company has been able to collect due to its large user base and because Amazon understands that each customer action—not merely transactions—provides potentially usable data. Many businesses in a multitude of sectors, including Walmart and CapitalOne, are following Amazon’s example.
5. Importance of the Data Warehouse
- The data warehouse is a centralized repository of data collected from different sources across the organization. Raw data arrives in the warehouse lacking a standardized format or structure. An important part of the role of the data warehouse is to transform data into a common format so that it can be used to create a holistic view of a company’s operations, customers, and markets. Dividing the data into specific categories, called segments, is also an essential first step in the analysis that enables data monetization. Python tools, as well as analytics software like Adobe Experience Manager, HubSpot, Salesforce, and Tableau, are available to help organize the data, create segmentation, and present the data in a way that can be easily understood. The most critical characteristics and functions of an ideal data warehouse are as follows:• Data integration. This is the ability to gather and combine data from various sources, such as databases, applications, and external systems, ensuring consistent and accurate information.• Data quality. Data cleansing, validation, and standardization processes are used to ensure data accuracy, completeness, consistency, and reliability.• Scalability. This is the capacity of the data warehouse to handle large volumes of data and accommodate future growth without sacrificing performance or stability.• Performance. Data warehouses with efficient data retrieval and query processing capabilities can provide timely and responsive access to data, even for complex analytical queries.• Flexibility. This is the ability to adapt to changing business requirements, allowing for the addition or modification of data sources, data models, and analytical capabilities.• Security. Robust security measures are used to protect data confidentiality, integrity, and availability, including user authentication, authorization controls, and encryption.• Metadata management. Comprehensive management of metadata, including data definitions, lineage, transformations, and business rules, is used to guarantee accurate interpretation and usability of data.• Data governance. Data warehouses implement policies, processes, and controls to ensure data consistency, compliance with regulations, and adherence to data standards and best practices.• Historical data storage. Retaining historical data supports trend analysis, forecasting, and decision-making based on historical patterns and performance.• Accessibility and usability. Providing user-friendly interfaces, tools, and reporting capabilities allow business users to easily access and analyze data, without requiring extensive technical knowledge.• Backup and recovery. Regular backups and a solid disaster recovery plan can safeguard data against loss or corruption, ensuring business continuity.• Metadata-driven approach. Utilizing metadata-driven design and development techniques enable easier maintenance, extensibility, and understanding of the data warehouse structure and content.These characteristics collectively contribute to the effectiveness of a data warehouse in supporting informed decision-making, data analysis, and business intelligence initiatives.
6. Common Issues with Data Trilogy
- Issues with the establishment and use of business intelligence, predictive analytics, and data monetization usually arise from a lack of knowledge. Many organizations have unrealistic expectations regarding how quickly data models will be ready to use. Accurate models take time to train. Additionally, it is important to be aware that data collection, while very important, is only the first step of the process. Organizations must also know and plan for how to use data after collection. Identifying proper use cases is a key part of applying these technologies successfully. The success of the data trilogy also hinges heavily on the mindset and commitment of top decision-makers within the organization. Their willingness to embrace data-driven approaches and leverage the insights derived from the data trilogy profoundly influences the overall effectiveness of the organization's data-driven decision-making processes. Keeping leadership involved and informed, however, can pose a challenge. Analyzing available data and identifying gaps in leadership and stakeholder knowledge is a crucial first step. The data should then be transformed into meaningful insights that can be easily understood by leadership. By presenting these insights, the data trilogy empowers leaders to develop a deeper understanding of their organization's operations, identify areas for improvement, and make informed decisions based on reliable information.Developing a strategy roadmap for the implementation of the data trilogy can also help organizations anticipate and deal with potential challenges. This roadmap should outline the necessary steps, resources, and timelines for effectively executing each phase of the trilogy. Integrating data analysis tools, establishing data governance frameworks, and ensuring the availability of reliable and accurate data sources requires significant effort and coordination. A strategy roadmap can help ensure that these processes go smoothly.Research has revealed that the success of business intelligence and data analytics initiatives depends not only on the technology and data involved but also on the human infrastructure and business strategy supporting them. [1] In fact, prioritizing technology at the expense of human skills is one of the leading causes of failure in big data initiatives. While new technologies can help with the collection and analysis of data, proper utilization requires the expertise of skilled employees. [4] Crucial to the success of these initiatives is the involvement of individuals with interpersonal and managerial skills, as well as those with technical expertise in the relevant technologies, including machine learning, artificial intelligence, and data cleaning and analytics. [4] Employees with technical skills have been shown to improve an organization’s operational performance, while skilled managers tend to positively impact market performance. Both are key to improving an enterprise’s financial performance. Overall, it is clear that businesses can maximize the benefits of the data trilogy by focusing on talent as well as technology.
7. Importance of the Data Governance Frameworks
- A data governance framework offers a systematic approach to managing and safeguarding data throughout its lifecycle within an organization. By establishing clear policies, procedures, and controls, these frameworks play a vital role in ensuring the confidentiality, integrity, and availability of data. Data governance frameworks act as a protective shield against unauthorized access, misuse, and breaches of sensitive information. They establish data quality standards, significantly reducing the likelihood of privacy breaches and security incidents. Additionally, data governance frameworks are specifically designed to comply with relevant data protection laws, such as the General Data Protection Regulation (GDPR) and the California Consumer Privacy Act (CCPA). They facilitate compliance by implementing privacy policies, consent management mechanisms, and processes to manage data subject rights. By adhering to these legal obligations regarding data privacy, organizations can establish trust with their customers and stakeholders.
8. Example of Successful Data Trilogy Implementation
- In the finance sector, the data trilogy can help banks make informed decisions, predict customer behavior, and generate revenue. For example, a large multinational bank that operates in multiple countries and offers a wide range of financial services, including retail banking, investment banking, and wealth management might maintain a data warehouse that integrates data from customer transactions, account activities, credit histories, market data, and external sources like economic indicators and social media sentiment. The bank invests in a strong data infrastructure and ensures the data warehouse collects, integrates, and stores data in a standardized, accessible, and secure manner. Skilled data analysts, statisticians, and data scientists are employed to train accurate predictive models and uncover actionable insights. The bank also identifies specific use cases where the application of business intelligence and predictive analytics can provide the most significant value.Using business intelligence tools, the bank leverages its data warehouse to gain insights into customer behavior, market trends, and operational performance. Dashboards and reports are created to monitor key metrics such as customer acquisition, account balances, loan portfolios, and revenue streams. These visualizations enable executives and managers to assess the bank's performance and identify areas for improvement.The bank develops models that use predictive analytics to anticipate customer churn, identify potentially fraudulent activities, and assess creditworthiness. For instance, by analyzing historical customer data and transaction patterns, the bank can identify customers who are likely to close their accounts and can then take proactive measures to retain them. Similarly, predictive models help the bank detect suspicious transactions in real-time, preventing financial losses and protecting customers from fraudulent activities. Credit risk models are used to assess the creditworthiness of loan applicants, enabling the bank to make informed lending decisions while managing risk exposure.Data monetization plays a significant role in generating revenue for the bank. By analyzing its vast dataset, the bank gains valuable insights into customer preferences, investment patterns, and market trends. These insights are packaged and offered to institutional investors, hedge funds, and other financial entities as market research reports or investment recommendations. The bank may also leverage its data to develop innovative financial products, such as personalized investment portfolios or customized insurance plans, creating additional revenue streams.
9. Conclusions
- Business intelligence, predictive analytics, and data monetization are performing increased roles in business operations. Each of these technologies depends heavily on the data warehouse. By bringing together data from disparate sources and transforming it into a common format, a data warehouse enables organizations to gain a holistic view of their operations, customers, and markets, and supports business intelligence activities such as reporting, querying, and analysis. A data warehouse is an essential component of predictive analytics because it provides a unified and consistent view of historical data that can be used to train machine learning models and make predictions about future outcomes. The centralized repository of data that a data warehouse provides can be easily accessed and analyzed to identify patterns and insights which then are used to create new products and services, improve existing offerings, or generate new revenue streams. By investing in a robust data warehousing solution, organizations gain a competitive advantage by leveraging data to drive better decision-making, improve operational efficiency, and generate new revenue opportunities.