-
Paper Information
- Paper Submission
-
Journal Information
- About This Journal
- Editorial Board
- Current Issue
- Archive
- Author Guidelines
- Contact Us
American Journal of Computer Architecture
2020; 7(1): 9-15
doi:10.5923/j.ajca.20200701.03
Received: Sep. 3, 2020; Accepted: Sep. 15, 2020; Published: Sep. 26, 2020

Solution Architecture for Distribution System Planning (DSP)
 Abstract
 Reference
 Full-Text PDF
 Full-text HTML
Vidyod Kumar M.
Correspondence to: Vidyod Kumar M. , .
| Email: |  |
Copyright © 2020 The Author(s). Published by Scientific & Academic Publishing.
This work is licensed under the Creative Commons Attribution International License (CC BY).
http://creativecommons.org/licenses/by/4.0/

The purpose of this paper is to illustrate the solution architecture for modernizing the Distribution System Planning process. The solution architecture comprises of analytical and transactional applications integrated using a standard information model based on IEC CIM profiles.
Keywords: DSP, IEC CIM, CPUC, SCIM, TOGAF®
Cite this paper: Vidyod Kumar M. , Solution Architecture for Distribution System Planning (DSP), American Journal of Computer Architecture, Vol. 7 No. 1, 2020, pp. 9-15. doi: 10.5923/j.ajca.20200701.03.
Article Outline
- California utilities invest billions of dollars per year in replacing and modernizing their electricity distribution infrastructure. The electricity system continues to evolve, and with the growing deployment of distributed energy resources (DER), changes are required to how utilities conduct distribution system planning. The integration of DER in Planning for the electrical grid is providing a lot of exciting challenges and opportunities.
1. The Business Need
- In California, utilities are mandated to routinely file distribution investment plans. These plans make transparent the methods used and generally provide visibility into the existing state of the systems and utility planning processes. The California Public Utility Commission (CPUC) also requires investor-owned utilities (IOUs) to file Distributed Resource Plans (DRPs). The CPUC order requires utilities to consider locational benefits and costs of DERs on the distribution system and to identify tariffs and other mechanisms to deploy cost-effective DERs. Furthermore, utilities are expected to coordinate with other state DER incentive programs, articulate additional utility spending needed to integrate cost-effective DERs, and identify barriers to the deployment of DERs [1,2].The modernization of the Distribution System Planning process requires the development of new tools and methods capable of transforming the distribution grid to manage both the challenges and opportunities associated with the requirements. Modern applications need to be introduced in the ecosystem to understand and make decisions as the grid complexity rises with higher DER penetration. Applications that are capable of leveraging various data sets, such as SCADA and advanced metering infrastructure, are playing a more significant role in the planning process. In the past, the Utility distribution planning process was based on the annual peak load for every asset (A-bank transformers, substations, and circuits) in its system. While the method did disaggregate the peak hour into its various sources of load-based consumption, DERs, and load-growth projects (LGPs), the timing of the peak was assumed to be consistent year over year. Besides being labor-intensive, the output of this method was insufficient to meet the various regulatory needs. The new approach is highly automated; using time series data, it allows distribution engineers to determine the frequency of events that exceed upper or lower operating thresholds, duration of these violations, identify peak shifting, and understand annual requirements in addition to the peak load. At the end of the process, mitigation to the circuit model, along with capital deferral opportunities (capital projects) have been identified. [3]
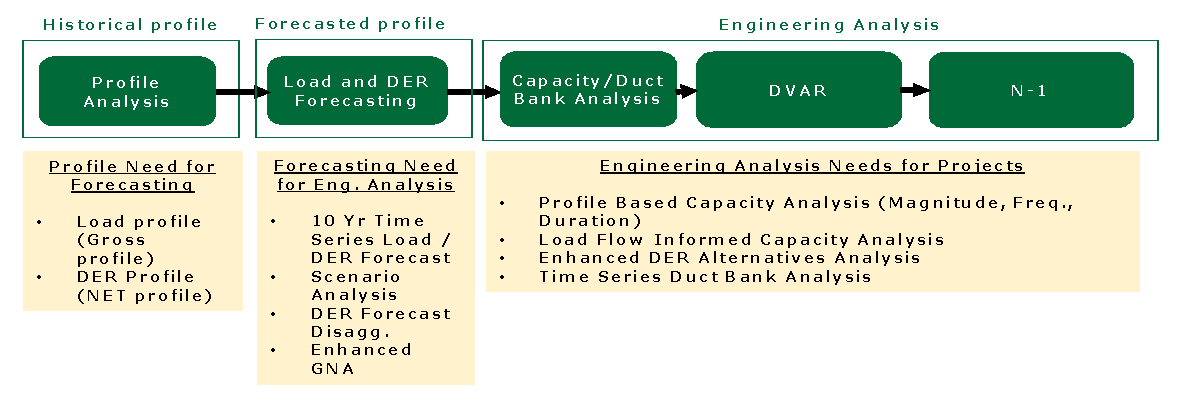 | Figure 1. High level process steps for Distribution System Planning (DSP) |
2. The Data Challenges
- Moving from an annual peak analysis to time series-based analysis requires the ability to handle complex data sets (volume, velocity, variety).As illustrated in Figure 2, there is a need to integrate a wide variety of data from different sources. Take the example of historical load and DER profile, which requires the integration of time-series data, SCADA, AMI, DER generation along with master data, electrical connectivity, hierarchy, customer master information, and DER Interconnection. The amount of time required to prepare the data for a given use case is directly dependent on the health of the data. For example, the various types of data necessary for the analysis include asset data from asset management systems, network connectivity data from GIS/EMS systems, or SCADA information, all of which are stored multiple systems and in a variety of sizes and formats.
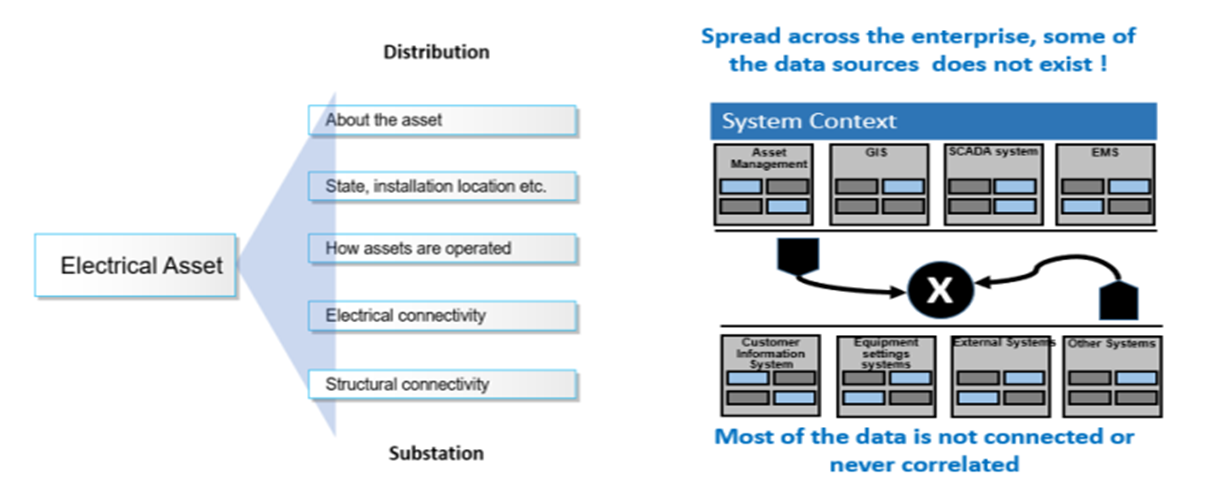 | Figure 2. Asset and Connectivity information is maintained in multiple systems |
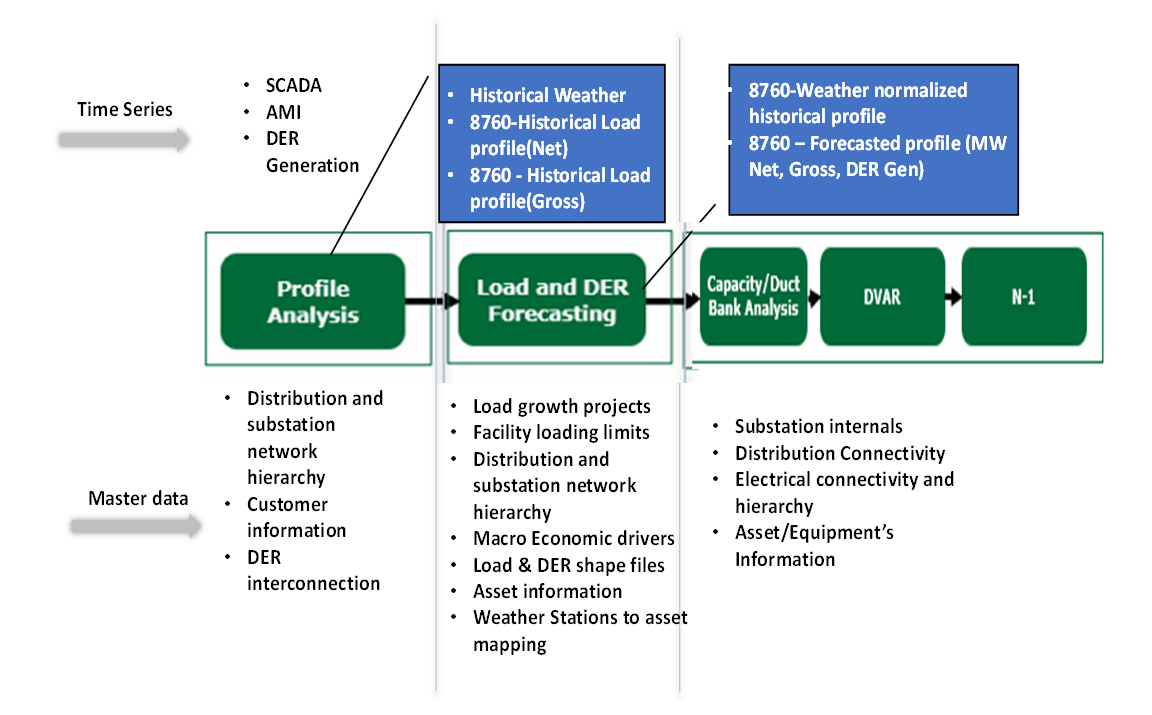 | Figure 3. Data mapping |
3. Architecture Definition
- Developing IT systems to support the DSP process, therefore, requires a comprehensive plan that creates a framework for developing or procuring applications that work together to implement the overall system. Following a systematic architectural approach facilitates defining components or building blocks that make up the whole information system. This well-defined architecture thereby provides a strategic context for the IT systems in alignment with the specified business requirements.Adopting architecture framework like TOGAF ®, the Open Group Architectural Framework, can help to speed up and simplify architecture development along with making sure that there is comprehensive coverage of the designed solution. TOGAF has proven methodologies to architect and design a technically sophisticated design of a complex system of systems. Additionally, the use of this method can help to connect business, and IT teams towards achieving a common goal. [6] One of the critical concepts of the TOGAF framework is the ability to decompose business capabilities and functions/services as part of the Business Architecture definition. For example, as illustrated in Figure 4, the business functions/services mentioned in Figure 1 are grouped under the "Analytical Capabilities." Individual features are further decomposed into smaller tasks, along with participating user rules and interaction between functions to meet the defined capability.
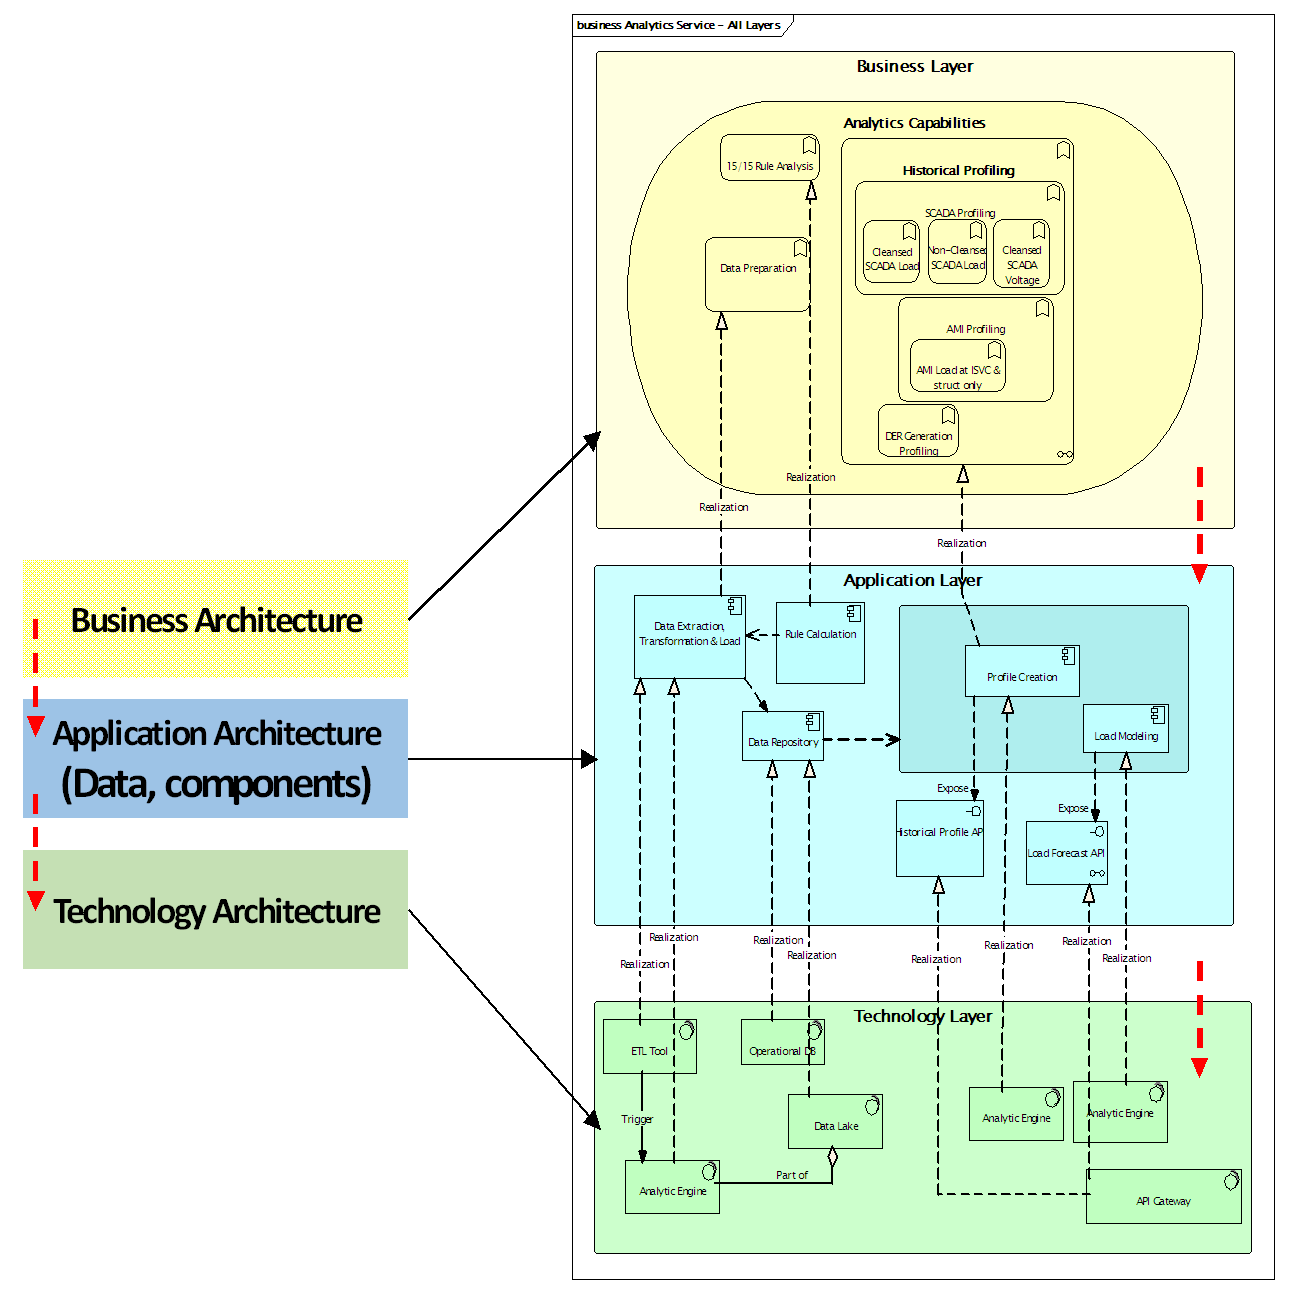 | Figure 4. TOGAF Representation of Analytical Capabilities (shown using ArchiMate Notation) |
4. Architecture Development
- Following the well-defined architecture definition process will result in establishing a system architecture capable of addressing the processes and outcomes identified in the business goal. Figure 5 illustrates the high-level application architecture to support the afore-described distribution system planning process. The business functions and capabilities identified during the business architecture process are assigned to individual applications to illustrate the disposition. At a high level, participating systems can be grouped into two categories: (1) enabling systems (Connectivity Information System, DER Intake System) – responsible for providing the required data for (2) the core systems (Analytical platform, Engineering Analysis Tool) - responsible for implementing the identified business processes. These participating systems are described in the remainder of this section.
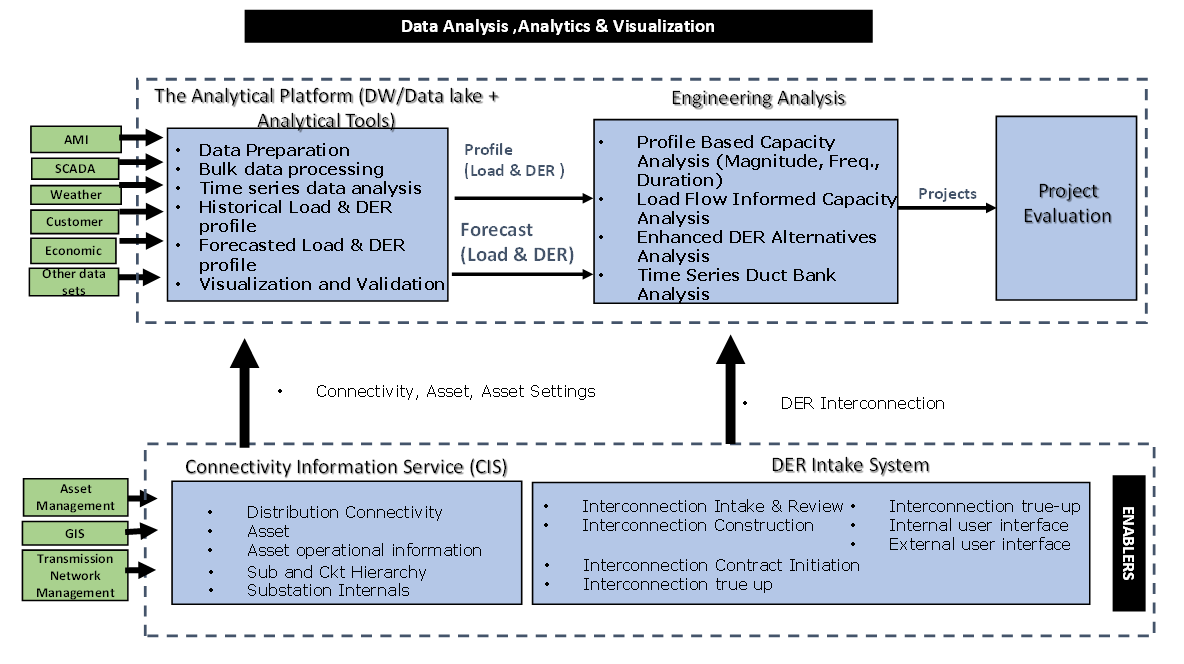 | Figure 5. High-level Application landscape |
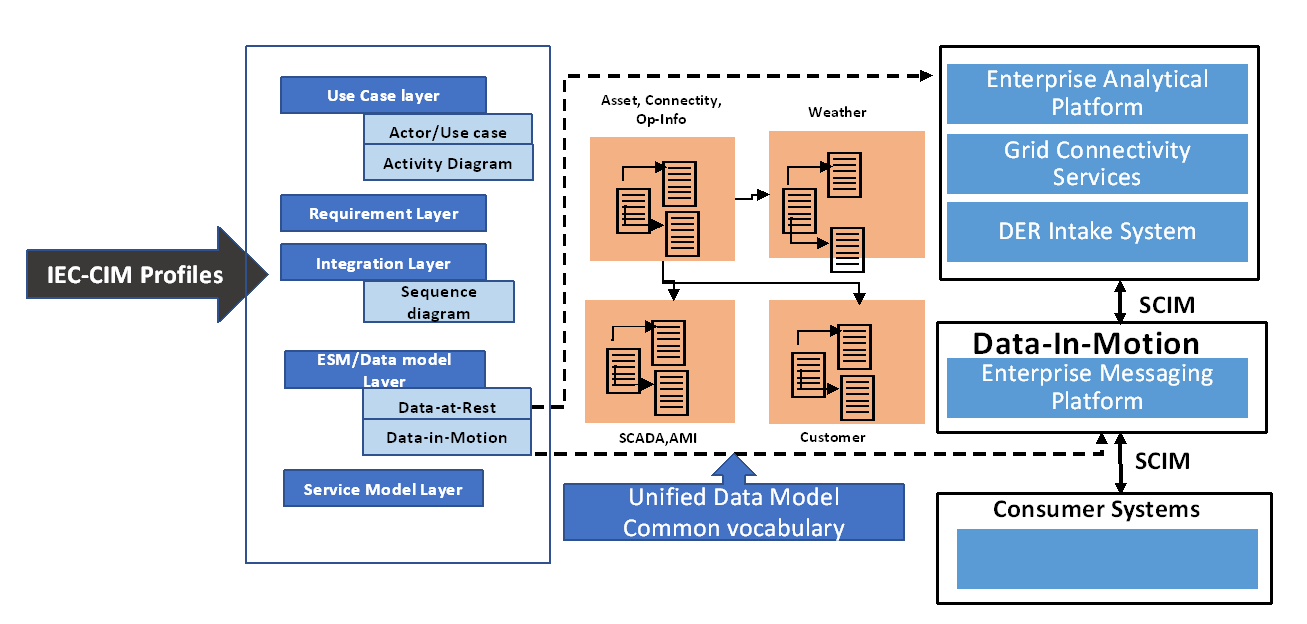
5. Model Driven – A Common Vocabulary
- Consistent system development, integration, and analysis require an effective information management strategy. It is vital to model and prepare the data by logically correlating and organizing before it is used for processing. Utilities can adopt the industry-standard IEC Common Information Model (IEC CIM) as a foundation for its enterprise semantic model. [7] However, rather than being limited by what is available in the standard, approach should be to use the CIM as a foundational model and extends it to cover the enterprise information needs.To illustrate this concept further, take the example Connectivity Information System (CIS) system design. CIS is developed as system of truth for grid connectivity information, integrating data from GIS, asset management, EMS, and other operational applications. All illustrated in Figure 6, the CIM extended model is used for storing (data-at-rest) the asset, connectivity, and other related information in the CIS database. The same enterprise semantic model is used as an exchange model (data-in-motion) for application data change using the APIs.
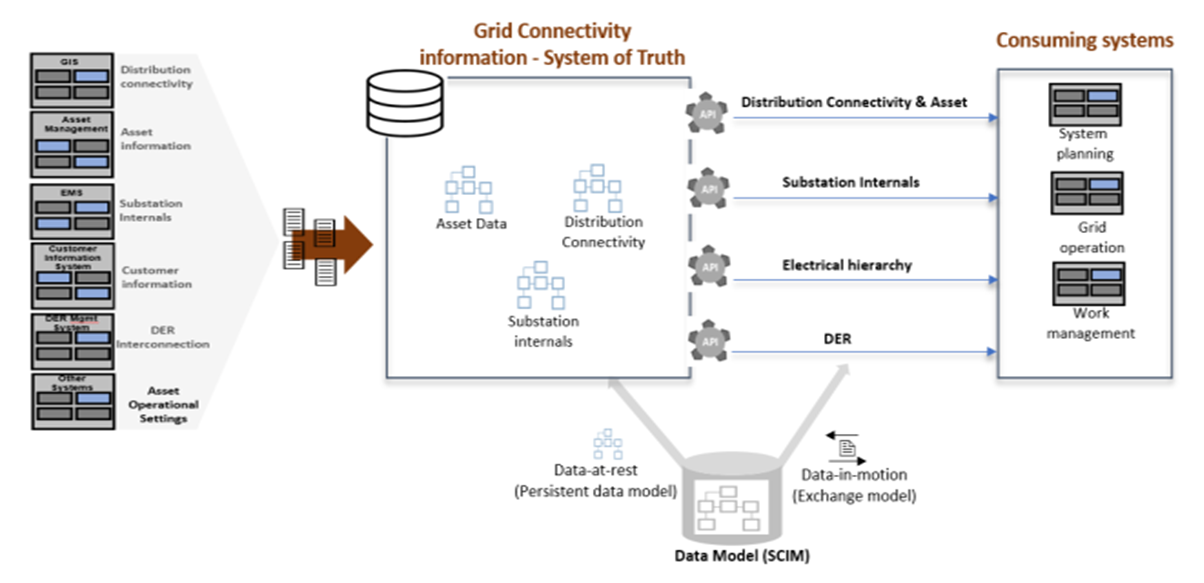 | Figure 6. Connectivity Information Service -CIM extended used data-at-rest & data-in-motion |
 | Figure 7. Top-down Modeling Approach |
6. Conclusions
- A clear vision, goals, objectives along with thorough architecture and system design process is vital for modernizing the distribution system planning. The business processes adopted in the past will not work; hence it is crucial to enable information systems to support the new business processes which are capable of allowing customer choices. "A modern grid achieves safety and reliability of the grid through technology innovation to the extent that it is cost-effective to ratepayers relative to other legacy investments of a less modern character" [1,2].