-
Paper Information
- Paper Submission
-
Journal Information
- About This Journal
- Editorial Board
- Current Issue
- Archive
- Author Guidelines
- Contact Us
American Journal of Computer Architecture
2018; 5(1): 1-19
doi:10.5923/j.ajca.20180501.01

The Influence of Socio-Economic Characteristics on Satisfaction in Selected Universities Students’ Hostels in Southwestern, Nigeria
 Abstract
 Reference
 Full-Text PDF
 Full-text HTML
Akinluyi Muyiwa Lawrence1, Adeleye Olugbenga Oluwatoyin1, Awe Folusho Charles2
1Department of Architecture, Joseph Ayo Babalola University (JABU), Ikeji-Arakeji, Nigeria
2Physical Planning Department, Ekiti State University, Ado-Ekiti, Nigeria
Correspondence to: Akinluyi Muyiwa Lawrence, Department of Architecture, Joseph Ayo Babalola University (JABU), Ikeji-Arakeji, Nigeria.
| Email: |  |
Copyright © 2018 The Author(s). Published by Scientific & Academic Publishing.
This work is licensed under the Creative Commons Attribution International License (CC BY).
http://creativecommons.org/licenses/by/4.0/

Thestudy examined the Impact of socio-economic characteristics of the users in the halls of residences of the selected Universities in southwestern Nigerian. This was with a view to providing policy interventions on socio-economic characteristics of students on housing satisfaction in southwestern Nigerian Universities. Primary data were obtained through survey method. Two Universities Obafemi Awolowo University (O.A.U) and University of Ibadan (UI) were purposively selected from the Universities in Southwestern Nigeria. Five and eight hostels at O.A.U and UI respectively were purposively selected to capture variation in gender, level of study and hostel design across the Universities. The sampling frame showed that 5,038 students at O.A.U were found in 1,078 rooms while 5605 students at UI were found in 2,147 rooms. One out of every five (20%) and one out of every 10 (10%) of the rooms were selected at O.A.U and UI respectively which amounted to 215 students sampled from each of O.A.U and UI. The results from the frequency distribution revealed that all respondents of the hotels were satisfied with various services and Amenities provided in the Halls of Residence generally (37.7%). The results from the regression analysis showed that, gender (92.874), number of person per room (74.607), age (61.256), marital status (84.750) means of sponsorship (82.41) were significant generally across the Universities at 0.05Level. At UI, gender of respondents (76.391), monthly income (79.184), means of sponsorship (52.51), number of occupants in the room (81.305), hostel floor level (55.435) were significant at 0.05 level. At O.A.U, gender of respondents (80.761), age (61.256), marital status (64.210), monthly income (59.813), means of sponsorship (68.242), number of occupants in the room (67.135), design (41.802) were significant at 0.05 level. The study concluded that, socio-economic characteristics had significant influence on satisfaction in student’s hostels in southwestern Nigeria.
Keywords: Socio-Economic Characteristics, Satisfaction, Students’ Hostel, Southwestern Universities
Cite this paper: Akinluyi Muyiwa Lawrence, Adeleye Olugbenga Oluwatoyin, Awe Folusho Charles, The Influence of Socio-Economic Characteristics on Satisfaction in Selected Universities Students’ Hostels in Southwestern, Nigeria, American Journal of Computer Architecture, Vol. 5 No. 1, 2018, pp. 1-19. doi: 10.5923/j.ajca.20180501.01.
Article Outline
1. Introduction
- Socio-economic characteristics of the users are one of the most important factors in the study of Residential Satisfaction. It should be noted that people of different Socio-Economic Backgrounds will have different responses towards the use of space. Socio-economic status of residents has been demonstrated to have an impact on subjective evaluation [6]. Due to differences in expectations, it is also expected that residents of higher Socio-Economic Status may apply a higher standard of evaluation in their assessment of their neighborhood. However, it can also be expected that their aspirations be relatively higher [6]. Demographic characteristics of an individual which include sender, income status, duration of stay, sense of sharing, relationship with friends and individual’s home experience are important and cannot be ignored.In recent times, Students’ Hostel has become a type of housing with peculiar characteristics which are different from single-family house and apartment for single persons. Students’ Housing is important because it provides sleeping and living quarters, with or without private baths, for a large number of people. This type of Housing is also furnished and rents are paid [32]. described Students’ Hostel as a building that provides lodging and gives students an option to stay on-campus. The setting of Students’ Hostel is usually the campus environment rather than the urban setting; the residences therefore constitute a peculiar type of housing with a special user group which needs to be evaluated. This is more so because of the integral and important role which Students’ Housing plays in the overall development of the students. Students’ Housing also requires a large expanse of land and thus it is important in Campus Planning. In order to enhance the quality of Students Hostel, the facilities need to be evaluated and the most common approach used in evaluating Students’ Housing is the Residential Satisfaction which is the approach used in this study.Residential Satisfaction not only evaluates the quality of residential environment by measuring the satisfaction level of individuals’ residential environment and its value, it is also a valid method used to evaluate building including students housing. This would improve the quality of residential environment. Residential Satisfaction is a form of evaluation which accounts for building quality and is essential when organisations are required to demonstrate that building programmes are being responsibly managed. This study, however, examines the influence of socio-economic characteristics on residential satisfaction in students’ housing with a view to providing policy interventions on socio-economic students housing satisfaction in southwestern Nigerian Universities.
2. Related Literature Review
2.1. The Socio-Economic Characteristics of the Students
- [23], argued and supported the fact that physical attributes of the house does not only depend on physical attributes alone as the main determinant of students residential satisfaction. There are also some other potential factors such as social attributes which can be identified as the influential sources in determining the overall students’ residential satisfaction and are the demographic characteristics of an individual. The students’ socio-economic characteristics considered for this study are: gender, age, marital status, level of study, means of sponsorship, duration of staying, experience of boarding house, monthly income, faculty to which students belong to, accommodation fees and preferred cost for the accommodation. These characteristics were identified through the data obtained from the structured questionnaire used. However, it is necessary to look at the various factors predicting student housing residential satisfaction; most of these factors are socio-economic factors.
2.2. Factors Influencing/Predicting Student Housing Residential Satisfaction
- Researchers have shown that, there are different factors that contribute to Student’s Satisfaction with the residence halls experience: namely the Physical environment or Physical features such as Amenities, Noise and Temperature. Air quality has also powerfully influenced the overall Students’ Housing Satisfaction [29]. Overcrowding is “the number of people per structure”, [28], and it is another physical factor that has been shown to negatively impact Students’ Housing Satisfaction with the residential environment. [1], found out that student’s perceptions of residence hall environment were more, when the organizational elements of the residence halls, the group living situations, the social activities and the academic environments were highly rated as some of the factors predicting Students Housing Residential Satisfaction [1]. Also, studies of [20], found out that, the Students’ Housing Satisfaction were linked to the demographic background of residences, such as gender-role, family income, age, education. In Saudi Arabia, [13], found out that the degree of satisfaction in terms of both technical performance (i.e., thermal comfort) and functional performance (i.e room layout and furniture quality) have a great influence on sustainable students’ Housing Facilities. Among the studies that investigated the influence of physical attributes of campus accommodation on Students’ Satisfaction is [15] research on Students’ Housing setting at Bilkent University, Ankara. The study found out that, the students living on the highest floor perceived their rooms larger and found them less crowded in comparison to those on the lowest floor. The study postulated that students’ perception of their privacy led to an increase in the level of students’ satisfaction with their living condition. Privacy, feeling of crowding and control over space have also been the focus in a variety of studies in Students’ Housing as an important predicting factor of satisfaction such as [31]. These studies found out that the physical factors of the ‘built environment’ affect the people’s perception of privacy and crowding. Similarly, the study of [14] posited that hostel room size can indeed influence students’ level of satisfaction. For instance, their study found that students who lived in triple sharing rooms were less satisfied and unhappier with their living conditions than students residing in double sharing rooms. In the study conducted by [19] to investigate the most factors predicting Students’ Satisfaction with University Hostels in Malaysia, the result of the study suggests that Satisfaction with Fees, Distance from University Facilities, Room Safety, Room Size, Hostel Security, and Hostel Facilities are the most important factors which predict undergraduate Students’ Satisfaction with their Hostel. This study also reveals that there was also a significant difference in the satisfaction level between inside and outside students’ hostels. It also confirmed that most important factors that influenced Students’ Satisfaction levels were distance from the university facilities, the exterior condition of the Hostel, Hostel population and Satisfaction with transport, Hostel Security, Room Size, and Room Safety. The authors concluded that the understanding of Factors Predicting Students’ Satisfaction can assist universities to undertake changes to increase satisfaction among them [19]. Most of the previous scholars have argued and tended to concentrate on the physical attributes of Students’ Housing as the main determinant of student residential satisfaction. Therefore, the overall student residential satisfaction does not only depend on physical attributes alone but other potential factors. Social attributes can be identified as the influential sources in determining the overall student housing residential satisfaction. A few studies declared that variability of students’ social attributes, for instance, gender, economic status, duration of staying, sense of sharing, ethnicity, relationship with friends, and individual’s home experience are also important and should not be ignored [19]. Also, some studies have classified the factors influencing residential satisfaction as: personal influences such as age/stage of life, socio-economic status, sex and social role, personality and values, comparisons and dream of the future. Another classification is the physical influences such as housing form, architectural style, interior, outdoor areas. The third classification is the social influences such as neighbour, norms, preference of others, privacy, security and social interaction. The fourth classification is the cultural influence. At this level, it is also important to look at the various schools of thought by many authors to describe students housing in the housing environment.
2.3. The Concept of Residential Satisfaction
- Residential satisfaction is an interdisciplinary perspective on residential environment and a multifaceted subject that has traditionally received much attention in the academic community, as well as in the public and private sectors, although this attention is not surprising because housing involves issues of human, social, economic and political importance [5]. [9], defined Residential Satisfaction as a multiple- dimensional concept, best measured through lists of items, rather than a single- item indicator of residents general satisfaction with the house, the neighbourhood or the city. [12], defined Satisfaction as the perceived gap between a respondent’s residential needs and aspiration and the quality of the current Residential context. That is, individuals evaluate their homes not only by their actual condition but also according to their desires for the future. The authors explained further that the construct of Residential Satisfaction can be conceived as a complex multi-dimensional, global appraisal, combining affective and cognitive facets, thus fulfilling the criteria for defining it as an attitude. [9] and [2]. refers to the Concept of Residential Satisfaction as variables predicting other relevant urban behaviour, such as residential mobility or residential choice. [10], similarly defined Residential Satisfaction as a function of three different categories of variables: The objective characteristics of the residents (e.g., age, sex), the objective characteristics of housing environment (e.g, dwelling size), and the residents’ perceptions. [20], now presented a conceptual model that help to explain the relationships between objective environmental attribute, perceptions and assessments of these attributes (subjective experiences), environmental satisfaction, and behaviour. A well-known conceptual definition of Residential Satisfaction is offered by [17], who interpreted satisfaction as a reflection of the degree to which people feel the residential environment is helping them to achieve their goals. [11], who initially tried to establish the concepts of Residential Satisfaction asserted that the residents’ satisfaction is more appropriate than the characteristic of construction to evaluate the housing quality among various residential concepts [26].
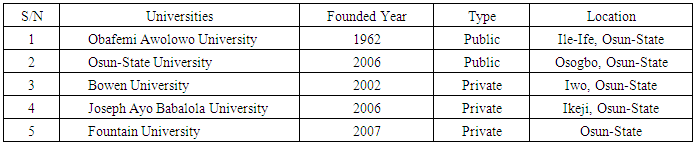
2.4. Study Area
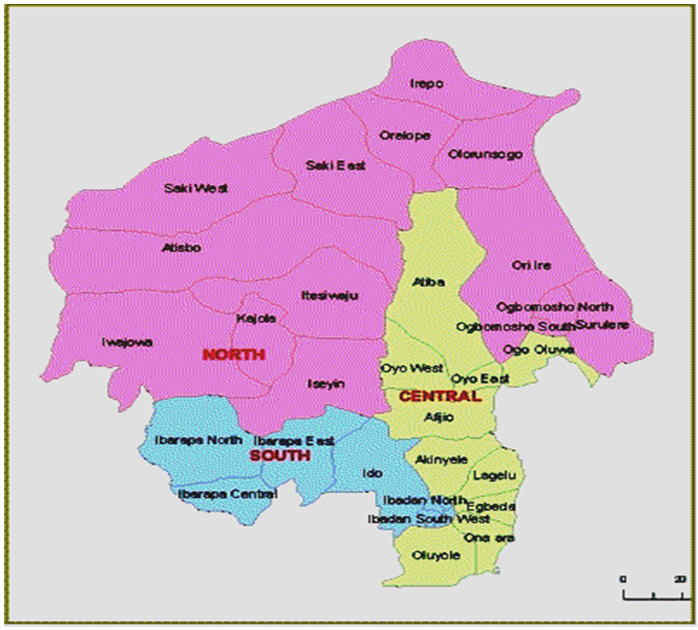
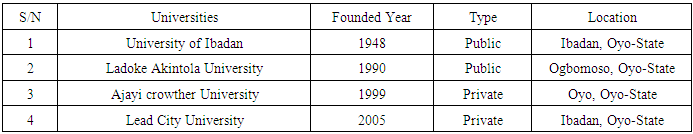
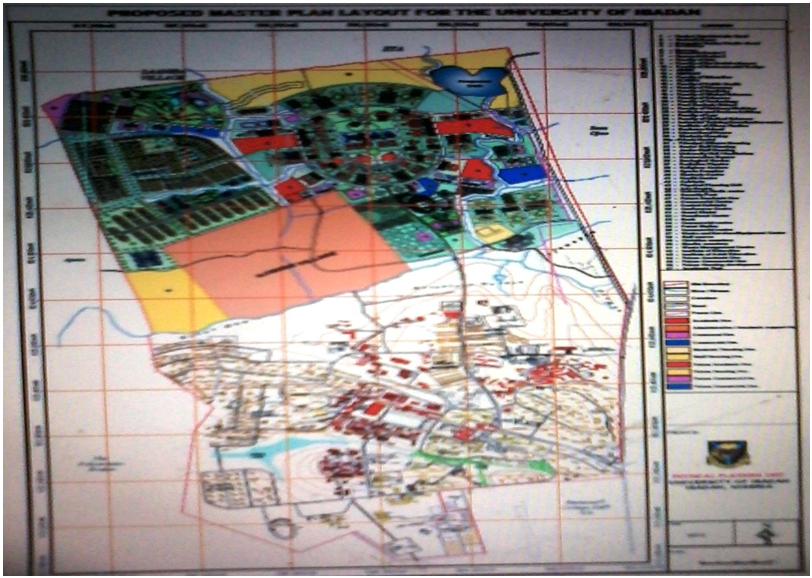
- The southwestern parts of Nigeria consists of Oyo, Osun, Ekiti, Ogun and Lagos states as indicated in figure 2.0. The south-western, Nigeria consist of private and public Universities, Polytechnics and Colleges of education. For the purpose of this study, Osun-State and Oyo-State are the study states selected in southwestern, Nigeria. Osun-state is located in the southwestern part of Nigeria. It covers an area of approximately 14,875 square kilometers, lies between latitude 7° 30 0’’N and longitude 4° 30 0 E and is bounded by Ogun, Kwara, Oyo and Ondo-State in the south, north, and east respectively, its area covered is represented in the figure 2.1. Educationally, Osun-state consists of private and public Universities which are listed in the table 2.0. One of the major towns present in Osun-State is Ile-Ife which is the study town for the study, is an ancient town established by Oduduwa regarded as the father of Yoruba race. Ile-Ife is believed to have emerged as the first highly centralized polity in Yorubaland, it is the holy city of the Yoruba people and believed to have been discovered about 500BC. Ile-Ife is located on the longitude 4.6°E and latitude 7.5°N which is within the hot humid tropical zone. It has an annual means temperature of 26°C. It is situated on an elevation of about 275 meters above the sea level. The king is called the Ooni or Onile (that is the one who owns the land). Its area covered is represented in the figure 2.2. The establishment of three Universities in Nigeria between 1961 and 1962 evolved the so called University of Ife in 1962 and in February 1988, the name of the University was changed from “University of Ife” to “Obafemi Awolowo University” (O.A.U) in honour of the Late Chief Obafemi Awolowo, one of the founding fathers of the University. O.A.U, Ile –Ife is about 80 kilometres northeast of Ibadan. It is in Osun State. Obafemi Awolowo University, Ile-Ife is located on the longitude 4.622°E and latitude 7.5182°N which is within the hot humid tropical zone. The student enrollment is about 35000 for both undergraduates and post graduate students. Map to describe O.A.U is represented in the figure 2.3. The major halls of undergraduate residences for males are Fajuyi, Awolowo, Angola and E.T.F. For women, halls of residence are Moremi, Ladoke Akintola, Alumni and Mozambique. Muritala Muhammed Hall is for postgraduate students. These halls of residence had common characteristics. About 50% of the hostels are low-rise two-storey buildings such as Fajuyi, Awolowo, Muritala Muhammed, Moremi, and Ladoke Akintola halls of residence. Twenty percent of the halls of residence are bungalow building such as Mozambique, E.T.F and Angola halls of residence while just 10% is one story building such as Alumni Hall. All the halls except one (Muritala Muhammed) are single-sex halls. In all, there were four female halls, four male halls, and one mixed-sex hall. The halls of residence provide shared facilities such as bedrooms, which are the most private space and are shared by four persons (Fajuyi Annex, Awolowo Annex E.T.F, Moremi); some are six (Fajuyi, Awolowo, Alumni), some are twelve (Angola halls & Mozambique hall) and some are three and one person per room (Muritala Muhammed). Sometimes the halls are provided with balconies or a back terrace as additional facility, the second was the “floor” which comprised bedrooms and their accesses. The floor was less private. Facilities shared at this level included bathrooms, kitchenettes, buttery, drainage system access road, walkways waste disposal method and the corridor access.
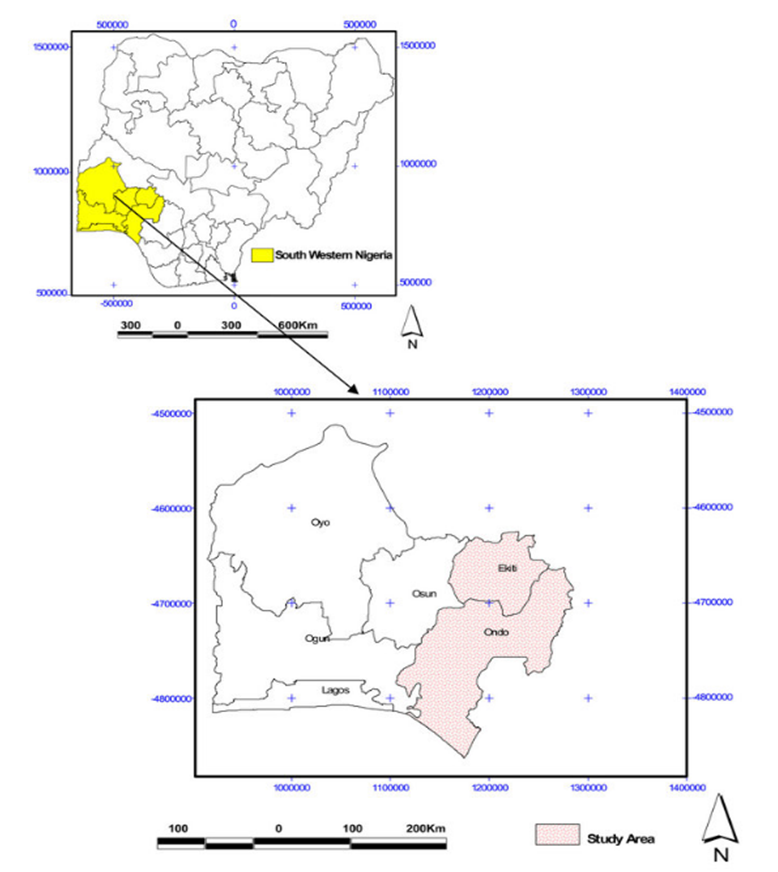 | Figure 2.0. Map of South-Western, Nigeria |
|
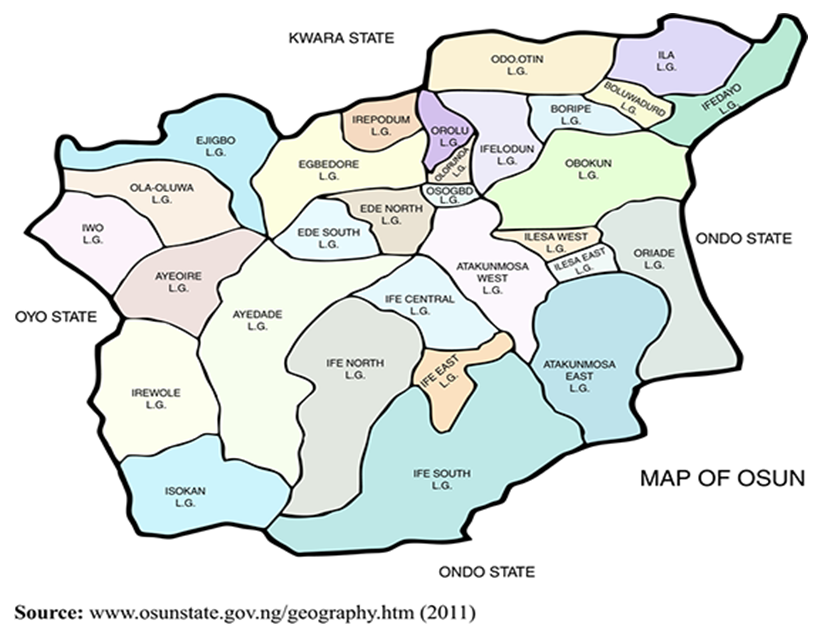 | Figure 2.1. Map of Osun-State, Nigeria |
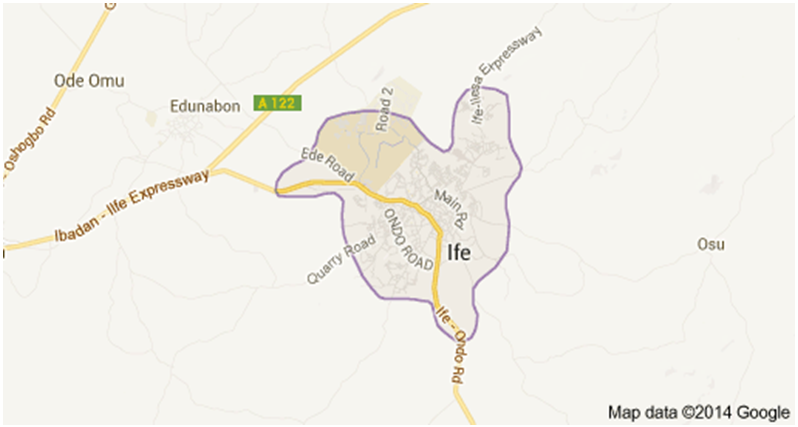 | Figure 2.2. Map of Ile-Ife, Nigeria |
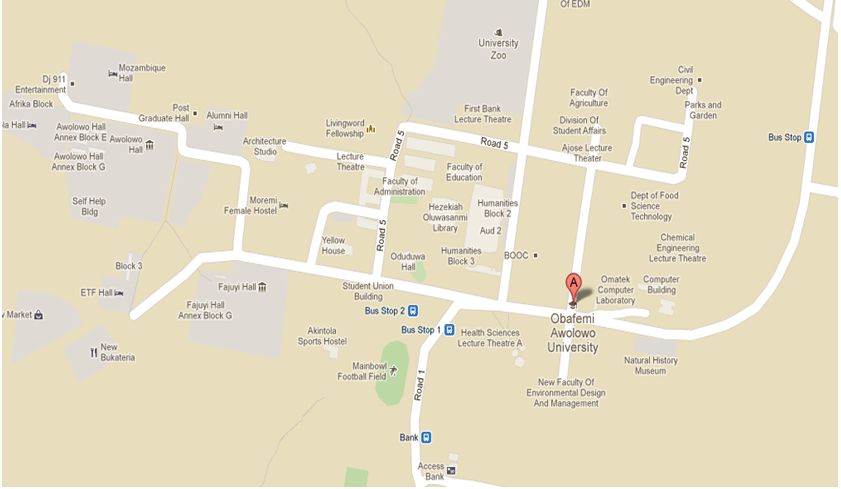 | Figure 2.3. Master Plan of O.A.U Ife |
 | Figure 2.4. Map of Oyo-State, Nigeria |
|
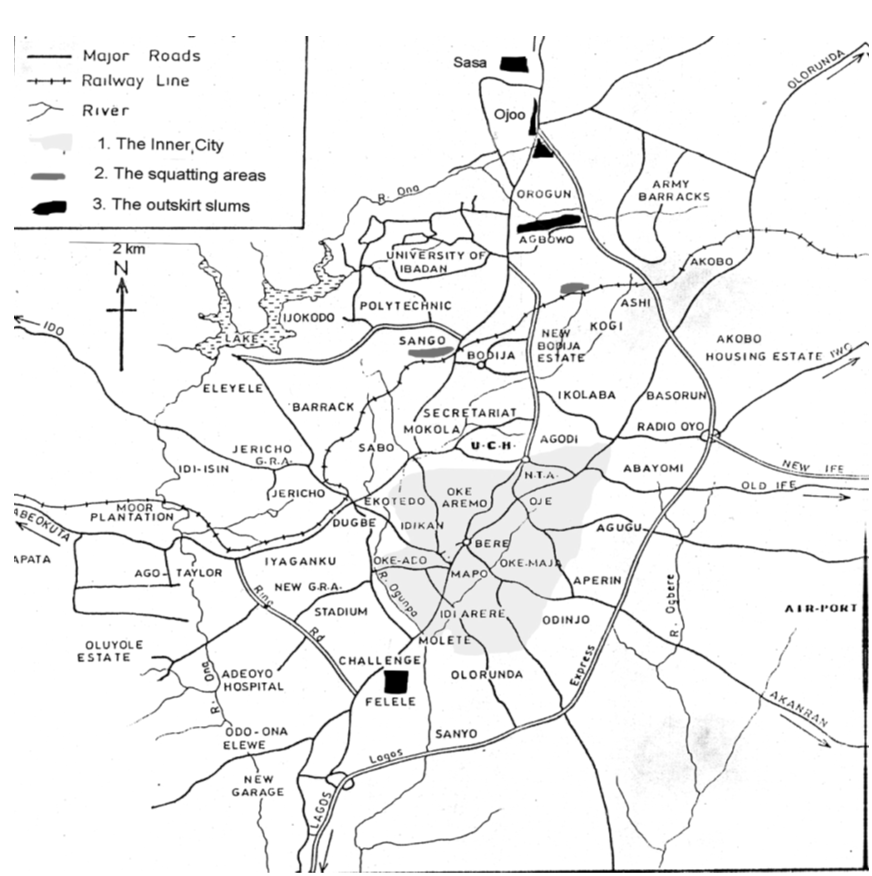 | Figure 2.5. Map of Ibadan, Nigeria |
 | Figure 2.6. Map of University of Ibadan, Nigeria |
3. Reseash Methodology
- A quantitative data collection technique, namely ‘survey method’ was appropriate. A Structured Questionnaire on Students’ Housing Environment was designed to cover paramount issues related to the research. Secondary Method of Data Collection was needed for the purpose of documenting the number of rooms per floor, number of block per hostel and the number of Students per hostel. Through a secondary Method of Data Collection, population of students who reside at present in the Student’s Housing of the two Universities purposively selected from the Universities in Southwestern Nigeria was obtained from the Division of Students Affairs. The total number of Students’ residing in the O.A.U Hostels is Ten thousand seven hundred and fifty two Students (10,752). At the University of Ibadan, the total number of Students residing in UI hostel is Eight Thousand Seven Hundred and Forty Three Students (8,743). The total Study Population identified at the study areas amounts to Nineteen Thousand Four Hundred and Ninety Five Students (19,495). The population within the thirteen (13) Halls of residence selected in the Two (2) Universities constitutes the Sampling frame for the Study. What constituted the sample frame are 5,038 students at O.A.U and 5,605 students at UI which amounts to the total population of Ten Thousand Six Hundred and Forty Three (10,643) which amounts to the total population of Ten Thousand Six Hundred and Forty Three (10,643). The 5,038 students at O.A.U resided in 1,078 rooms while 5,605 students at UI occupied 2,147 rooms. One out of every five (20%) and one out of every 10 (10%) of the rooms were selected at O.A.U and UI respectively. Using above method, 215 students were sampled in each of the universities. In all, a total number of four hundred and thirty (430) students were selected. Purposive Sampling Method was used to select two Universities from the Universities in Southwestern Nigeria. The selection of these two universities in Southwestern Nigeria is based on the hostel management styles, Purpose-Built Hostels and first generation Universities in southwestern Nigeria. UI is managed by private organization whereas O.A.U is managed by the University management. Both are first generation Universities. Five hostels (E.T.F, Fajuyi, Moremi, Alumni, and Muritala Mohammed) at O.A.U and eight hostels (Kuti, Mellanby, Sultan Bello, Queen Elizabeth, Queen Idia, Tafawa Balewa, Abdusalam Abubakar and Awolowo) at UI were purposively selected to capture variation in gender (Male, Female, Mixed gender), level of study (Undergraduate and Postgraduate) and hostel design (Design type A,B,C) across the universities. In these hostels, respondents were sampled using systematic sampling technique.
4. Results and Discussions
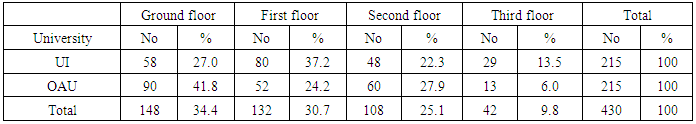
- This study presents the research findings obtained on the socio-economic characteristic of the students who reside in the selected halls of residence across the two Universities (O.A.U, Ile-Ife, Osun State and UI Ibadan, Oyo State) purposively selected for this study in South Western Nigeria. The data and results obtained in each university (O.A.U and UI) were compared to establish the differences in the respondent’s socio-economic characteristic. Respondents were selected from every floor level in female and male housing blocks to determine the floor level to which the student resides. It is important because it predicts the student’s satisfaction with the floor level of their hostels. About 34.4% of all respondents lived on the ground floor, 30.7% lived on first floor, 25.1% lived on the second floor while 9.8% lived on the third floor. About 65% of all respondents lived on either the ground or first floor which has higher satisfactory quotient than higher floors. The result is shown in the table 4.1. About 27.0% of UI respondents selected for the study live in the ground floor of the hostel, 37.2% lived in the first floor, 22.3% lived in the second floor while 13.5% lived in the third floor. For the OAU respondents, 41.8% lived in the ground floor, 24.2% lived in the first floor, 27.9% live in the second floor while 6% lived in the third floor. About 89.1% of UI respondents reported favourable satisfaction about the floor level of their bedrooms against 10.9% that reported otherwise. Among OAU respondents’ students, 79.6% reported favourable satisfaction about floor level of hostel against 20.4% who reported dissatisfaction and majority of this dissatisfaction (three-quarters) comes from those on the third floor. It was therefore concluded that two-floor hostel is much better than hostel with multiple floors.
|
4.1. Gender
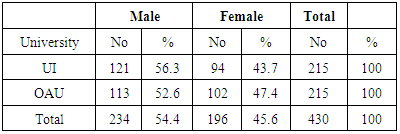
- With regards to the gender of all respondents in this study, 54.4% were males while 45.6% were females. About 56.3% of UI students selected for the survey were males while the remaining 43.7% were females. Among OAU students, 52.6% were males while 47.4% were females. The summary is depicted in the table below. Selection was at random and everyone has equal chance of being selected for this important study. This finding shows that more male students were sampled at UI compared to its counterpart at O.A.U, it is an evidence that male students resides in the on-campus hostels at UI compared to its counterpart at O.A.U. Also finding shows that more female students were sampled at O.A.U compared to her female counterpart at UI. The summary is depicted in the table 4.2.
|
4.2. Age of Respondents
- About 35.6% of all respondents in this study were less than 20 years, 42.1% were between 21 and 25 years, 15.6% were between 26 and 30 years while 6.7% were above 30 years. The mean age of respondents was 24.4 years while the median age was 22.5 years. However, the highest age was 40 years while the youngest respondent was 17 years, thereby giving the range of 23 years for all respondents sampled. About 47.4% of UI students selected for the survey were between 15 and 20 years old, 38.1% were between 21 and 25 years, 11.6% were between 26 and 30 years and the remaining 2.8% were above 30 years. The mean age is 24.1 years while the median is 22.5 years for the UI students. Among OAU students, 23.7% were between 15 and 20 years, 46% were between 21 and 25 years, 19.5% were between 26 and 30 years while 10.7% were above 30 years old. The mean age is 25.2 years while the median is 23.5 years. The summary is tabulated in the Figure 4.1 respectively.
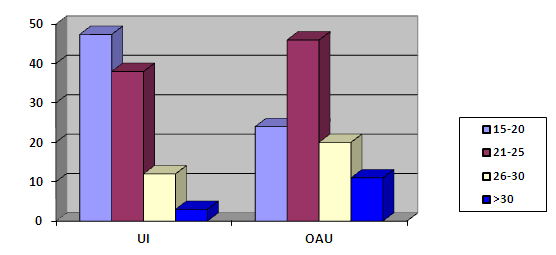 | Figure 4.1. Age of respondents |
4.3. Marital Status of Respondents
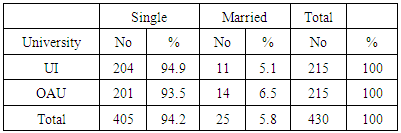
- It is noteworthy that none of the respondents was divorced, separated or widowed as all were either single or married. About 94.2% of all respondents enrolled for the study were single while the remaining 5.8% were married. Numerically and statistically, there is a wide difference between the proportion of respondents who were married and the proportion that were single. About 94.9% of UI students selected for the survey were single while the remaining 5.1% were married. Comparatively, 93.5% OAU respondents were singles while 6.5% were married. These findings show that majority of the students interviewed from UI and O.A.U are not married and it indicates that, there is no clear difference between O.A.U and UI in respondent’s marital status. Table 4.3 shows the summary of the marital status of respondents.
|
4.4. Level of Study
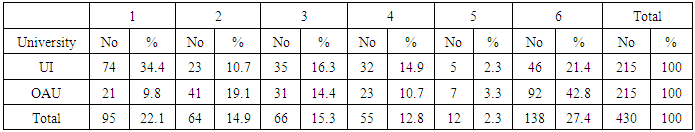
- In summary, about 22.1% of all respondents enrolled for the study were in their first year, 14.9% were in their second year, 15.3% were in their third year 12.8% were in their fourth year, 2.3% were in their fifth year while 27.4% were the postgraduate students.
|
|
4.5. Means of Sponsorship
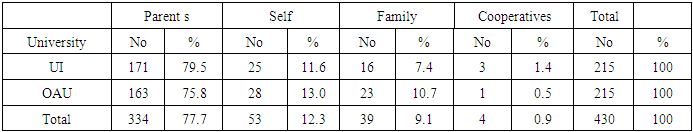
- Summarily, 77.7% of all respondents enrolled for the study were under the sponsorship of their parents, 12.3% were sponsoring themselves, 9.1% were being sponsored by their family members or relatives while less than 1% were being sponsored by cooperatives. Approximately 88% of respondents were sponsored to school which makes the enrolment suitable for good response and result. This important socio-economic question aims to know the financial status of each of the respondents which is more likely to determine his/her taste. With regards to sponsorship or who is responsible for the respondents’ schooling expenses, about 79.5% of UI respondents for the survey were being sponsored by their parents, 11.6% were sponsoring themselves, 7.4% were being sponsored by their family while 1.4% was being sponsored by cooperatives. Among OAU respondents, 75.8% of selected students were being sponsored by their parents, 13% were sponsoring themselves, 10.7% were being sponsored by their family while less than 1% was being sponsored by cooperatives. This finding is evidence that majority of the students who resides on campus purposely built hostels in both UI and O.A.U are being sponsored by their parents. Hence, there is no clear difference between the students’ means of sponsorship at O.A.U and UI. The summary is depicted in the table 4.5. Means of sponsorship have been identified as one of the Socio-economic status of residents, which have been demonstrated to have an impact on subjective evaluation, due to differences in expectations [6].
4.6. Experience of Boarding House
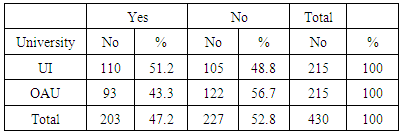
- In summary, 47.2% of all respondents enrolled for the study have never lived in a boarding house while 52.8% have done so. When asked if respondents ever lived in the boarding house before, 51.2% of UI respondents responded in the affirmative while 48.8% responded in the negative compared to 43.3% and 56.7% of OAU respondents who responded in the affirmative and negative respectively. The result is depicted in the table 4.6.
|
4.7. Monthly Income
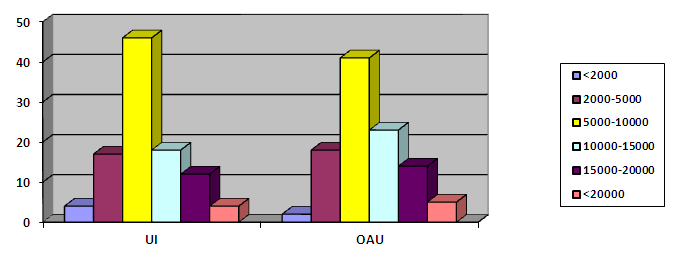
- Respondents were asked the average amount of money they have as pocket money or schooling maintenance money. This question gives an idea of the financial standing of students and determines their economic power and taste. In summary, approximately four-fifth of all respondents enrolled for the study were financially buoyant. About 3% of all respondents enrolled for this study collected less than #2000 per month from sponsor, 17.7% collected between #2000 and #5000, 43.5% collected between #5000 and #10 000, 20.5% collected between #10 000 and #15 000, 12.8% collected #15 000 and #20 000 while only 4.4% collected #20 000 and above. Respondents collected a mean of #8779 monthly from sponsors. The highest amount collected is #40,000 while the lowest amount is #1,500 giving a range of #38,500. This gives a spatial distribution of the financial or economic standing of respondents. About 4.2% of UI respondents for the survey reportedly collected less than #2000, 17.2% collected between #2000 and #5000, 45.6% collected between #5000 and #10000, 17.7% collected between #10000 and #15000 while 11.6% collected between #15000 and #20000 and 3.7% collect #20000 and above per month. Among OAU respondents, about 1.9% of selected students reportedly collected less than #2000, 18.1% collected between #2000 and #5000, 41.2% collected between #5000 and #10000, 23.3% collected between #10000 and #15000, 14% collected between #15000 and #20000 while 5.1% collected #20000 and above per month. Figure 4.2 show the summary of the assumed financial capability of respondents.
 | Figure 4.2. Monthly Income |
4.8. Faculty to which Students Belong
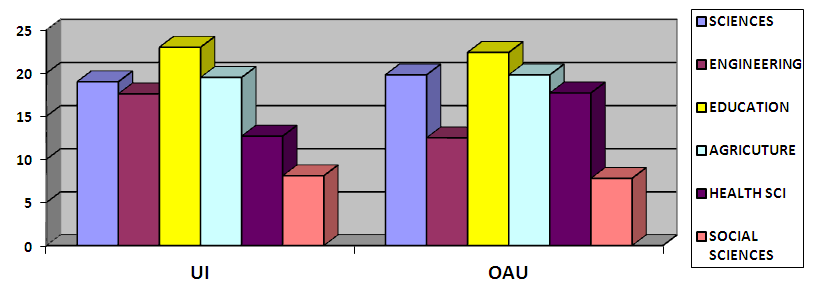
- Respondents were asked to state their course of study but analysis renders it a bit difficult to comprehend because they were so many. Therefore to make it more meaningful, they were categorized into faculty which is depicted in the table below. In summary, about 19.8% of all respondents belong to the faculty of science, 20.5% belong to faculty of engineering, 20% belong to faculty of education, 19.3% belong to faculty of agriculture, 15.6% belong to faculty of health sciences, 9.5% belong to faculty of Social Sciences. Respondents were almost evenly distributed among the faculties.About 18.6% of UI respondents were in the faculty of sciences, 21.9% were in the faculty of engineering, 22.8% were in the faculty of education, 18.6% were in the faculty of agriculture 10.7% were in the faculty of health sciences while the remaining 10.7% were in the faculty of Social Sciences. For the OAU respondents, about 20.9% of selected respondents were in the faculty of sciences, 19.1% were in the faculty of engineering, 17.2% were in the faculty of education, 20% were in the faculty of agriculture, 20.5% were in the faculty of health sciences while the remaining 8.4% were in the faculty. Figure 4.3 show the summary of the student’s faculty.
 | Figure 4.3. Faculty to which students belong |
4.9. Official Accommodation Fees versus Preferred Cost for the Accommodation
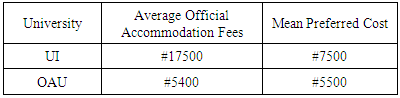
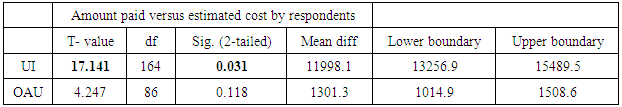
- Respondents were asked the amount of money they paid for the spaces they were allocated in the hostels. This question was asked to see if they buy from each and at what price the market value. About 48.8% of UI respondents reported that it is too high, 39.5% reported that it is good while 11.6% remained indifferent. Comparatively, about 14.8% of OAU respondents reported that the hostel accommodation fees is too high, 72.6% reported that it is good while the remaining 13.4% remained indifferent to the charge on accommodation. University of Ibadan undergraduate respondents paid #14000 and #15000 per session for the spaces to include other related fees while the postgraduates counterparts paid between #20000 and #25000 per session to include other related fees. This gives an average of #17,500. Among the Obafemi Awolowo University respondents, the amount paid range from #2090 and #3090 per space per session to include other maintenance fees but the postgraduate’s students paid #7500 per 3-person room and #12500 for single-person room per session to include other related fees, thereby giving an average of #5,400. See table 4.7a, 4.7b and figure 4.4.
|
|
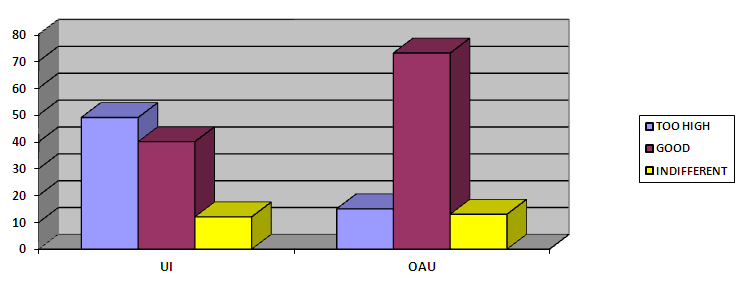 | Figure 4.4. Opinion on accommodation fees |
4.10. Number of Sessions Spent in the Hostel
- In summary, 54.2% of all respondents were spending their first year in the hostel, about 17% had spent two years, 17.4% had spent three years, 6% had spent four years while 4.4% had spent five years. All respondent had spent average of 2.2 years. The minimum year spent is one while the maximum is five, giving a range of four years. About 46% of UI respondents selected for the study were spending their first session in the hostel, 18.6% were spending their second session there, 22.3% were spending their third session, 7.9% were spending their fourth session and 6% were spending their fifth year in the hostel. Among OAU respondents, about 62.3% were spending their first session in the hostel, 15.3% were spending their second session there, 12.1% were spending their third session, 5.1% were spending their fourth session and 7.4% were spending their fifth year in the hostel. From table 4.8 the majority of the students sampled at UI had spent between 1-3 sessions in their various hostels while the majority of the students sampled at O.A.U had spent between 1-2 sessions in their various hostels. These results above also marked the differences between the two universities. See figure 4.5 for detailed explanations.
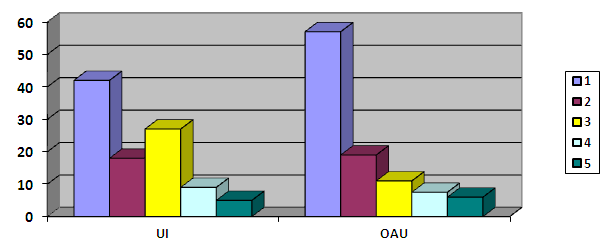 | Figure 4.5. Number of Sessions Spent in the Hostel |
4.11. Number of People Officially Allocated to the Rooms
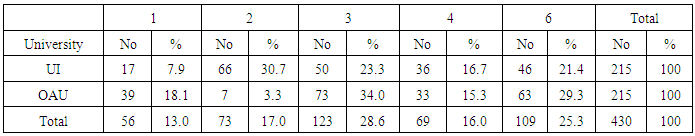
- About 13% of all respondents enrolled for the study reported that only one person was officially allocated to a room, 17% reported that two persons were officially allocated to a room, 28.6% reported that three person were officially allocated to a room, 16% of all respondents reported that four person were officially allocated to a room while 25.3% of all respondents reported that six persons were officially allocated to a room. About 7.9% of UI respondents selected for the study were officially allocated to single person room, 30.7% were officially allocated to two-person room, 23.3% of respondents room were officially allocated to three person room 16.7% were officially allocated to four persons room, 21.4% of respondent room were officially allocated to six persons room. Among OAU respondents, about 18.1% of respondents selected for the study were officially allocated to single person room, 3.3% were officially allocated to two-person room, 34.% of respondents room were officially allocated to three person, 15.3% were officially allocated to four persons, 29.3% of respondent room were officially allocated to six persons. The result is depicted in the table 4.9.
|
5. Satisfaction with Various Services and Amenities Provided in the Halls of Residence
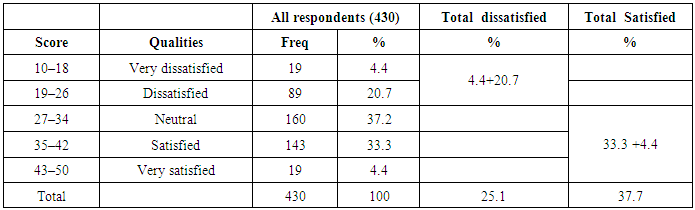
- The satisfaction with various amenities provided in the hall generally was assessed among all respondents in both universities. The level of satisfaction was very low among 4.4% that is, were very dissatisfied, 27% of all respondents were dissatisfied, while 37.2% of all respondents were neutral, 33.3% of all respondents were satisfied while 4.4% of all respondents very satisfied. To be more appropriate, 37.7% of all respondents enrolled for the study were satisfied about the provision of services and amenities in the halls of residence in both universities as against 25.1% who reported otherwise and 37.2% who reported neutral satisfaction. Therefore it can be concluded that the social amenities provided in the halls of residence in both universities were slightly satisfactory to the students. The above information is represented in the table 5.0.
|
5.1. Determinants of Residential Satisfaction among All Respondents
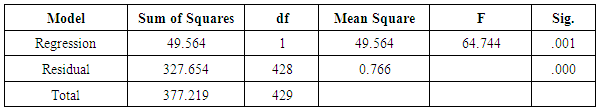
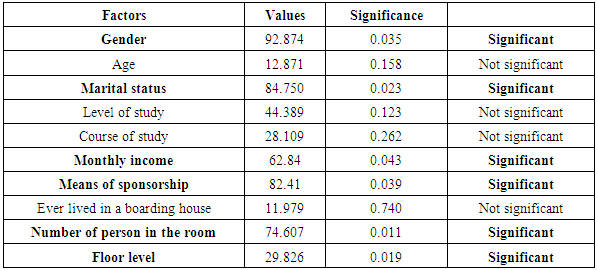
- The result of the regression that was carried out on all respondents to determine the relationship between socio-economic characteristics of respondents residential and satisfaction is tabulated in table 5.1. All the socio-economic factors were combined as one at this level of analysis to predict whether a relationship exists between residential satisfaction with living in the hostel and socio-economic characteristics of respondents. This also reveals the factors which influence satisfaction as well as the strength of the factors. Also, chi-squares analysis was carried out on each of the socio-economic factors to determine the extent of influence each of the socio-economic factors has on residential satisfaction.
|
|
5.2. Determinants of Residential Satisfaction among UI Respondents
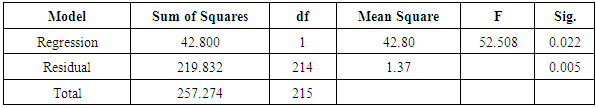
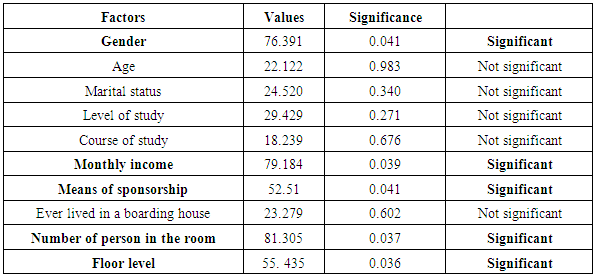
- A similar analysis was also carried out on University of Ibadan respondents to determine the relationship between residential satisfaction and socio-economic characteristics of respondents. The result is tabulated in table 5.3.
|
|
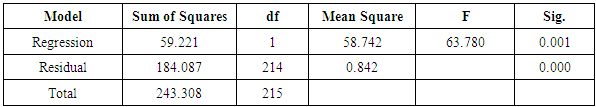
5.3. Determinants of Residential Satisfaction among O.A.U Respondents
- A similar analysis was again carried out on Obafemi Awolowo University respondents to determine the relationship between residential satisfaction and socio-economic characteristics of respondents. The result is tabulated in table 5.5.
|
|
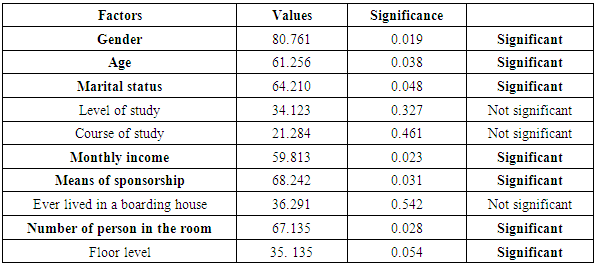
5.4. Summary and Implication
- This study has succeeded in examining the socio-economic characteristics of the users in the halls of residence, residential satisfaction in the halls of residence and has also succeeded in analyzing the relationship between residential satisfactions and socio-economic characteristics of the users in the halls of residence across the two Universities purposively selected for this study in South-western Nigeria. The socio-economic characteristics of the students considered in this research reveals that, a total number of 430 were sampled at the two universities, more male students were sampled at UI and more female students were sampled at O.A.U. Students that resides in both O.A.U and UI ranges between the ages of 15-30years. This chapter has also revealed that, most of the students sampled are single students from different levels of study, course of study were also sampled and most of the students sampled are been sponsored by their parents. Also majority of these students collects money between #5,000 - #15,000 per month at home. It is therefore, concluded that, the students of O.A.U are of better financial status than their counterpart at UI. It can also be concluded that, the official accommodation fees paid for bed spaces by the students in UI is of higher cost between 14000-25000 when compared with its counterpart at O.A.U that paid between 3090-12500. However, At UI, larger proportion of student sampled complained about the high rate of official accommodation fees paid for their bed spaces while at O.A.U, larger percentage of the students sampled expressed good opinion about their official accommodation fees for their bed spaces. This research also found out that, most students have not even experienced staying in the boarding house before and most of them have spent between 2-3sessions in their various prospective halls of residence. It can also be concluded that the services and amenities provided in the halls of residence in both universities were slightly satisfactory to the students. Also, the analyses between the residential satisfactions and socio-economic characteristics of the users in the halls of residence showed that gender (92.874), number of person per room (74.607), age (61.256), marital status (84.750) means of sponsorship (82.41) were significant generally across the Universities at 0.05Level. At UI, gender of respondents (76.391), monthly income (79.184), means of sponsorship (52.51), number of occupants in the room (81.305), hostel floor level (55.435) were significant at 0.05 level. At O.A.U, gender of respondents (80.761), age (61.256), marital status (64.210), monthly income (59.813), means of sponsorship (68.242), number of occupants in the room (67.135), design (41.802) were significant at 0.05 level, but the most significant socio-economic factor that influenced residential satisfaction across the universities is gender (92.874 value) an number of people per room. The implications deduced based on the results obtained from this study was that hostel designers should be more concerned with gender, number of people per room, marital status, monthly income, means of sponsorship, floor level of the hostel as a factor in the overall students’ hostel design. The hostel managers should monitor and supervise the number of people allocated per room by ensuring that each room were allocated according to what the architects designed it to accommodate.