-
Paper Information
- Paper Submission
-
Journal Information
- About This Journal
- Editorial Board
- Current Issue
- Archive
- Author Guidelines
- Contact Us
American Journal of Biomedical Engineering
p-ISSN: 2163-1050 e-ISSN: 2163-1077
2026; 14(1): 16-28
doi:10.5923/j.ajbe.20261401.03
Received: Mar. 1, 2026; Accepted: Mar. 26, 2026; Published: Apr. 10, 2026

Development of an Automated Wearable Device for Real-Time Temperature Monitoring and Control of Febrile Seizure
 Abstract
 Reference
 Full-Text PDF
 Full-text HTML
Olugbenga Kayode Ogidan1, Vincent Andrew Akpan2, Julius Olasunmibo Ogunniyi3
1Department of Electrical and Electronics Engineering, Elizade University, Ilara-Mokin, Ondo State, Nigeria
2Department of Biomedical Engineering, The Federal University of Technology, Akure, Ondo State, Nigeria
3Department of Computer Engineering, Elizade University, Ilara-Mokin, Ondo State, Nigeria
Correspondence to: Olugbenga Kayode Ogidan, Department of Electrical and Electronics Engineering, Elizade University, Ilara-Mokin, Ondo State, Nigeria.
| Email: |  |
Copyright © 2026 The Author(s). Published by Scientific & Academic Publishing.
This work is licensed under the Creative Commons Attribution International License (CC BY).
http://creativecommons.org/licenses/by/4.0/

A Febrile seizure is a convulsion common in children between the ages of 6 months and 6 years caused by temperature spikes up to 38°C. Parents are normally distressed seeing their kids undergo such health conditions and, as a result, seek paediatric consultations, thus the need for continuous temperature monitoring. Most hospitals in Africa lack the facilities for continuous temperature monitoring. This research therefore develops an automated wearable device that is meant to continuously measure temperature in real-time, raise audible alerts at the measurement location in case of a temperature spike, and transmit the measured values to relevant stakeholders at remote locations in digital and graphical formats. This is done through a user-friendly web and mobile applications (Apps). A comparison of implementation between the web and mobile applications reveals that the mobile App was three times faster than the web App in displaying transmitted information under similar communication conditions. The developed real-time wearable temperature monitoring device (WTMD) was calibrated against a standard digital thermometer, and a correlation coefficient of 0.913829 was obtained. Furthermore, the WTMD was validated against a standard digital and mercury-in-glass thermometers using the Bland-Altman technique; and the results were in conformity and in good agreement based on several Bland-Altman metrics. The device is portable and low-cost. It has the potential to assist parents and healthcare caregivers in early detection and management of febrile seizures and other temperature-related ailments.
Keywords: Automation, Temperature monitoring, Febrile Seizure, Wearable Device
Cite this paper: Olugbenga Kayode Ogidan, Vincent Andrew Akpan, Julius Olasunmibo Ogunniyi, Development of an Automated Wearable Device for Real-Time Temperature Monitoring and Control of Febrile Seizure, American Journal of Biomedical Engineering, Vol. 14 No. 1, 2026, pp. 16-28. doi: 10.5923/j.ajbe.20261401.03.
Article Outline
1. Introduction
- Temperature measurement plays a crucial role in assessing the health status of individuals visiting clinicians or in intensive care units (ICUs) [1–2]. Febrile seizures affect children aged 6 months to 6 years due to temperature spikes reaching 38°C. Parents often experience significant distress witnessing their children endure such conditions. This underscores the need for continuous temperature monitoring to enable early detection, prompt consultations, and immediate medical intervention. Proper body function relies on maintaining temperature within 36.5°C to 37.5°C, the normal range essential for human survival [1–2]. Not surprisingly, temperature ranks among the vital signs routinely checked by clinicians.
1.1. Importance in Disease Management
- Temperature monitoring proves vital for managing illnesses like febrile seizures, malaria fever, typhoid fever, Ebola, COVID-19, and Lassa fever [3–6], as well as ovulation detection [7]. Measurements can target core body temperature (Tc) or systemic sites, using invasive or non-invasive methods [8–9]. Invasive approaches insert sensors into body cavities, sometimes requiring surgery that risks tissue damage. Oral measurement involves placing a thermometer in the mouth but poses challenges for infants and young children, who may bite it during fever induced shivering or hypothermia, with added risks of cross-infection.Axillary measurement under the armpit suits infants safely yet lacks convenience for prolonged continuous use. Tympanic thermometers in the ear risk inaccuracies from poor placement, earwax, or user inexperience. Rectal measurement traumatizes children and heightens cross-infection risks in newborns.
1.2. Need for Continuous Monitoring
- Continuous body temperature monitoring remains essential for febrile seizure management, especially since it predominantly affects children. Traditional sites like the anus, mouth, ear, or armpit prove inconvenient for long-term use. A more suitable method for sustained, continuous measurement is thus required. Reliable, real-time feedback from such monitoring could save infant lives and lower mortality rates. It also applies to embryonic development in neonatal incubators [10–12], egg incubation [13–15], and microbial growth in incubators [14–15].
1.3. Technological Advancements
- Advancements in temperature measurement include mercury in glass thermometers, digital thermometers, infrared devices, and microcontroller-based real-time monitors. Recent studies highlight mobile apps' potential to enhance chronic disease treatment and management. In both developed and developing countries, awareness grows of smartphones' role in personal health oversight, including chronic conditions. These apps offer intuitive interfaces for users. The remainder of the paper is structured as follows: Related works are presented in Section 2. In Section 3, the research materials and design methodology are presented. The results from this work are presented and discussed in Section 4. Section 5 concludes the paper with recommendations on future directions.
2. Related Studies in Febrile Seizures
- In the study reported by [16,17], the authors examined 109 children and found that 13 with febrile seizure confirmed that male sex and body temperature are predictors of febrile seizure. The study confirmed 39.2°C as the predictive threshold for febrile seizure. The risk factors responsible for febrile seizures were examined in [18], with 176 children examined. Febrile seizure was found to occur more in males (61.96%) than females (38.07%), confirming [17] claim. Symptoms include a spike in body temperature to 38.9°C and an infected upper respiratory tract observed in 32.95 % of the patients. Other risk factors include family history regarding the occurrence of febrile seizures. Different researchers differ in the choice of cut-off or threshold temperature for febrile seizure. In case of [19], the authors reported 39.08°C, while the authors claimed a mean temperature of 39.38°C in the first 2 hours of fever [19]. Authors in [20] reported that 91% of patients attended to in a Hospital Emergency Ward had a fever above 38.8°C, while the average temperature was 39.48°C [20]. In summary, most studies [17–20] indicate that temperature spike is one of the most predominant factors aiding early detection of febrile seizure. This is the reason temperature monitoring is very important.
2.1. Advances in Temperature Monitoring Systems
- Numerous efforts address temperature monitoring. In [21], an Arduino UNO connected temperature and pulse rate sensors to an Ethernet shield, displaying real-time data on the Blynk mobile app via smartphone with continuous updates. Authors in [22] developed a wireless heartbeat and temperature system using a photodiode LED for heartbeat, an LM35 sensor for temperature, a PIC16F72 microcontroller, and RF transmission; data displayed on an LCD at 100 meters via RF receiver.In [23], a febrile seizure detection alarm employed an ATmega328P microcontroller, Xbee module, router, and buzzer, transmitting real-time temperature wirelessly to mobile phones. Researchers in [24] created a wearable vital signs monitor with ATmega328P, DS18B20 sensor, pulse oximeter, buzzer, and OLED, achieving accuracy comparable to standards. For COVID-19 tracking, researchers in [25] used DS18B20, NodeMCU ESP8266, buzzer, and power bank, calibrated to 98% accuracy against a Vicks thermometer.The researchers in [26] introduced a healthcare system bridging rural-urban gaps with LM35 for temperature, CO, and CO2 sensors, and ESP32, transmitting via Wi-Fi. In [27,28], a low-power digital thermometer integrated LM35, buzzer, LED, PIC16F877A, yielding 4.69% mean absolute percentage deviation versus mercury in glass. For elderly monitoring, the study in [29] built a wearable system tracking temperature, respiration, and heartbeat, sending SMS alerts via GSM, audible alarms, and LCD display, ideal for pandemics like COVID-19.As reported in Table 1, there has been a lot of advancement regarding biomedical wearable sensors in recent times.
|
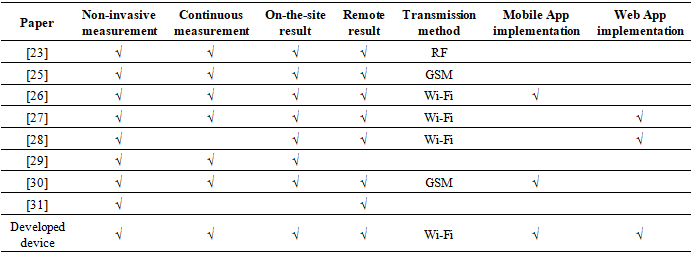
2.2. Novelty of Research
- Previous studies on febrile seizure either implemented the remote information on either mobile Apps or web Applications [22-24]. This paper distinguishes itself by implementing a low-cost WTMD prototype that delivers real-time early warnings to patients, clinicians, and caregivers via audible alerts, web, and mobile app notifications specifically tailored towards febrile seizure management. This would enable a proactive management of the phenomenon. It also provides a framework for integrating the WTMD into telecommunication networks to achieve optimal performance. The low-cost design makes it particularly suitable for African settings with infrastructural deficits.
3. Materials and Methods
3.1. Materials
- The materials used for this work are twofold, namely: the software-based components and the hardware materials. The software-based components include: mobile application (App), Node.js web server, and MongoDB database. The hardware components include: NodeMCU ESP8266 microcontroller real-time embedded system development board, DS18B20 thermistor, SFM-27 electronic buzzer alarm, Lithium-ion polymer (Li-Po) battery, Organic light emitting diode (OLED), and 2x6 character Liquid crystal display (LCD).
3.2. Methods
- The methodology of this research can be divided into six stages, namely: design of and construction of the WTMD, development of a remote database, design of the Web and mobile App Interface, calibration and validation and the performance evaluation of the WTMD. These stages are illustrated in Figure 1.
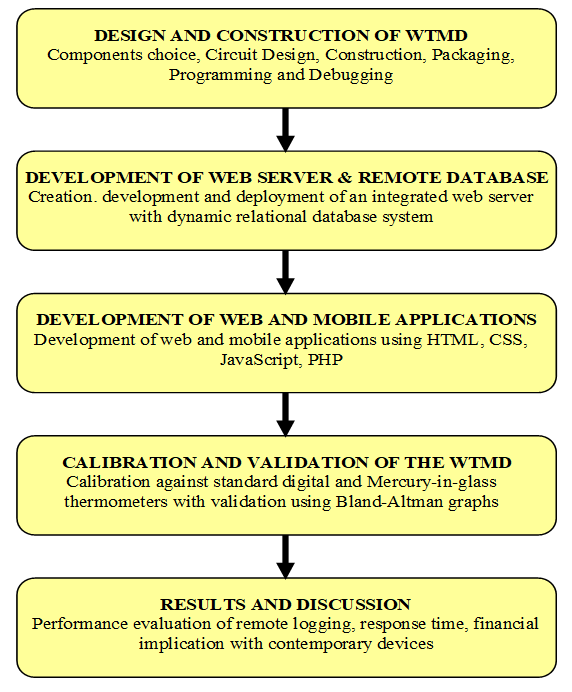 | Figure 1. Overall methodology of the proposed research |
3.2.1. Design and construction of the Wearable Temperature Measuring Device (WTMD)
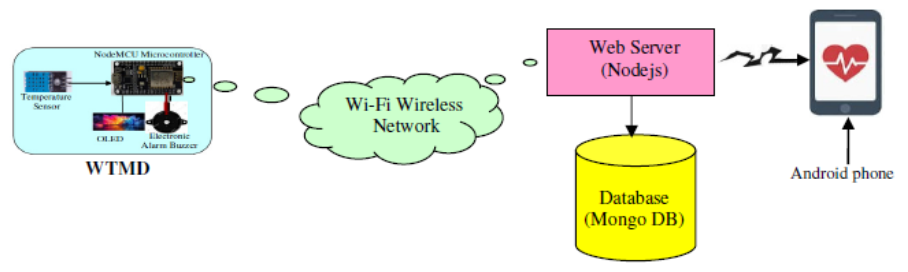
- Figure 2 is the block diagram of the developed system. It comprises the patient or user, the wearable temperature monitoring device, the wireless network, the web server with a database, and the mobile Android device, which gives the caregiver access to the acquired temperature. Figure 3 is the system architecture of the proposed WTMD. It comprises the WTMD attached to the patient, a network for communication purposes, the local host server, nurses to monitor the temperature trends from the web App and doctor monitoring from his mobile App.
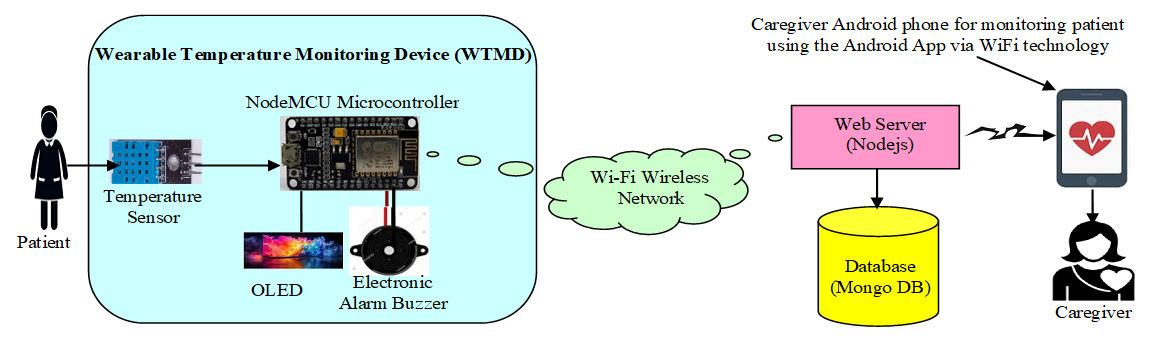 | Figure 2. Block diagram of the proposed WTMD |
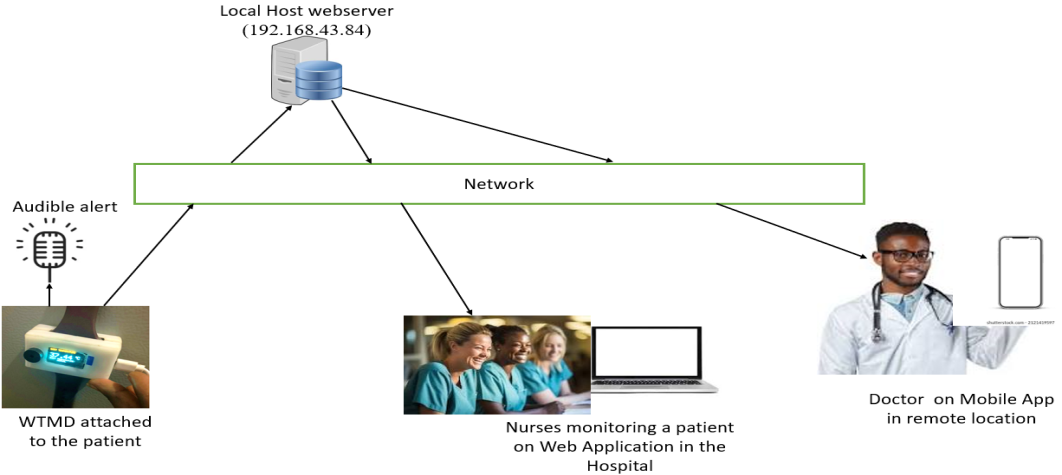 | Figure 3. System architecture of the proposed WTMD with webserver and mobile App |
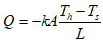 | (1) |
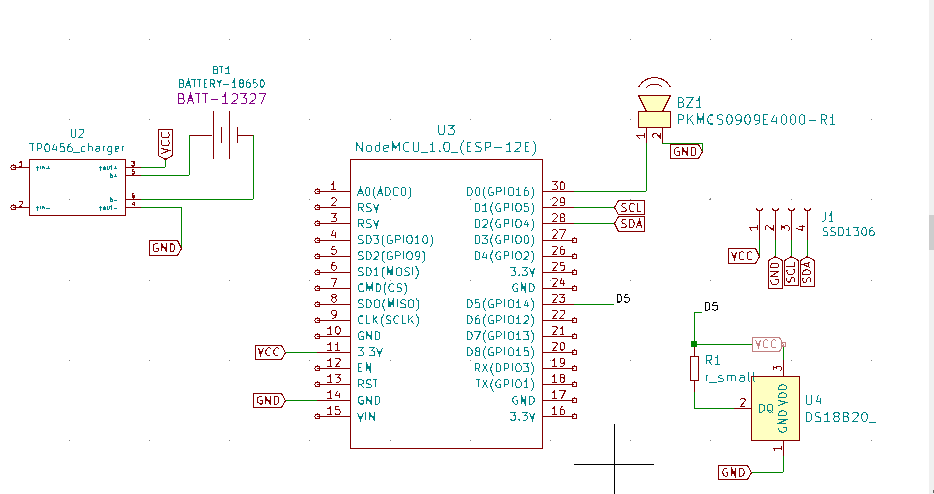 | Figure 4. Schematic circuit of WTMD with DS18B20 sensor and the NodeMCU microcontroller |
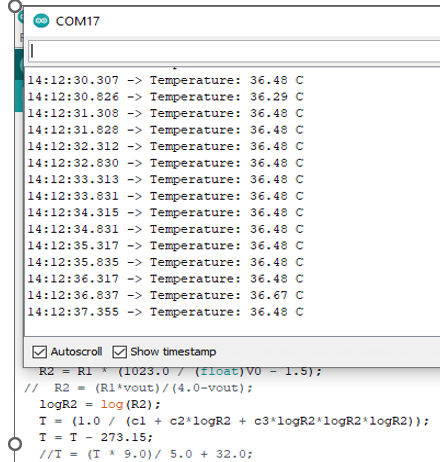 | Figure 5. Programme in the Arduino IDE |
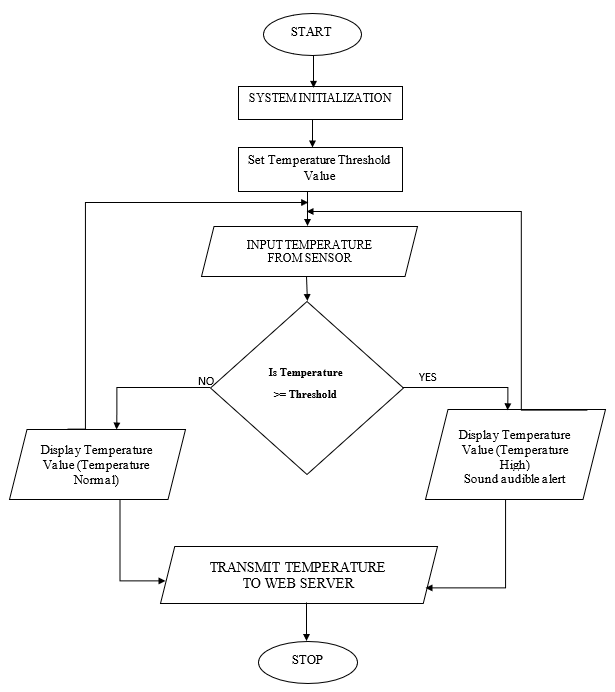 | Figure 6. Flowchart of the developed WTMD system |
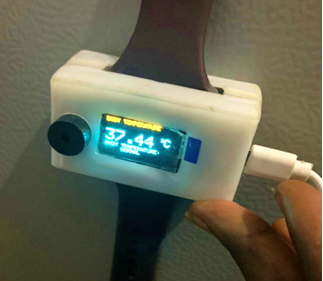 | Figure 7. The developed wearable temperature measuring device (WTMD) after packaging |
3.2.2. Development of Database for Data Storage
- The microcontroller (NodeMCU ESP8266) used in this project has the unique feature of an inbuilt Wi-Fi module. This makes it useful for sending acquired temperature values from the microcontroller to the web server. In this research, a personal computer (PC) is used as a local host for the web server. In the PC, NodeJS is used as interfacing software that stores and displays data in a specific format. Collected data that are stored in the database display the user’s temperature accordingly. Figure 10 shows the interconnection from the wearable temperature measuring device (WTMD) through the web server/database and finally to the mobile App where the caregiver or medical personnel is able to view and interpret the acquired temperature.
3.2.3. Design of Web and Mobile Applications
- The web server is implemented using NodeJS, which is a JavaScript-based virtual runtime environment used to implement web servers. MongoDB, a NoSQL (Not only Structured Query Language) database, is used to design the database. MongoDB uses a document model rather than the table model, which makes it faster and more scalable than SQL. For the development of the Android App, QuasarJS is used. This is a JavaScript framework used to develop applications that can run on multiple platforms such as Windows PC, Mac PC, Android OS, and iOS. To develop and debug the application, Microsoft’s Visual Studio development environment was employed. Microsoft’s Visual Studio supports JavaScript, with which both the server and the user interface are developed. The results of the measured temperature can be made available to relevant stakeholders in remote locations via a secure Android mobile application or web application, as shown in Figure 10.The measured temperature is displayed in digital form on the OLED screen of the WTMD attached to the user, while the caregiver is able to receive time-stamped information graphically on an Android mobile device. In this work, a Local Area Network (LAN) is used for the implementation. When a wireless router is connected, data can be received from any remote location over the Internet.
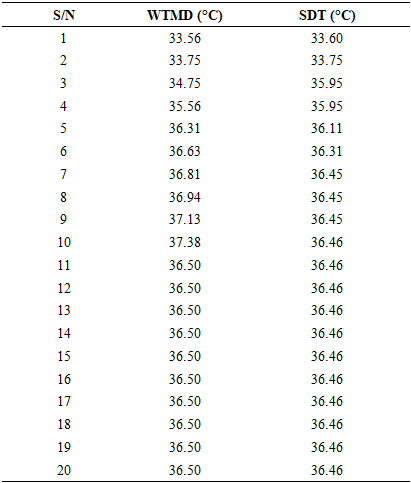
3.2.4. Calibration and validation of the WTMD
- To validate the accuracy of the developed wearable sensory device, it was calibrated against a standard digital thermometer. Ten samples of measurements were taken using both devices. Figure 8 is the graph of the calibration. When it is compared with the digital thermometer, the developed WTMD returned a correlation coefficient of 0.913829, which tends to 1. This shows a high degree of accuracy. Figure 9 is the Bland Altman Graph of WTMD with a standard digital thermometer, where ULoA is the Upper Limit of Agreement, UCI is Upper Confidence Intervals, MCI is Mean Confidence Intervals, LLoA is Lower Limit of Agreement, and LCI is Lower Confidence Intervals.
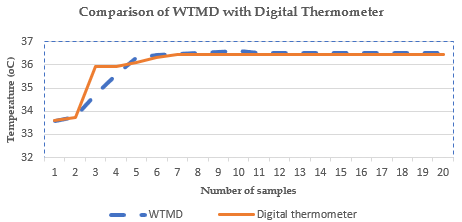 | Figure 8. Calibration of WTMD with standard digital thermometer |
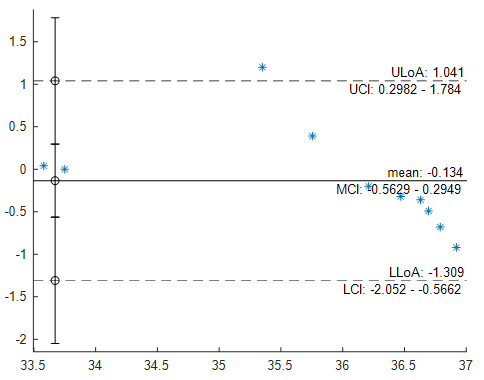 | Figure 9. Bland-Altman Graph of WTMD with standard digital thermometer |
 | Figure 10. Database block diagram of the developed WTMD |
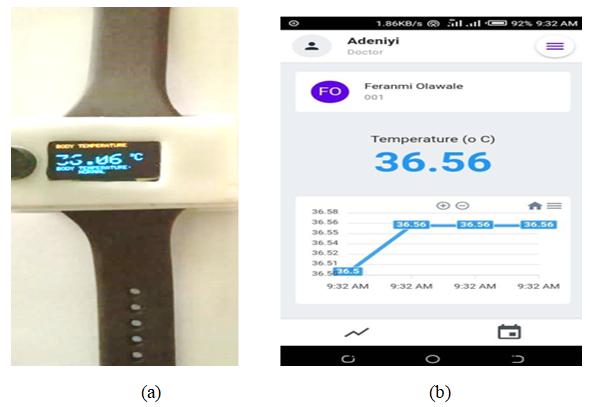 | Figure 11. (a) Digital display of temperature on the WTMD and (b) Graph of transmitted temperature displayed on Android mobile app |
4. Results and Discussions
- The results obtained were evaluated in different ways, including performance evaluation of temperature measurement and successful data logging, evaluations of response time of web App and mobile App compared with WTMD hardware, evaluation of WTMD with contemporary temperature measuring devices, and the financial implications of the developed WTMD.
4.1. Results
4.1.1. Evaluation of Temperature Measurement and Successful Data Logging
- The result of this device can be observed through the developed graphical user interface (GUI). The details of the output are illustrated step by step as follows. Once the device is switched on and connected to the network, an authentication screen is displayed as shown in Figure 12. Existing users can sign in through their login credentials while new users are made to register.
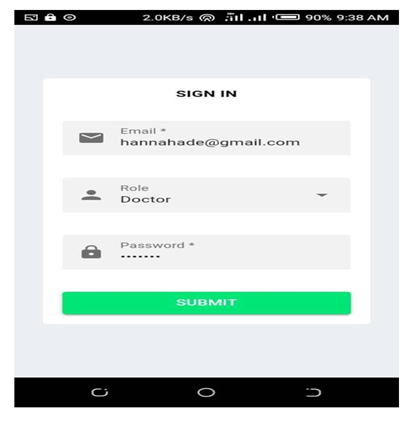 | Figure 12. Mobile App Authentication screen |
 | Figure 13. (a) Graph of the temperature below the chosen threshold and (b) Graph of the temperature above the chosen threshold |
4.1.2. Evaluations of Response time of web App and Mobile App Compared with WTMD Hardware
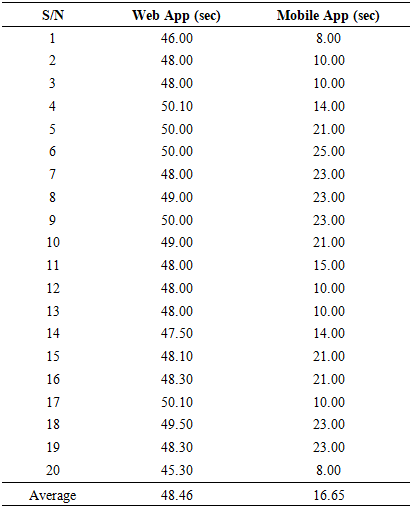
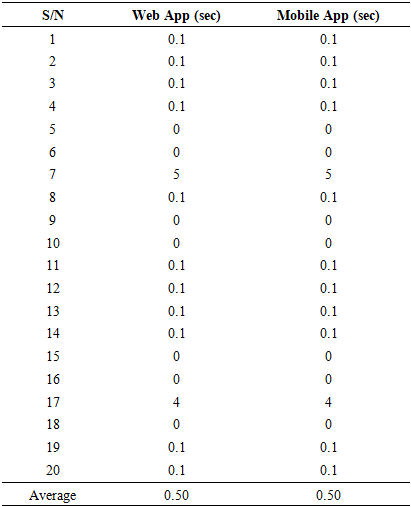
- The performance of the WTMD temperature display was compared with that of web and mobile applications. The complete experimental setup is shown in Figure 14(a) and 14(b). In both cases, mobile and web applications were connected as part of a Local Area Network (LAN) of the WTMD. A LAN connection was setup via an Internet Protocol (IP) address (192.168.43.84) under a Wi-Fi network.
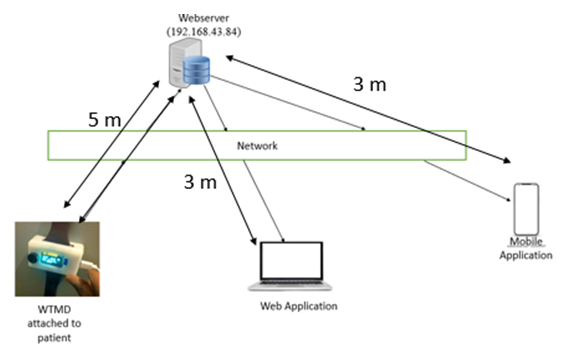 | Figure 14(a). Experimental set-up at 5 m between WTMD and web server |
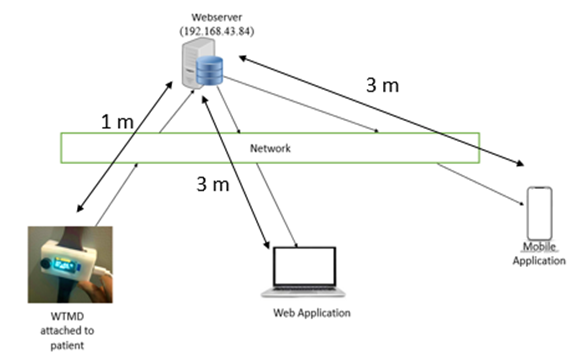 | Figure 14(b). Experimental set-up at 1 m between WTMD and web server |
|
|
|
|
4.1.3. Evaluation of WTMD with Contemporary Temperature Measuring Devices
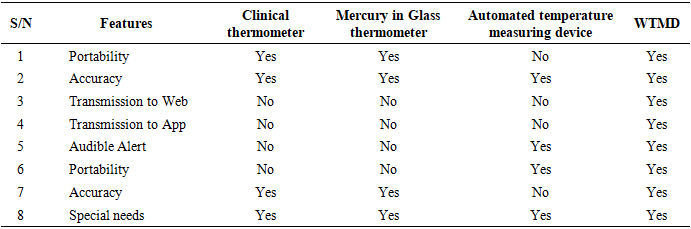
- A performance evaluation was carried out by comparing the developed WTMD with other temperature measuring devices, such as a clinical thermometer, a mercury in glass thermometer, automated temperature measuring device [7], as well as the response of the WTMD in logging data to the mobile App and web interface. Table 6 presents an evaluation of the developed WTMD with other temperature measuring devices in terms of portability, accuracy, ability to meet users’ special needs, such as use for children, the aged, physically challenged, and ovulation detection, to mention a few.
|
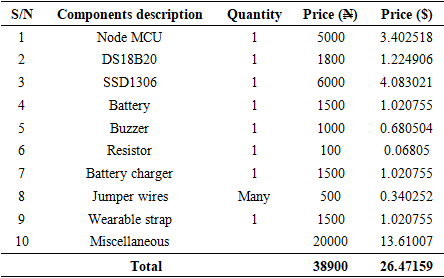
4.1.4. Evaluation of Financial Implications of the Developed WTMD
- As part of the evaluation, the bill of engineering materials and evaluation (BEME) was carried out to know the cost implication of the developed WTMD and the cost of components and materials as well as the overall cost, both in Nigerian Naira (N) and United States Dollar ($), for the construction of the WTMD device is shown in Table 7.
|
4.2. Discussion of Results
- According to the studies carried out on cut-off temperature for febrile seizure, averaged to be between 39.20°C and 39.48°C [17–21], 37.5°C was chosen as the threshold temperature for early warning audible alert and online notification through the web and mobile Apps.
4.2.1. Successful Data Logging
- From the evaluation in Section 4.1.1 with Figure 12 and Figure 13, the WTMD performed well in logging the measured temperature in real-time to the mobile App with the colour of the graph changing from blue to red once the threshold is exceeded, as shown in Figure 13(a) and 13(b). This is similar to the studies in [24–26] where results were transmitted via Wi-Fi, [28] where it was transmitted by GSM, and [23] by radio frequency (RF).
4.2.2. Response Time of Web App and Mobile App Compared with WTMD Temperature Display
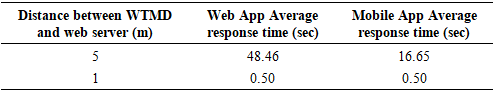
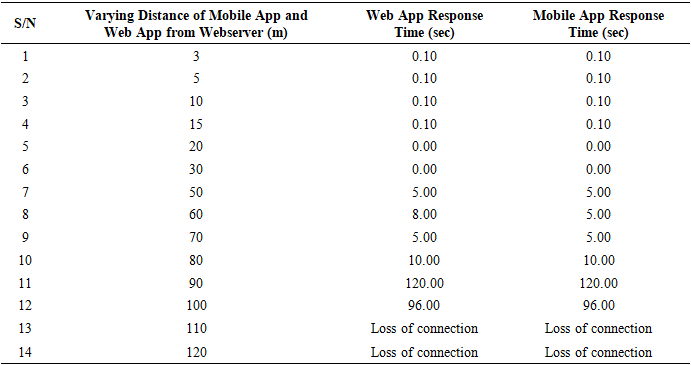
- In the management of febrile seizures, time is of great importance. Delay in the operation period of the WTMD is capable of putting the patient at risk. This is the reason for evaluating the response time of the Apps to estimate possible delays that could occur during device use. Being able to account for the delay will assist in setting the alert temperature threshold of the WTMD. From the evaluation carried out in the experiments and results obtained in Tables 2 to 4, it could be observed that the closer the WTMD was to the web server (local host), the faster the results were obtained on the web App and mobile App. Given the same distance between WTMD and web server, the mobile App display was approximately three times faster than the web App. However, in Table 5 with measurements done at varying Web App and mobile App distances, the network delay increased with increase in distance from the webserver and became pronounced at 50 m. The implication of these findings is that users of the developed WTMD need to take great care in positioning the WTMD at about 1 m or less from the webserver to derive maximum benefit from its use. It would also be necessary to connect to the Internet, GSM, or a more reliable network for a reliable and timely delivery of acquired temperature and for wider coverage compared with Wi-Fi with limited coverage.
4.2.3. WTMD Compared with Contemporary Temperature Measuring Devices
- From the records in Table 5, in terms of size, it could be considered more portable when compared with the automated temperature measuring device in [7]. For instance, the device in [7] is (10 cm x 10 cm x 5 cm) in terms of length, breadth, and width, with a cuff of 60 cm length to be tied around the arm to put the thermistor temperature sensors in place. In case of the WTMD, the estimated size as shown in Figures 8 and 12 is (3 cm x 3.5 cm x 2 cm) in terms of length, breadth, and width respectively, with a strap of 20 cm to be worn around the wrist [6] like a wrist-watch to hold the temperature sensor in place. The fact that it is very portable and resembles a wristwatch will make it attractive and convenient for users, especially children.WTMD is more convenient than mercury in glass and clinical thermometers that have to be placed in the armpit and held in place until the temperature values are obtained. The convenience will make it a suitable option for the physically challenged [7] and those involved in ovulation detection [7], especially when there is a need to measure temperature on a continuous basis [22–25,28]. For example, the infant and the aged might not be able to keep a clinical thermometer in place under their armpits, in their mouth, or in their ear as tympanic thermometers [32], especially when such measurement is to be done for a long time. In terms of accuracy, the developed device, as shown in Figure 8, returned a correlation coefficient of 0.913829 when compared with a standard digital thermometer, just as the automated temperature device in [7] returns a good accuracy of a correlation coefficient of 0.790996276 when compared with mercury in glass thermometer. The temperature sensor used in this work is a contact-based temperature sensor, which has been found to be more accurate than the non-contact temperature sensors [16]. During the calibration of the WTMD in Figure 8, one would observe a lag in the reading of the developed device between the 3rd and 5th readings in comparison with the clinical thermometer. This could be due to the initialization process of the microcontroller resulting to slow rise time of the measuring device. This would be addressed in subsequent works by improving the rise time of the system. The Bland-Altman plot for the developed WTMD versus the standard digital thermometer is shown in Figure 9. The Bland-Altman plot is a graph that shows the agreement between two quantitative measurements (see Table 8) to visually check data and display results to evaluate agreement.
|
4.3. Limitations of WTMD
- The limitation of the developed WTMD is that Network delays are evident, with web app response times up to 48.46 seconds at 5 m from the server (versus 16.65s for mobile), potentially delaying alerts in critical scenarios. Calibration shows lags due to microcontroller initialization (slow rise time noted in readings 3-5), and wrist skin measurements may not fully correlate with core body temperature. Fixed 37.5°C threshold lacks user customization, and no clinical trials on actual febrile seizure patients were conducted.
4.4. Improvement for the Future
- Future Improvements will involve tests on real febrile seizure patients to validate efficacy. Rise time of temperature display graph will be enhanced via optimized firmware and user-input option for thresholds pre-set would be introduced. Integration of GSM/Internet for WAN reliability, multi-sensor fusion (e.g., heart rate), and machine learning (ML) for predictive analytics on stored data would be adopted.
5. Conclusions
- In this work, a portable WTMD is developed for continuous monitoring of human temperature with a potential for early detection of febrile seizure and other temperature-related ailments. A WTMD hardware and web/mobile App were developed to excite audible and graphical alerts once the temperature exceeds the pre-set threshold of 37.5°C. The acquired temperature values could also be read on the site of measurement and also by caregivers from remote locations over a network. Evaluations performed in comparison with existing temperature monitoring devices reveal that the WTMD is portable, affordable, and returns a correlation coefficient of 0.913829 when compared with a digital thermometer. It is convenient for special needs such as the aged, infants, and physically challenged, especially when the temperature has to be measured continuously for a long time. For optimal performance, the WTMD must be placed at a 1 m distance from webserver on a Wi-Fi network or used over the Internet. Future work would include the use of the developed WTMD on patients with febrile seizure cases, improvement of the mobile App to cater for specific needs and preferences of parents as well as healthcare providers, and implementing the system on a Wide Area Network.
ACKNOWLEDGEMENTS
- The authors would like to thank Miss Dolapo Olorunfemi, Miss Hannah Adeniyi, and Miss Tolani Adewole of the Department of Biomedical Technology, Federal university of Technology Akure, Nigeria who assisted in data gathering for this publication and Dr. Olusola Oloruntoba of the Department of Automotive Engineering, Elizade University for assistance with the heat transfer model.