Mostafa Brik1, Souad Harmand1, Mony Girault2, Anne-Laure Metz2, François Rochiccioli2, Fabrice Lapeyre3, Jérome Clarysse3
1LAMIH UMR CNRS 8201, Département de Mécanique, UPHF, Le Mont Houy, Valenciennes, France
2VYGON, 8 Rue de Paris, Ecouen, France
3Centre Hospitalier de Valenciennes, Département Néonatalogie, Avenue Désandrouin, Valenciennes, France
Correspondence to: Mostafa Brik, LAMIH UMR CNRS 8201, Département de Mécanique, UPHF, Le Mont Houy, Valenciennes, France.
| Email: |  |
Copyright © 2020 The Author(s). Published by Scientific & Academic Publishing.
This work is licensed under the Creative Commons Attribution International License (CC BY).
http://creativecommons.org/licenses/by/4.0/

Abstract
In this paper, we have elaborated an analytical model to study the dynamics of the Smof-Lipid delivery in Neonate nutrition fluid with an Intravenous (IV) infusion system. For a simple configuration, containing two inlets and one outlet, used mainly in neonatology, analytical computations were performed in order to study the impact of different factors such as: the common dead volume (V), the cessation of the drug infusion and the variation of the carrier flow-rate on the dynamics of the drug delivery. The influence of the viscosity of different fluids used in the study on the head losses in all branches of the IV system as well as on the variation of the pressure at the inlets of the infusion system has been investigated as well. In a first step, the analytical model was validated for the steady-state administrated drug concentration with some analytical results existed in the literature [1]. In the second part, the influence of the common dead-volume (V) on the Smof-Lipid  administration with constant carrier and drug flow-rates
  and
and  respectively, has been investigated for 250min of drug administration before proceeding a cessation. Different results illustrate that the achievement of the drug steady-state administration depends strongly on the common dead volume (V) of the mixing compartment. It’s determined that, for the fixed carrier and drug flow-rates cited above, going from V = 0.5ml to V = 1ml by adding an extension tubing to the catheter could provoke a lag of about 60min instead of 28min to reach the steady-state concentration. This time could be longer (almost 124min) if the common dead volume is increased up to V = 2ml. After that, fixing the common dead-volume at V = 1ml, the impact of the cessation of the drug infusion on the evolution of the administered Smof-lipid concentration has been studied in function with the variation of the carrier flow-rate after the cessation phase. It has proved that an increasing in the carrier flow-rate provokes an acceleration of the elimination of the smof-lipid quantity contained in the dead-volume. Contrary, a decreasing in the carrier flow-rate causes further delay to achieve a complete elimination of the drug in the dead-volume. It’s also depicted that fixing the flow conditions, the head loss in different branches of the IV system depends principally on the viscosity of the fluid passing through, and the higher is the fluid viscosity, the more head loss is generated.
Keywords:
Drug infusion therapy, Bio-fluid dynamics, Fluid management, Matlab
Cite this paper: Mostafa Brik, Souad Harmand, Mony Girault, Anne-Laure Metz, François Rochiccioli, Fabrice Lapeyre, Jérome Clarysse, Analytical Model for the Computation of the Drug Administration Dynamics and Inlet Pressures of an Intravenous Infusion System, American Journal of Biomedical Engineering, Vol. 10 No. 3, 2020, pp. 55-63. doi: 10.5923/j.ajbe.20201003.01.
1. Introduction
IV infusion systems are mostly used in neonatal and pediatric therapies where several drugs are injected simultaneously to patient babies. Many issues could be encountered in IV infusion systems like boluses and drug-drug incompatibilities where a precise quantification of the administered and eliminated drugs has to be present in order to avoid all risks. Several reasons lead to a non precision of drug quantities transformed to babies like the obstruction of the catheter allowing to a reflux of one drug in another branch where a second drug is injected [2]. Changing syringes containing drugs may provoke an imprecision in the quantification of the drug administered to babies [3]. In order to analytically describe the dynamics of the drug concentration delivered with an IV infusion system to the patient baby, two models existed in the literature; the Plug-flow model and the Well-Mixed model [4]. Because of simplifications used in the description of the plug-flow model, it’s found that the steady-state concentration could be reached faster than when the well-mixed model is used [4-6]. Comparing results obtained with the latter and experimentations depicted that a good approximation could be obtained [7]. For a continuous infusion process (without drug cessation), the only important difference observed between experimentations and the well-mixed model results is the time delay provoked in the real case that is due to the dead-volume washed out before that the drug starts coming out of the system. This is particularity missed in the well-mixed model, because it’s supposed that the dead-volume is already homogeneous and the administration starts with the first changing of the total flow-rate in the mixing compartment (dead-volume) [8]. Many studies determined that the lag spent before and after reaching the steady-state administered drug concentration depends strongly on the carrier flow-rate and the initial drug concentration [9-10]. It’s found that for a constant drug infusion, a step changing in the carrier flow-rate causes a variation in the administered drug concentration and the slower the final carrier flow-rate, the lower the elimination of the drug containing in the dead volume. The latter represents an important element on which researchers have focused in their studies of the administration of drugs in an IV infusion system. Many different factors can increase the dead-volume, such as: extension tubing and the architecture of connectors (T, Y or a specific configuration) [4,7]. It’s found in the literature that the time delay is increasing with of the dead-volume which causes a wrong quantification of the drug amount administered to the baby. That’s why researchers recommended that the drug inlet has to be as close as possible to the outlet of the system in order to diminish as possible the common-dead volume to wash out [7]. One of the most important reasons for why the infused drug quantity does not respect what was prescribed by healthcare teams is the performance of the syringe pumps used for the infusion and so the variation of the pressure at the inlets of the IV system [11-14]. For a simple configuration with Y junction, it’s proved that for the same flow rate inlets and using a usual syringe pump (PHD2000 Harvard Apparatus), the fluid interface was not positioned at the center and some fluctuations in it position were remarked. This remark illustrates that the flow-rate was not stabilized at the outlet and does not respect what it was desired. However, adding a pressure feedback to the same setup to maintain a stable pressure at the inlets, those fluctuations were missed and the fluid interface was stabilized at the center which demonstrates that the outlet flow-rate respect accurately what was expected [15]. Recently, researchers have proved that a miniaturization of the pumping system seems to be suitable to guarantee an optimized time to well mixing fluids and a high precision of drug administration [16]. Generally, in real IV infusion networks used for newborn therapy, very long branches are utilized. This will impact the common dead volume were drugs are flowing, the time needed for the administration as well as the pressure used by the pumping systems to deliver the desired drug flow-rates. That’s why, in this work, a series of analytical computations were performed in order to investigate, at first, the influence of different factors encountered in a real IV infusion system like the common dead-volume V, the cessation of the drug delivery as well as the variation of the carrier flow-rate after the drug cessation on the dynamics of the Smof-Lipid concentration transported in the Neonate nutrition fluid. After that, the influence of the physical parameters of different fluids used in the study (Neonate fluids and water) on the head losses generated in all branches as well as on the pressure at the inlets of the IV infusion system was presented.
2. Analytical Model
2.1. Computation of the Concentration
In order to analytically predict the impact of the common dead volume (V), the variation of the carrier and drug flow-rate  and the initial drug concentration
  on the dynamics of the drug administration within an IV infusion system, Two algebraic models are generally proposed in the literature; Plug-flow model and Well-Mixed model [2]. The first present the simplest model which consider that the drug mixed instantaneously and completely with the carrier fluid at the junction and moves as a common-volume with a constant uniform concentration to the outlet of the catheter as shown in figure (1c) [3]. In the Plug-flow model, the time spent to reach the outlet of the IV system with a steady-state administration is depending on the volume of the mixing branch to wash out which is presented as the volume between the junction where the drug and the carrier flow meet and the outlet of the infusion system (outlet of the catheter) together with the total flow rate pass through it. This time is given as:
 | (1) |
Before this time  any concentration would be administrated to the patient
  . At
. At  the total flow-rate is supposed to start coming out of the system with a steady-state concentration value calculated as:
 | (2) |
The plug-flow model does not reflect the real case encountered in an IV drug administration. Because in reality, the concentration takes shorter time  before starting rising progressively to the steady-state value reached at
  as shown in figure 2 (experimental results). Between these extreme cases (plug-flow model and experimentations), the Well-Mixed model is situated. In this model, all the dead-volume is supposed to be homogeneous, and any changes in the total flow-rate passing through the mixing compartment will influence instantaneously the uniform concentration containing in the volume which will provokes a time delay to reach the steady-state value. As cited in Lovich et al., [1], for a drug infusion initiates with a steady carrier flow, and for V free of drugs
  equation (3) gives the variation of the administrated drug concentration in function with time:
 | (3) |
where  is the concentration in the compartment [mg/ml],
  and
and  are the carrier and the drug flow-rate [ml/s], respectively, t is the time [s] and V is the common dead-volume [ml].Any variation in the carrier or drug flow-rate provokes a change of the concentration from it steady-state. This can be quantified as follow:
 | (4) |
with  are the new carrier and drug flow-rates, respectively.
2.2. Computation of the Head Loss
In function with the flow-rate passing through each branch, the viscosity of the fluid and the dimensions of the tubing, the head loss generated in each branch of the studied system is calculated using the Poiseuille's formula for the viscous fluid flows (eq. 5).  | (5) |
here  are the flow rate [ml/h], head loss [Pa], dynamic viscosity [Pa.s], radius and length [m], respectively.
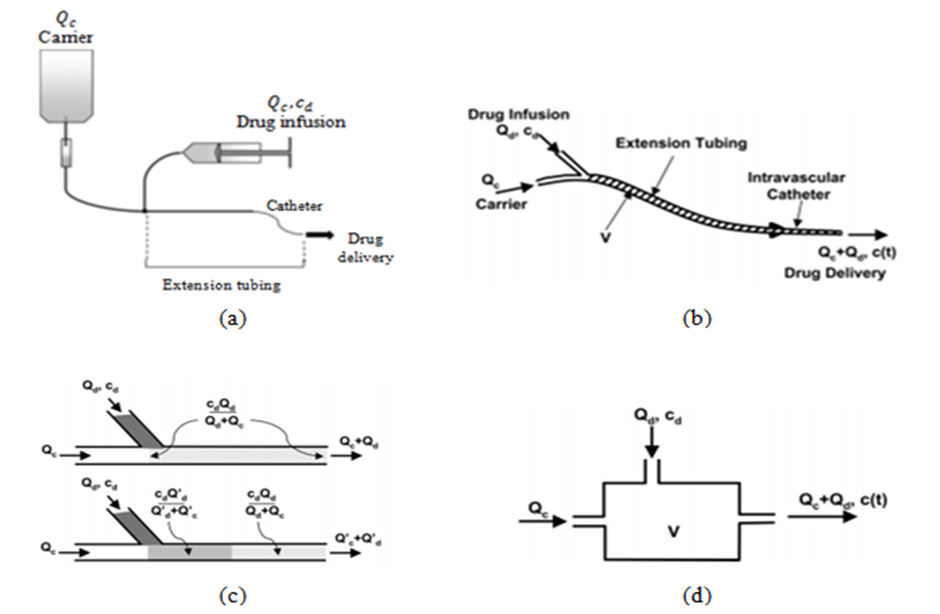 | Figure 1. a) simple configuration of an IV infusion system used for the drug administration [5]; b) description of the common dead-volume (V), carrier and drug flow-rates inlets  and total flow-rate outlet and total flow-rate outlet  c) schematic description of the Plug-flow model; d) schematic description of the Well-Mixed model [1] c) schematic description of the Plug-flow model; d) schematic description of the Well-Mixed model [1] |
3. Results and Discussion
3.1. Validation of the Analytical Model
In order to validate our model, the obtained results have been compared to analytical results found by Lovich et al., [3] (which was validated in their study with other experimental results), as shown in figure 3. In their work, researchers [3] were fixed the carrier and drug flow-rates at 10ml/h and 3ml/h, respectively. They have infused the drug  for about 33min before proceeding a cessation and tracking the evolution of the drug elimination from the dead-volume of
  (figure 2). They’ve found that the drug concentration reaches the steady-state after about 30min. After the cessation of the drug infusion (t = 33min), it’s determined that the drug elimination from the dead-volume takes about 10min experimentally to more than 20min using the well-mixed model.
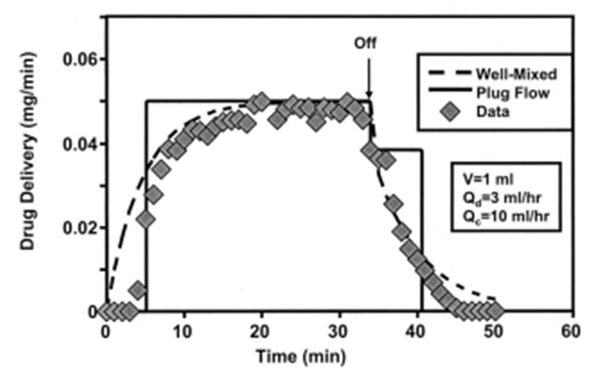 | Figure 2. Analytical (“dashed” plug-flow model, “solid” Well-Mixed model) and experimental results “symbols” obtained by Lovich et al., [3] |
As the latter gives more approximation to the real case results (experimentation), it was used in this study for the validation of our model. Figure 3 shows a comparing of the drug concentration evolution in function with time obtained in the literature [3] and those obtained with our analytical model where a good agreement was found. This validation allows the extension of the study to investigate the influence of other parameters on the dynamics of the smof-lipid delivery in an IV infusion system.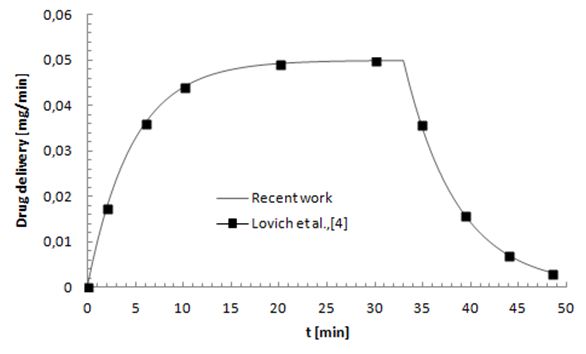 | Figure 3. Comparing between our analytical results and those found by Lovich et al., [3] |
3.2. Plug-Flow Model vs. Well-Mixed Model
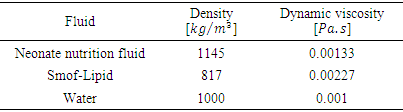
In this part, a quantification of the smof-lipid concentration  administered through an IV infusion system is proposed using two analytical models; the Plug-flow model and the Well-Mixed model. Physical parameters of fluids used in this study are shown in table 1. Dynamic viscosities of the different fluids used in the study were obtained experimentally using a lab viscometer.
 Table 1. Physical parameter for different fluids used in the study
 |
| |
|
Figure 4 illustrates the configuration used in this study. 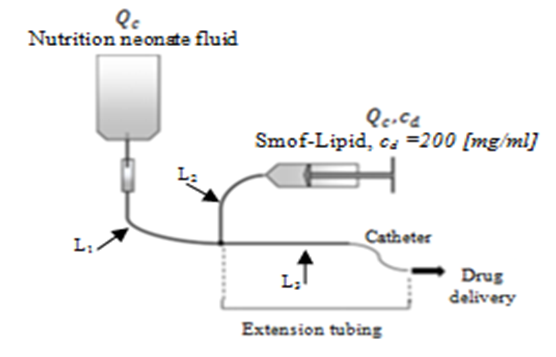 | Figure 4. Simple configuration of an IV drug administration used in the study |
Except the extension tubing, the other branches of the IV system presented in figure 4 have the same length and the same diameter; L1,2 = 1m and D1,2 = 1.5mm, respectively. The extension tubing is composed of three parts: the first is a branch of L3 = 1m and D3 = 1.5mm; the second part presents a short tubing of L4 = 0.1m and D4 = 0.55mm and the third part is a catheter of L5 = 0.2m and D5 = 0.17mm. Calculating the total volume of the extension tubing which represents the common-dead volume, it’s found that V ≈ 1.77ml. For a steady-state carrier (Nutrition neonate liquid) flow-rate  and a drug (smof-lipide) flow-rate
 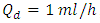 , figure 5 depicts that using the Plug-flow model, the smof-lipid reaches instantaneously it steady-state concentration of c = 3.33 [mg/min] after about t = 26min, while the Well-mixed model illustrates that the smof-lipid concentration starts rising progressively until almost reaching it steady-state c = 3.31 [mg/ml] after t ≈ 104min (4 times the lag obtained using the Plug-flow model). After the cessation of the smof-lipid infusion at t = 250min, it’s found that the elimination of the drug from the common dead volume takes about t = 26min with the plug flow model instead of about 104min with the well mixed model decreasing exponentially.
 | Figure 5. Plug-flow and Well-Mixed models used for quantifying the drug administration in an IV infusion system.  |
3.3. Influence of the Common Dead-Volume on the Dynamics of the Drug Concentration
The study was extended later to quantify the Smof-Lipid  concentration delivery transported by the neonate nutrition fluid in function with the common dead-volume (V). Based on the Well-Mixed model, the influence of the dead-volume on the dynamics of the drug concentration during the initiation and after the drug infusion cessation is investigated. Figure 6 presents the variation of the administrated drug concentration in function with time for different common dead-volumes V (V = 0.5, 1 and 2ml). With a steady-state carrier flow-rate, the smof-lipid infusion is initiated at t = 0min before proceeding a subsequent cessation at t = 250min. It’s depicted that under the same flow conditions
 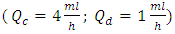 , increasing the dead-volume from 0.5ml to 1ml could provoke a lag of about 60min in order to reach the concentration steady-state and about the same period in the elimination phase. For V=2ml, the time delay before reaching the steady-state and after the drug cessation (before reaching a complete drug elimination) will increase enormously to be about 130min. this demonstrate that, in order to accelerate the administration, the injection of the drug should be as close as possible to the catheter.
  | Figure 6. Influence of the common dead-volume on the time delay provoked at the initiation phase and after the cessation drug delivery for the administration of the smof-lipid in the neonate nutrition fluid.  |
3.4. Variation of the Carrier Flow-Rate after the Drug Infusion Cessation
As cited before, the common dead-volume can serve as a reservoir of drugs which can lead to boluses and incompatibilities problems if a second drug would be infused. In order to avoid these different problems, an elimination of the drug staying in the common dead-volume after the drug cessation is considered as a crucial step. Hereafter, an investigation of the influence of the carrier flow-rate variation after the drug cessation on the drug concentration dynamics is illustrated. This carrier (neonate nutrition fluid) flow-rate variation (acceleration and deceleration) is presented in this study by the ratio  where
where  is the new carrier flow-rate after the cessation of the drug infusion and
  is the initiation steady-state flow-rate. Fixing the common dead-volume at V = 1ml and the steady-state neonate nutrition fluid flow-rate at
  figure 7 shows the effect of the carrier fluid acceleration after the cessation of the smof-lipid infusion on the drug elimination time from the dead-volume.
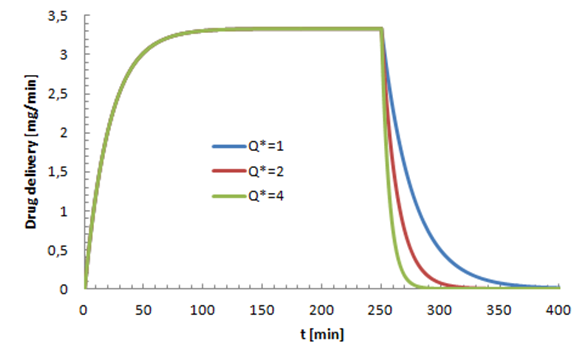 | Figure 7. Influence of the neonate nutrition fluid acceleration on the elimination time of the smof-lipid from the common dead-volume. 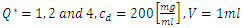 |
It’s depicted from the figure that the acceleration of the neonate nutrition fluid (carrier fluid) just after the cessation of the smof-lipid infusion  leads to a rapid elimination of the drug containing in the dead volume (about 40min for
  vs. 150min for
  In the opposite, a weakening on the neonate nutrition fluid after the cessation of the smof-lipid infusion causes further delay in the elimination of the drug from the dead volume as shown in figure 8. The latter illustrates that after about 150min from the cessation of the smof-lipid infusion, the drug is almost eliminated completely for
  while just 75% of the containing drug is eliminated when the flow-rate ratio is decreased to
 | Figure 8. Influence of the neonate nutrition fluid deceleration on the elimination time of the smof-lipid from the common dead-volume.  |
3.5. Influence of the Flow Conditions on the Head Loss in the IV System Branches
3.5.1. Head Loss Variation in Branches
As mentioned above, the passage of a viscous fluid flow through a pipe provokes a loss of the pressure energy from it inlet to the outlet. The computation of different head losses and inlet pressures of an IV infusion system allows a deep understanding of the syringe pumps work. In this section, a quantification of the head losses in all branches as well as the pressure imposed at different inlets of the IV system is presented. The carrier and drug flow-rate at the initiation phase were fixed as 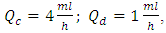 respectively. At t=250min a cessation of the drug infusion has been proceeded. According to the different branches dimensions as well as the physical parameters of the fluids passing through (table 1), figure 9 (a, b) illustrates the variation of the head loss in each branch of the IV system (except the catheter). It’s depicted from the figure 9a that the head loss generated in the branch 1 (from where the carrier fluid “Neonate nutrition fluid” is injected) is keeping constant during time, contrary to the branch 2 containing the drug, where the generated head loss is kept constant up to t = 250min (cessation instant) before it becomes null because of the flow stopping. According to eq.5 and for the physical proprieties of the fluids used in this study (table 1), these behaviors are due to the flow-rate imposed at the inlets which explains the fact that before the drug infusion cessation, the head loss generated in the Neonate nutrition fluid branch (11.88[Pa]) was greater than that in the Smof-Lipid branch (5.07[Pa]).
 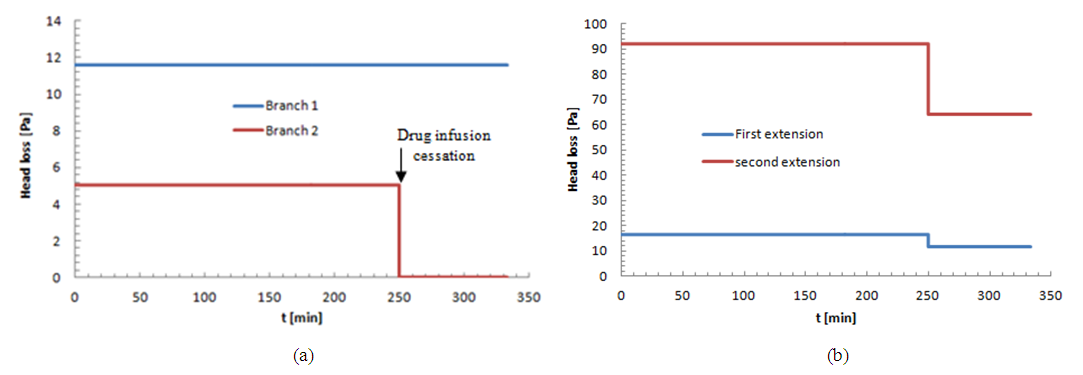 | Figure 9. head losses generated at inlets as well as at the first and second extension tubing of the IV infusion system |
It’s found also that, despite the same tubing dimensions as the inlets branches, the head loss provoked at the first extension tubing (16.68[Pa]) before the drug cessation is greater than both head losses at the inlet branches during the same period. This is principally caused by the increasing of the flow-rate (the sum of the two flow-rates injected from the inlets) passing through the first extension tubing which leads to an increasing of the head loss (eq.5). After the stopping of the drug infusion, it’s demonstrated that the head loss provoked in the first extension tubing is equal to that generated in the branch 1. According to eq.5, this is due to the same flow-rate passing through both branches (branch 1 and first extension) as well as the same dimensions (L=1m and D=1.5mm). The small dimensions (especially the diameter, D=0.55mm) of the second extension tubing situated between the first extension and the catheter push the system to generate a greater head loss before and after the drug cassation (93.7[Pa] and 64.25[Pa], respectively). Arriving to the catheter, the flux encounters an abrupt change of the interior surface corresponding to the very small diameter of the catheter (D=0.17mm). This leads to a provocation of a huge head loss (compared to what obtained for the other branches) before and after the stopping of the drug infusion (20224[Pa] and 14078[Pa], respectively) as presented in figure 10. 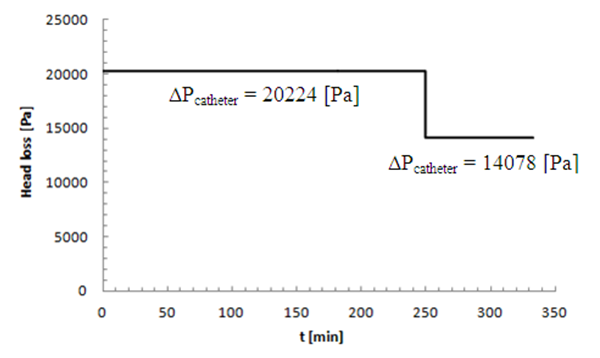 | Figure 10. Head loss generated in the catheter |
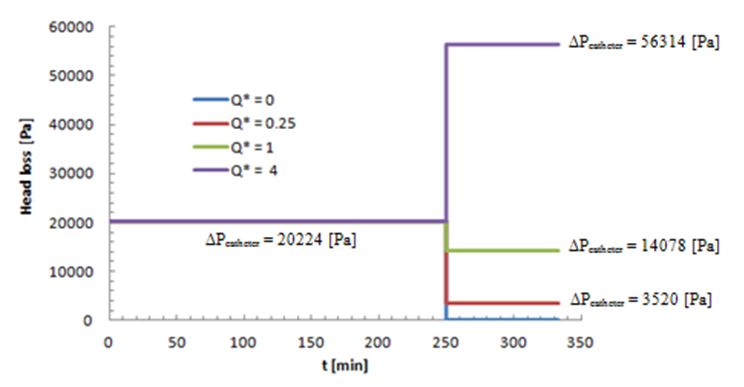
Since the head loss resulted in the catheter is higher than that provoked in all the other branches, in this part of the study, we focused on the influence of the the flow-rate ratio  variation on the head loss generated in the catheter
  where
where  is the new carrier flow-rate after the cessation of the drug infusion and
  is the initiation steady-state flow-rate). Figure 11 depicts that the new carrier flow-rate
  has a direct influence on the head loss provoked in the catheter (like all the other branches).As found before, for
  the head loss decreases just after the drug cessation which is due to the decreasing of the flow-rate passing through the catheter (missing the drug flow-rate). The head loss could be weaker if
  as shown for
  in figure 11. On the other hand, for
  the head loss would be higher like presented for
 | Figure 11. Head loss generated in the catheter in function with  |
3.5.2. Pressure Variation at the Inlets
Depending on the head loss calculated in each branch of the IV system, our analytical model is able to calculate accurately the different pressures that should be imposed at the inlets of the infusion system taking into account the flow-rates prescribed by healthcare teams (clinicians and nurses), the physical parameters of fluids used in the process and the dimensions of the tubing. While fixing the outlet pressure at P=0[Pa], figure 12 (a, b) presents histograms depicting the pressure values imposed before and after the drug cessation, respectively, at the inlet (1) of the Neonate nutrition fluid (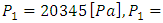
 ) and the other imposed at the Smof-Lipid inlet (2) (
 ). These pressures are those that should be exerted by syringe pumps in order to inject the desired flow-rate through each branch.
 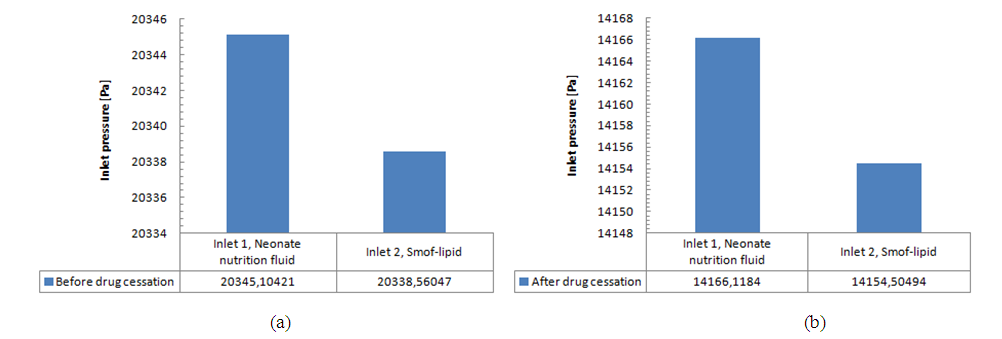 | Figure 12. Pressures imposed at the inlets corresponding to the programmed flow-rates |
As cited above, these pressure values could vary if we change the fluids used in the study. Under the same flow conditions  and for the same IV infusion configuration (figure 4), pressure values at the inlets were calculated using water as a carrier fluid and dyed water as a drug (physical proprieties are cited in table 1). Figure 13 (a, b) shows that a significant difference in the imposed pressure at the inlets is remarked before and after the drug cessation. This is due mainly to the difference in the viscosity of the used fluids which influences directly, according to eq.5, on the head loss and so on the pressure values at the inlets when the outlet pressure is always fixed (
 in our study).
  | Figure 13. Influence of the used fluids on the imposed pressure at the inlets of the IV infusion system |
The variation of the pressure from the inlets to the outlet of the IV system for two different fluids (Neonate nutrition fluid and water) is presented in figure 14 (a, b) for the two phases (before and after the drug cessation). The same behavior is remarked for both cases. A very slight variation of the pressure is observed from the inlet until the end of the second extension tubing (inlet of the catheter). After that, a strong fall is remarked from the inlet of the catheter to the outlet of the IV system. This behavior is due, principally, to the huge head loss provoked in the catheter due to its very small dimensions (D=0.17mm) as cited before.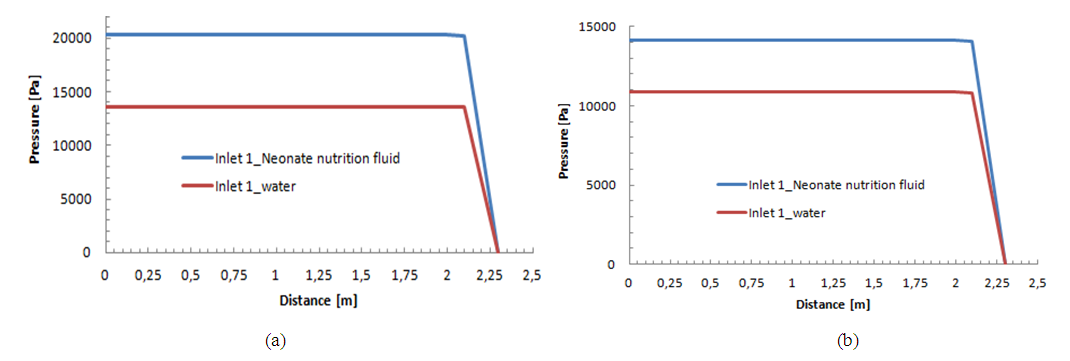 | Figure 14a. Influence of the physical proprieties of the carrier fluid on the pressure variation from the inlet 1 to the outlet f the IV infusion system; a) Before the drug cessation; b) after the drug cessation |
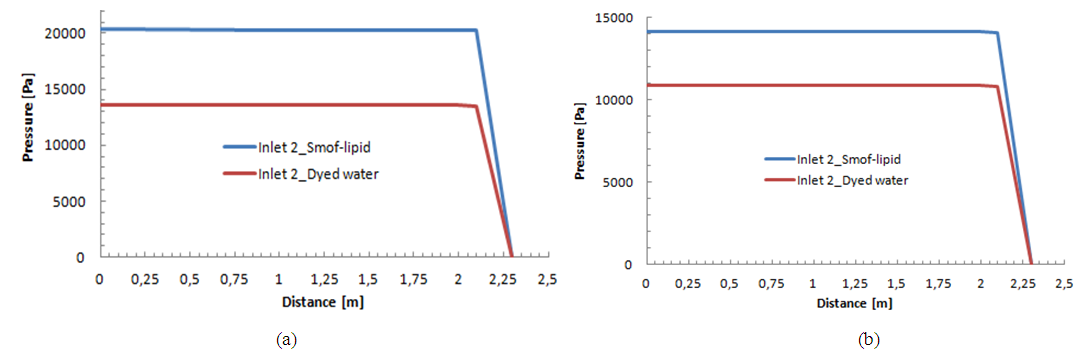 | Figure 14b. Influence of the physical proprieties of the drug on the pressure variation from the inlet 2 to the outlet f the IV infusion system; a) Before the drug cessation; b) after the drug cessation |
4. Conclusions
In this work, two studies have been carried out.The first was about the influence of different factors encountered in a real IV infusion system like the common dead-volume V, the cessation of the drug delivery as well as the variation of the carrier flow-rate after the drug cessation on the dynamics of the Smof-Lipid concentration 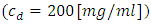 transported in the Neonate nutrition fluid. For a specific flow conditions
 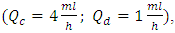 it’s found that in function with the analytical model used to quantify the concentration dynamics of the smof-lipid, and for a common dead-volume of about V = 1.77ml, the necessary time to reach the steady-state and to eliminate the drug after it cessation could vary from 26 min using the Plug-flow model to 104min using the Well-Mixed model. As the plug-flow model does not reflect the real case that could be encountered, the Well-mixed model is used for the extension of the study. It’s determined later that varying the common dead-volume from V = 0.5ml to V = 1ml could provoke a lag of about 60min to reach the steady-state concentration as well as for eliminating the drug quantity contained in the dead-volume after the stopping of the drug injection. This lag could be longer (about 104min) if the common dead-volume is multiplied to be V = 2ml. in this first part of the study, the influence of the variation of the carrier flow-rate
  on the time to eliminate the drug from a dead volume V = 1ml is also investigated. It’s depicted that the more
  is increased, the quicker drug elimination is remarked.The second part of this study was about the effect of the physical proprieties of the used fluids on the head losses and the variation of the imposed pressures at the inlets of the system. It’s depicted that for the same flow conditions
  and a drug cessation proceeded at t = 250min, the head losses provoked before and after drug cessation at the different branches of an IV infusion system using Neonates Fluids (Neonate nutrition fluid as a carrier fluid and the Smof-Lipid as drug) is greater than the head loss generated when the carrier fluid and the drug used are water and dyed water, respectively. According to eq.5, this difference of head losses is due principally to the difference of the physical proprieties of fluids and especially their viscosities. It’s found, in addition, that the pressure which has to be imposed at the inlet of the IV system is greater when we use real neonate fluids than when we use water (which is generally used in lab experimentations). So that, in real infusion process, Syringe pumps need more power to mix biomedical fluids than what’s used for the same purposes in lab experimentations using lab fluids especially water and dyed water.
References
| [1] | Mark Lovich et al., (2017) “Drug Flow Through Clinical Infusion Systems: How Modeling of the Common-volume Helps Explain Clinical Events”. Pharm. Technol. Hosp. Pharm. 2(2): 49–62. |
| [2] | Maurits K. Konings et al., (2017) “Analytical method for calculation of deviations from intended dosages during multi-infusion”. Biomed Eng Online 2017; 16:18. |
| [3] | Robert S. Murphy et al., (2010) “The link between intravenous multiple pump flow errors and infusion system mechanical compliance”. Anesth Analg 2010; 110: 1297–1302. |
| [4] | Mark Lovich et al., (2005) “The impact of carrier flow rate and infusion set dead-volume on the dynamics of intravenous drug delivery”. Anesth Analg; 100: 1048–55. |
| [5] | Aurélie Maiguy-Foinard et al., (2017) “Criteria for choosing an intravenous infusion line intended for multidrug infusion in anaesthesia and intensive care units”. Anaesth Crit Care Pain Med 36. 53–63. |
| [6] | Haobo Ma et al., (2011) “Quantitative analysis of continuous intravenous infusions in pediatric anesthesia: safety implications of dead volume, flow rates, and fluid delivery”. Pediatric Anesthesia 21, 78–86. |
| [7] | Mark Lovich et al., (2006) “The Delivery of Drugs to Patients by Continuous Intravenous Infusion: Modeling Predicts Potential Dose Fluctuations Depending on Flow Rates and Infusion System Dead Volume”. Anesth Analg; 102: 1147–53. |
| [8] | Michael J. Parker et al., (2015) “Computer Control of Drug Delivery by Continuous Intravenous Infusion”. Anesthesiology; 122:647-58. |
| [9] | Michael J. Parker et al., (2017) “Novel Pump Control Technology Accelerates Drug Delivery Onset in a Model of Pediatric Drug Infusion”. Anesthesia & Analgesia, Volume 124, Number 4, pp. 1129-1134(6). |
| [10] | Roland A. Snijder et al. (2016) “Dosing errors in preterm neonates due to flow rate variability in multi-infusion syringe pump setups: An in vitro spectrophotometry study”. European Journal of Pharmaceutical Sciences 93, 56-63. |
| [11] | Lannoy D et al., (2012) “The impact on drug mass flow rate of interrupting and resuming carrier fluid flow: An in vitro study on a very low dead space volume infusion set”. Anesth Analg; 114: 328–332. |
| [12] | Di Simone E et al., (2018) “Prevention of medication errors during intravenous drug administration in intensive care units: a literature review”. Recenti Progressi in Medicina, 109(2): 103-107. |
| [13] | Márquez-Hernández VV et al., (2019) “Factors related to medication errors in the preparation and administration of intravenous medication in the hospital environment”. PLoS One, 14(7): e0220001. |
| [14] | Mariann M. Harding et al., (2020) “Best Practice for Delivering Small-Volume Intermittent Intravenous Infusions”. Journal of infusion nursing: the official publication of the Infusion Nurses Society 43(1): 47-52. |
| [15] | John R. Lake et al., (2017) “Low-cost feedback-controlled syringe pressure pumps for microfluidics applications”. PLoS ONE 12 (4). |
| [16] | Xinjie Zhang et al., (2020) “A portable plug-and-play syringe pump using passive valves for microfluidic applications”. Sensors and Actuators B: Chemical 304, 127331. |

 Abstract
 Reference
 Full-Text PDF
 Full-text HTML