Mostafa Brik1, Souad Harmand1, Mony Girault2, Anne-Laure Metz2, François Rochiccioli2, Fabrice Lapeyre3, Jérome Clarysse3
1LAMIH UMR CNRS 8201, Département de Mécanique, UPHF, Le Mont Houy, Valenciennes, France
2VYGON, 8 Rue de Paris, Ecouen, France
3Centre Hospitalier de Valenciennes, Département Néonatalogie, Avenue Désandrouin, Valenciennes, France
Correspondence to: Mostafa Brik, LAMIH UMR CNRS 8201, Département de Mécanique, UPHF, Le Mont Houy, Valenciennes, France.
| Email: |  |
Copyright © 2020 The Author(s). Published by Scientific & Academic Publishing.
This work is licensed under the Creative Commons Attribution International License (CC BY).
http://creativecommons.org/licenses/by/4.0/

Abstract
In this paper, we investigate the impact of physical properties as well as geometric parameters on the management of a single-phase flow of water and smof-lipid, respectively, in a multiple infusion connector system composed of four inlets and one outlet with an intermediate fluid collector (figure 2). This configuration is encountered mainly in intravenous (IV) infusion systems used in pediatric therapy. For a laminar, steady and incompressible flow, numerical simulations were conducted using the CFD software COMSOL Multiphysics for a maximum Reynolds number ratio varies from 0.24 to 240 ( and
and  are kept constant in this work, this makes the Reynolds ratio
  ). The numerical approach adopted in this study was validated with an analytical model (in-house code) developed on MATLAB. In the first part of this study, results reveal that while three of the injected flow-rates are kept constant, the more the flow-rate injected from the forth inlet is higher, the more the head loss provoked at the outlet branch together with the fluid collector is stronger. It’s also found that under the same flow conditions (Re1 ≈ 240 corresponding to Q1 ≈ 1000 ml/h), the flow of the smof-lipid is more stabilized than that of water. This is mostly due to the higher viscosity of the smof-lipid comparing to that of water which minimizes the spirals generation at the outlet of the collector. For Re1 ≈ 240, it’s determined that the fluid separation at the outlet of the collector is intense and causes a huge pressure drop. This behavior is became less intense when a smoothing of 1mm is applied at the singularity of the collector, and clearly missed when the applied smoothing is up to 3.5mm (figure 12). At the end of this study, an investigation of the impact of the presence of a catheter on the head loss generated at the outlet branch as well as on the pressure inlets of the system is presented. It reveals that because of the small dimensions of the catheter especially his diameter (D = 0.17mm), a great difference is remarked in term of head losses and inlets pressure comparing to what is found without using a catheter.
Keywords:
Drug infusion therapy, Bio-fluid dynamics, Fluid management, Comsol Multiphysics
Cite this paper: Mostafa Brik, Souad Harmand, Mony Girault, Anne-Laure Metz, François Rochiccioli, Fabrice Lapeyre, Jérome Clarysse, Computational Analysis for the Influence of Physical Properties and Geometric Parameters on the Management of a Single-Phase Flow in a Multiple Infusion Connector System, American Journal of Biomedical Engineering, Vol. 10 No. 2, 2020, pp. 44-54. doi: 10.5923/j.ajbe.20201002.03.
1. Introduction
Management of fluid flow is widely investigated in Pharmaceutical, biological and medical applications. In the former, it plays an enormous role where fluidic systems are essential for the validation of new molecules and drugs which is based mainly on the achievement of their new physical properties [1-3]. One of the principal lab applications of fluidic networks is the manipulation of dispersed multiphase flows. For that, the small-scale of the branches have led to a better control of small-sized bubbles and droplet which can be used later for studying fast organic reactions, production of small scale-particles and the creation of emulsions and foams [4-9]. For the continuous multiphase flows, such systems bring also new capabilities, especially for mixing substances encountered in chemical and biomedical applications [10-12]. In medicine, fluid flows is often encountered in different networks used in operating rooms for delivering drugs with very weak flow-rates or blood transmission in surgeries [13]. In neonatal nursing, fluidic networks are present in IV infusion systems that are utilized for feeding patient babies and supplying drugs with adjustable flow-rates [14]. In order to set up a network used in an IV infusion purposes, different components are used such as: simple branches, filters, valves… etc. In order to compose a system of two branches and one outlet, T, Y and specific junctions are often used. For more than two branches, different systems are used to connect each other such as: stopcock systems (multi-branches), multiple infusion connector system or multiline infusion vehicle [15]. Comparing the performance of the two former systems, it was found that using the conventional stopcock system could provoke a significant delay in delivering drugs than the multiple infusion connector system [16]. A precise administration of drugs with an IV infusion system is not depending just on the connection system used to link branches to each other; it depends also to how the fluid flow is controlled within the branches. Syringe pumps, peristaltic pumps and pressure controllers are the most common systems used for controlling flows in networks [17]. Due to their simplicity and their low price compared to the other flow control systems, syringe pumps are the most used for fluid management assays [18]. For better responsive, pulseless and stable flows, pressure controllers are preferable by researchers for lab experiences [18]. With the increasing efforts at developing functional micro-pumps, pressure driven flow is also amenable to miniaturization [19]. Several experimental studies have been performed recently in order to gather the advantages of syringe pumps and pressure controllers by proposing a feedback control of the pressure at the inlets of microfluidic systems [20]. It’s found that the latter could offer several capabilities such as: high flow stability and setup simplicity for low price comparing to other ordinary flow control methods cited above, together with a precise control of the interface position of two laminar flows, fine droplet generation, and particle manipulation [20]. Generally, in emergency cases, it’s paramount to administrate some substances and fluids as quickly as possible to the patient baby while other drugs and substances are passing with weak flow-rates. In such particular conditions the healthcare teams are missing the insurance if that the drugs injected with weak flow-rates have been correctly administrated to the patient or not. This makes it important to study the behavior of the fluid flow within the different component of the infusion network. Focusing on the multi-infusion connector (shown in figure 1), a series of numerical simulations are performed in this work to study the management of a steady single-phase flow in the range of maximum Reynolds number ratios Re* varies from 0.24 to 240 Corresponding to Q1 ≈ 1 to 1000ml/h). Keeping three of the injected flow-rates constant  we first investigate the influence of the flow-rate injected from the inlet 1 in one hand, on the head loss provoked at the outlet branch composed of the collector and the outlet pipe and in the other hand on the fluid separations and the returning flows caused by the hard increasing of the flow-rate in one branch while keeping the other flow-rates constant. After that, we study the impact of the fluid viscosity on the fluid separation at the outlet of the collector as well as on the head loss at the outlet branch. Focusing on the case where
  = 1000ml/h, we’ve determined how the form of the collector could minimize and eliminate the remarkable fluid separation, returning flows in the other branches where the weak flow-rates are injected. For that, we’ve applied a smoothing of 1mm and 3.5mm to the singularity of the collector and carried out numerical simulations for each case. At the final section of this work, the influence of adding an extender and a catheter to the configuration on the head loss generated in the outlet branch (outlet pipe + extender + catheter) as well as on the pressures that should be imposed at the inlets is investigated.
2. Description of the Numerical Model
2.1. Geometric Configuration
Figure 1 presents a descriptive of different venous access and multiple connectors used to set up an infusion network [21]. As cited above, we focus in this study on the multi-infusion connector which used mainly to connect multiple branches containing different drugs and solutions and injected with different flow-rates. 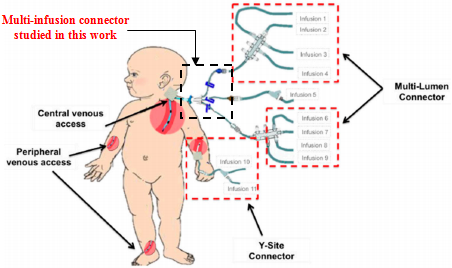 | Figure 1. Example of venous access and multiple drug administration devices [21] |
As shown in figure 2, the geometric configuration used in the study is presented by a 3D multiple infusion connector system composed with four inlets, a liquid collector which gathers different fluids injected before rejecting the mixture through an outlet branch. All the inlet branches have the same diameter  = 1.5mm, while the outlet branch has a diameter
  = 1.75mm. In order to insure that the inlets flows have reached the steady state before getting to the collector, their length L1-4 are chosen to be many times their diameter
  The length of the outlet branch L5, is taken as
  = 30mm.
 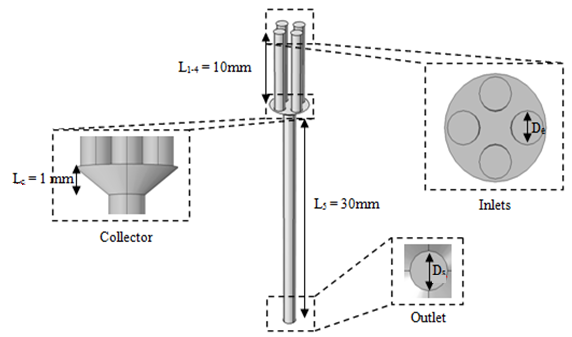 | Figure 2. Isometric and face views of the 3D geometric configuration used in the numerical study |
2.2. Equations Governing the Problem and Boundary Conditions
The numerical resolution of the single-phase flow in pipes is based mainly on the obtaining of the velocity field and pressure distribution in the computational domain. Without taking into account the buoyancy and gravity forces, and for a laminar, steady and incompressible flow, Comsol Multiphysics 4.3a CFD software is used to resolve the mass conservation as well as the momentum equations (Navier-Stokes) for 3D cylindrical coordination. The specific resolved equations are given as follows: Continuity equation: | (1) |
Conservation equation of momentum: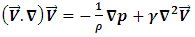 | (2) |
The flow of a fluid through a pipe can be characterized by the Reynolds number “Re”, defined as: | (3) |
Where  and D represent the fluid velocity, density, pressure, kinematic viscosity and channel diameter, respectively.According to the utility, various boundary conditions are used in this study. A non-slip condition was imposed at different walls of the geometry, while the velocity inlet condition has been imposed at the inlet of the branches. At the exit of the outlet branch, the outlet pressure condition (P = 0) has been fixed.
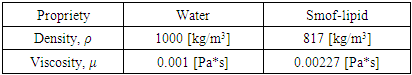
 Table 1. Shows the physical properties of the fluids used in this study (water and smof-lipid)
 |
| |
|
Table 1: physical proprieties of the fluids used in the simulations.
3. Results and Discussion
3.1. Grid Independence Test
Preliminary numerical simulations were carried out in this study to get the optimum number of grids for the computation domain. This will insure the mesh independency of the numerical solution. Three different mesh densities, whereby the number of grids ranges from 277000 to 2297352, are tested for the studied configuration. Figure 3 shows an irregular mesh that can be created for the numerical study using Comsol Multiphysics 4.3a. The dimensionless velocity obtained for each grid number is presented in figure 4. As can be seen, as the number of cells increased, numerical results became more and more accurate and close to each other. For a number of grids between 900000 and 2300000, the numerical solution does not relatively change but the computational time increases significantly. So that, in order to optimize the computational time as well as the memory power of the machine, a mesh grid number of 1126690 cells is used for further simulations in this study. 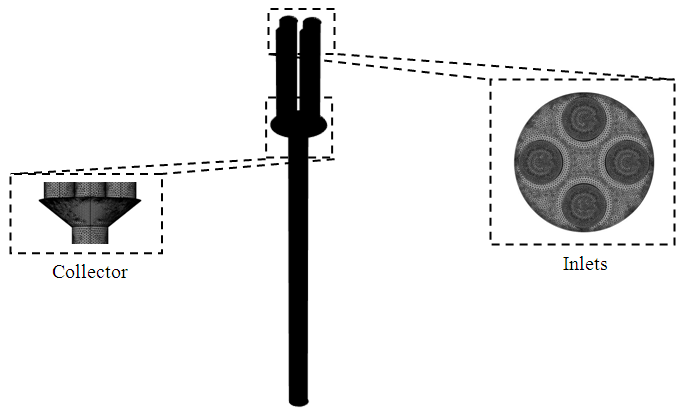 | Figure 3. Created mesh used for the 3D numerical study |
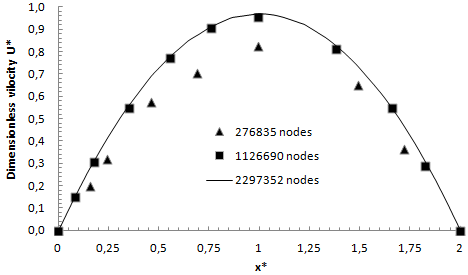 | Figure 4. Velocity profile at the middle line of the confluence pipe in function with different mesh size |
3.2. Model Validation
In order to validate our model, numerical results were compared to analytical results obtained from an in house code. The letter has been worked out on MATLAB in order to study the fluid flow inside microfluidic networks. Therefore, different flow parameters can be obtained analytically with the in-house code, such as, velocity profile, pressure distribution and the head loss generated in different branches of the network. The validation was realized for a laminar fluid flow passes through the outlet pipe of the configuration, with a Reynolds number in the range of Re = 41. Figure 5 shows the dimensionless velocity profile along the middle line at the outlet of the confluence pipe obtained numerically and analytically. As can be seen from the figure, good agreement is observed between different results. A very slight deviation was remarked for the dimensionless velocity at the centerline (at x*=1, U* (analytical) = 2, and U* (numerical) = 1.97), which might come from numerical errors due to the chosen numerical scheme used in the elaborated model. 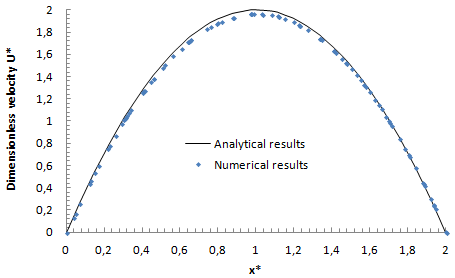 | Figure 5. Comparing between dimensionless numerical and analytical velocity profiles along the middle line at the outlet |
Thereafter, the study was extended in order to investigate the influence of different flow parameters like: the imposed flow-rate at the inlets, the viscosity of the used fluid as well as other geometric parameters on the behavior of the single-phase fluid flow within the studied configuration.
3.3. The Variation of the Injected Flow-Rate
In many real cases encountered in intravenous infusion systems, the flow-rate injected from the inlets undergoes some variation in order to administrate or eliminate drugs. In order to study the effect of this variation on the fluid flow (water) behavior within the studied configuration, a series of numerical simulations have been carried out. Fixing a constant injected flow-rate at three inlets 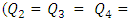
 the variation of the flow-rate has been applied just at the inlet 1. Several flow-rates have been used;
  = 1, 50, 200 and 1000ml/h. Figure 6 illustrates the behavior of the fluid flow at the exit of the collector. As can be observed, the more the flow-rate imposed at the inlet 1 increases, the more the fluid tends to escape faster from the collector. It’s also illustrated that the fluid separation becomes more and more remarkable for higher flow-rates
 | Figure 6. Velocity fields at the collector in function with  the injected flow-rate at the inlet 1 the injected flow-rate at the inlet 1 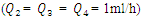 |
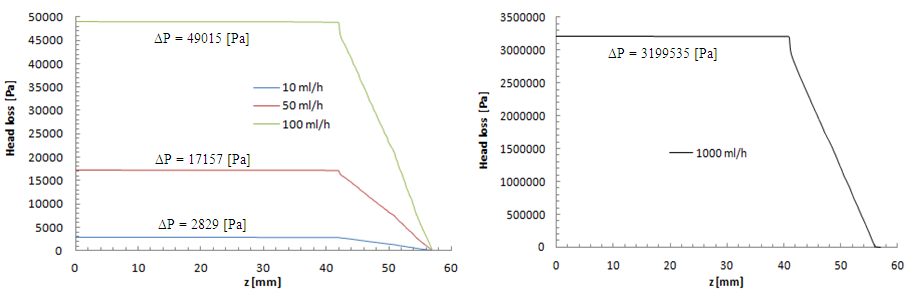
This behavior is considered as an additional source of the pressure drop provoked by the fluid passage through the branch. Figure 7 depicts the influence of the increasing of the flow-rate injected from the inlet 1 on the total head loss generated at the outlet branch (the sum of minor and major head losses from the collector to the exit of the outlet branch). As presented in the figure, the total head loss at the outlet branch is impacted directly by the variation of the flow-rate injected from the inlet 1 (from 0.15 [Pa] for  = 1ml/h to 48 [Pa] for
  = 1000ml/h).
 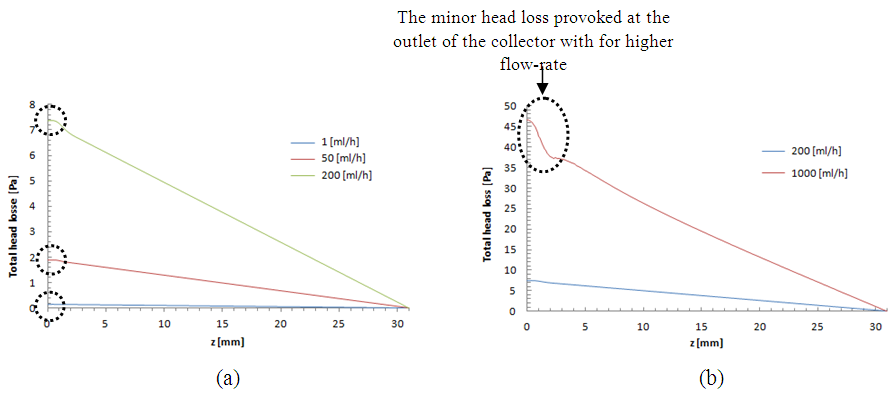 | Figure 7. Total head losses provoked at the outlet branch in function with the flow-rate imposed at the inlet 1;  = 1ml/h; 50ml/h; 200ml/h and 1000ml/h = 1ml/h; 50ml/h; 200ml/h and 1000ml/h |
It’s shown likewise that for weak variations of  (between 1ml/h and 200ml/h), the minor head loss generated by the passage of the fluid through the collector stills relatively small (from 0 to 0.6 [Pa], as illustrated in the framed parts), contrary to the case where
  takes high values (
 = 1000ml/h). The fluid flow, in this case, provokes relatively a significant minor head loss (framed part) as illustrated in figure 7b (about 10 [Pa]). In addition to that, applying a higher flow-rate at the inlet 1 causes other serious problems for the fluid management within the studied infusion connector system. Figure 8 demonstrates the velocity arrows (8a and 8b) at the adjacent inlets (inlet 2, 3 and 4 in figure 2) and streamlines (8c) at the outlet of the collector for
  = 1000ml/h. It’s proved from figure 8a that for such high flow-rate, the fluid 1 (injected at inlet 1) is entering and returning through inlets 2, 3 and 4 provoking a blockage of the fluid injected there.
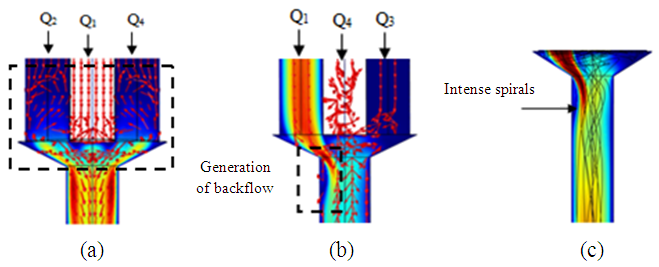 | Figure 8. Effect of the higher flow-rate injected from the inlet 1 ( = 1000ml/h); a) fluid returning provoked at the adjacent branches (2, 4); b) fluid separation and blockage of the branch 3; c) spirals generated at the outlet of the collector = 1000ml/h); a) fluid returning provoked at the adjacent branches (2, 4); b) fluid separation and blockage of the branch 3; c) spirals generated at the outlet of the collector |
Such issue leads to wrong estimations of drug quantities administered using the multiple infusion connector system when a high flow-rate is injected in one inlet. Figure 8b depicts that fluid separation at the outlet of the collector causes a generation of backflows (framed part) which generates further head losses as presented above. On the other side, the fluid instability allows to product strong spirals at the outlet of the collector which could cause some structural problems to the interior surface of the outlet branch due to the higher shear stress generated by the spiral.
3.4. Effect of the Fluid Viscosity
As cited above, two fluids have been used in this study, water and smof-lipid, where their physical properties are listed in table 1. As many problems have been remarked in the previous part for  = 1000ml/h, we’ve focused in this part on the influence of the fluid viscosity on the head loss generated in the outlet branch as well as in the inlet branches under this flow condition (
 = 1000ml/h). Figure 9 illustrates the variation of the dimensionless total head loss along the outlet branch in function with the fluid used in the study (water and smof-lipid). It’s shown that the pressure drop behavior of the smof-lipid is smoother than that of water. The latter undergoes a strong pressure drop just after the outlet of the collector (framed part) before taking back it pace and stabilizing along the remaining part of the outlet branch. In contrast, the smof-lipid flow generates a stabilized head loss from the collector to the exit of the outlet branch. The deference between these behaviors is due to the intensity of spirals generated at the outlet of the collector for both fluids. From figure 10, it’s observed that the flow instability (spirals) is presented significantly in the water flow comparing to the smof-lipid and this is caused principally by the fact that the smof-lipid is more viscous than water, which makes it separation at the outlet of the collector less strong and generates less intense spirals leading to a smooth head loss behavior.
 | Figure 9. Variation of the dimensionless total head loss in the outlet branch in function of the used fluid (water and smof-lipid) |
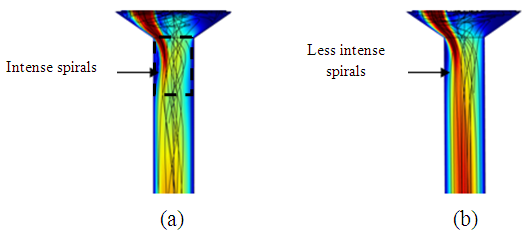 | Figure 10. Spirals generated at the outlet of the collector; a) water; b) smof-lipid |
As discussed above, the application of high water flow-rate  = 1000ml/h has provoked a fluid rising and returning in the adjacent inlet branches which leads to an intense blockage and stagnation of the flow comes from them. In the following, the effect of the fluid viscosity on the fluid rising and returning as well as on the head loss provoked in the inlets branches has been investigated. Figure 11a shows clearly the fluid 1 passing through branches 2 and 4 and returning there (framed part in figure 11a). This provokes a blockage of the passage of fluids that supposed to be injected through these branches. On the other side, figure 11b presents the smof-lipid behavior under the same flow conditions
  = 1000ml/h, where a very small fluid quantity is passing through adjacent branches and a very slight blockage is provoked (framed part in figure 11b).
 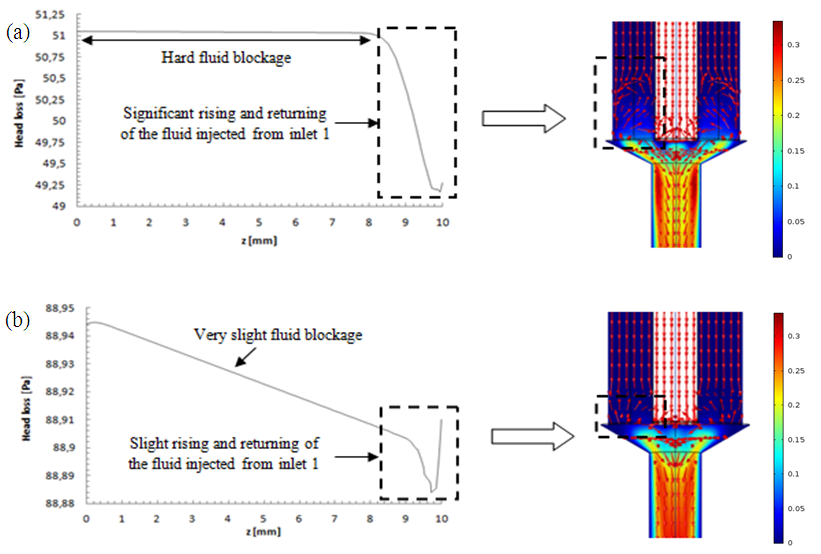 | Figure 11. Influence of the higher flow-rate injected from inlet 1 ( = 1000ml/h) on the blockage provoked at the adjacent inlets (inlets 3 and 4) for two used fluids; a) water; b) smof-lipid = 1000ml/h) on the blockage provoked at the adjacent inlets (inlets 3 and 4) for two used fluids; a) water; b) smof-lipid |
3.5. Effect of the Fluid Collector Form
In order to examine the influence of the form of the fluid collector on the head loss generated in the outlet pipe as well as on the inlet branches, a series of numerical simulations have been carried out. Keeping the same branches dimensions as used in the previous section, three forms of the collector have been utilized (figure 12). 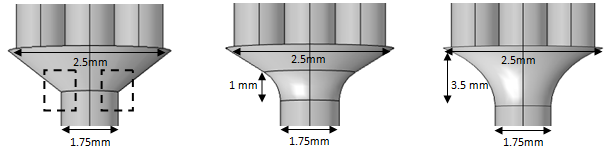 | Figure 12. Different fluid collector forms used in the numerical simulations |
The first is the original one that is used before, the second and the third forms have undergone a smoothing of 1mm and 3.5mm, respectively. For a water flow-rate  = 1000ml/h, figure 13 presents the variation of the dimensionless head loss along the outlet branch for the three collector forms. It’s shown that without smoothing the singularity (framed parts in figure 11), instability is remarked in the behavior of the head loss provoked at the outlet of the collector. In contrast, other forms where a smoothing of 1mm and 3.5mm is respectively applied show more stability in term of head losses. This is mainly due to the changes on the form that undergone the singularity at the outlet of the collector which lead to a better absorbing of the fluid impact and minimizing the fluid separation intensity before mixing with other fluids and going out through the outlet branch.
 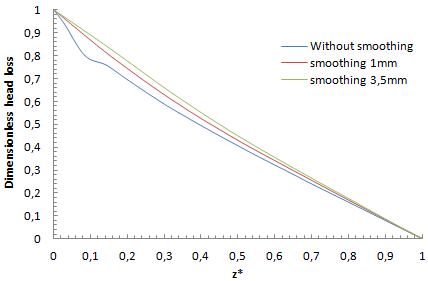 | Figure 13. Variation of the dimensionless head loss along the outlet branch using water |
Figure 15 presents the pressure cartography which illustrates the fluid impact on the collector for each form shown above (figure 12). It’s depicted that without using any smoothing, fluid impacts strongly on the collector which generates backflows at the outlet of the collector what is illustrated by the negative pressure in figure 15a. It’s depicted that the fluid impact weakens when the singularity of the collector is smoothed with 1mm and weakens more and more when it smoothed with 3.5mm. It’s also proved that smoothing the collector with 1mm allows minimizing the backflow provoked at the outlet (figure 15b) and eliminating it for complete smoothing (figure 15c). Smoothing the singularity of the collector reveals as well an influence on the fluid returning and the blockage of other branches as shown in figure 16. It’s depicted from the top part of the figure that in case of not applying a smoothing of the singularity or for less intense smoothing (1mm), the fluid injected from inlet 1 is intensely returning through the adjacent branches 2 and 4 which provokes a hard blockage and stagnation of the fluid injected through. These behaviors are relatively missed when a significant smoothing (3.5mm) on the collector singularity is applied where the fluid returning is weaker than what was found previously.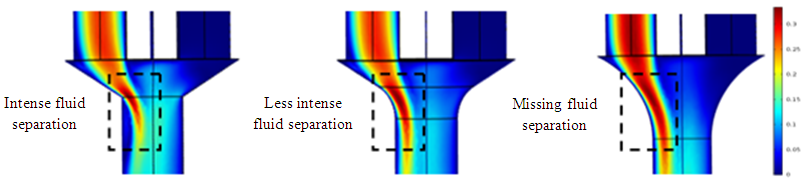 | Figure 14. Velocity cartography illustrating the impact of the singularity smoothing on the fluid separation at the outlet of the collector |
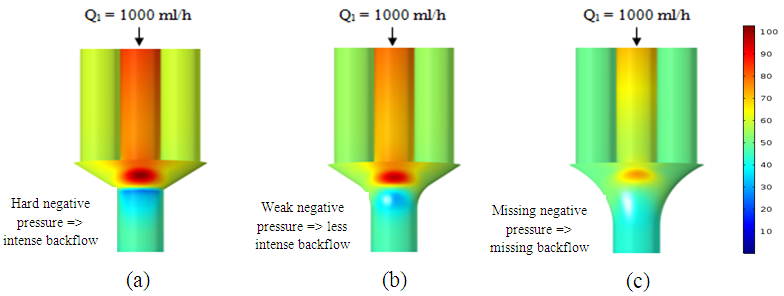 | Figure 15. Pressure cartography illustrating the higher fluid flow impact on the collector |
Moreover, the figure 16 (bottom) illustrates that comparing to branches 2 and 4, and because it’s further from the inlet 1, a very slight returning and blockage is remarked at the branch 3 when the singularity is not or smoothed with 1mm. In contrast, when the collector singularity is smoothed with 3.5 mm, the blockage and the fluid returning is missed. 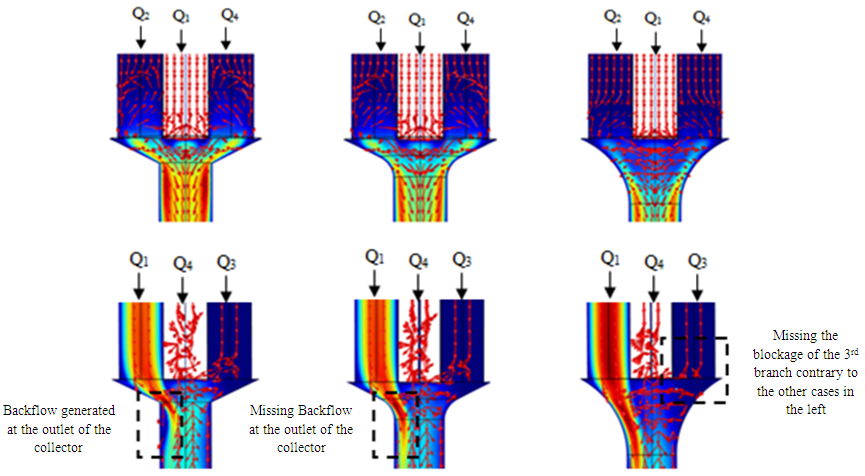 | Figure 16. Velocity arrows showing the fluid returning and branches blockage depending on the form of the collector |
3.6. Presence of the Catheter
In this section, we investigate the influence of the presence of a catheter on the head loss provoked at the system as well as on the pressures applied at the inlets. Figure 17 presents the new configuration used in this study which composed of the previous one connecting to a new part containing two branches; the first is an extender of  = 10mm and
  = 0.55mm, and the second is a catheter of
  = 15mm and
  = 0.17mm. As new parts are added to the preveous configuration, the meshing that applied to this new geometry is increased to be about 1380625 nodes. The influence of adding the new parts on the head loss provoked at the outlet branch which is, so, composed of three parts (Branch 5 + extender 6 + catheter 7) is presented in figure 18. As depicted in the preveous section (without using the catheter), the head loss is strongly impacted by the flow-rate imposed at the inlet 1.
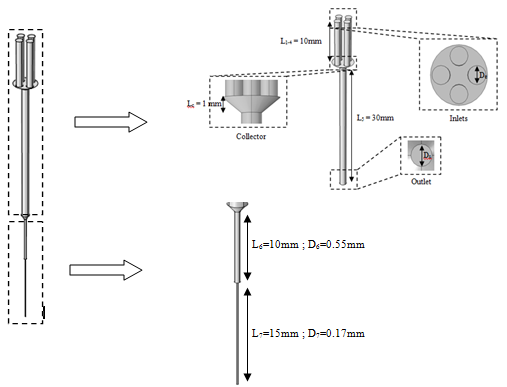 | Figure 17. New configuration used in the second part of the study |
 | Figure 18. Head loss provoked at the outlet branch (Branch 5 + extender + catheter) |
Comparing to what was found preveously without adding the new parts to the configuration, the histogram presented in figure 19 reveals that the pressure that should be imposed at the inlets in order to ensure accuratly the desired flow-rate of  = 10ml/h increases enormously when the extender and the catheter are present (about 2829,4 [Pa] is applied at inlet 1 vs 1,09 [Pa] without using the extender and the catheter). This is caused mainly by the small diameter of the extender and the very small diameter of the catheter which will resist the passage of the fluid through it and so, the system needs much more energy (Pressure) to garantee the continuity of the flux.
 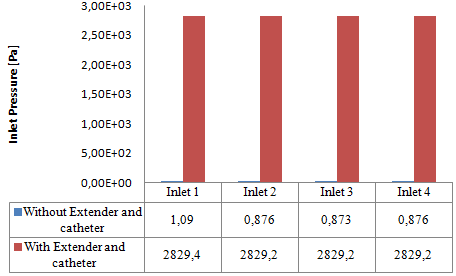 | Figure 19. Pressures applied at the inlets of the system depending on the using of the extender and the catheter |
The influence of the flowing fluid viscosity on the head loss generated in the outlet branch (Branch 5 + extender + catheter) is depicted in figure 20 for different flow-rates imposed at the inlet 1 ( = 10, 50, 100 and 1000ml/h). Fluids used herein are water and smof-lipid where the physical properties are cited in table 1. It’s shown that the maximum head loss ratio
 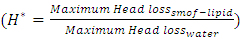 decreases proportionally with the flow-rate imposed at the inlet 1 (from
  = 2.21 for
  = 10ml/h to
  = 1.34 for 100ml/h). For a very high flow-rate
  = 1000ml/h, the head loss provoked for the water flow is greater than that obtained with the smof-lipid flow despite the fact that the viscosity of the latter is greater than that of the former. As proved previously, the higher viscosity of the smof-lipid led it behavior to be more stable which explained the fact that spirals generated by the passage of water through the collector are more intense than that generated by smof-lipid and this provokes a huge minor head losses that will be added to the major head losses. This explains why
  decreases with the increasing of the flow-rate injected from inlet 1.
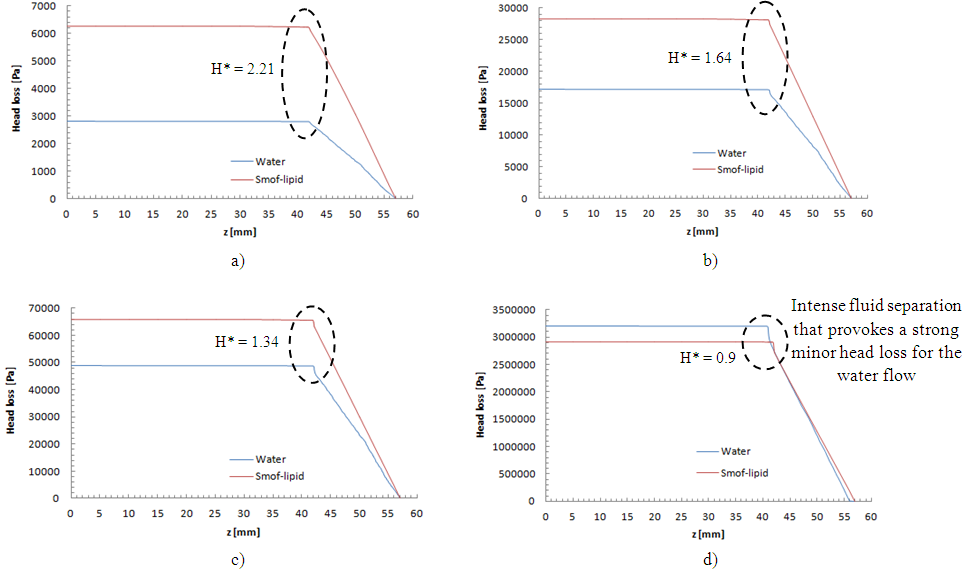 | Figure 20. Evolution of the head loss at the outlet branch (Branch 5 + extender + catheter); a)  = 10ml/h; b) = 10ml/h; b)  = 50ml/h; c) = 50ml/h; c)  = 100ml/h; d) = 100ml/h; d)  = 1000ml/h = 1000ml/h |
4. Conclusions
In this study, the impact of fluid properties and geometric parameters on the total head losses provoked in the outlet branch of a multiple infusion connector system as well as on the pressures that should be imposed at the inlets of the system is investigated. For a range of a maximum Reynolds number ratio Re* varies from 0.24 to 240, numerical simulations were performed for a laminar, steady and incompressible flow. The results are as follows.For the water flow, it’s found that the total head loss in the outlet branch of the system is impacted strongly by the flow-rate that passes through. It’s revealed that the more the flow-rate is greater, the more the minor head loss provoked by the fluid collector is higher. Some flow problems are also appearing like: fluid returning in the other branches which provokes a blockage of these branches and a stoppage of the flow passing through for Re* = 240 corresponding to  = 1000ml/h. This huge minor pressure drops are due mostly to the singularity located at the outlet of the collector which provoke a strong separation of the fluid. Fixing the flow conditions at Re* = 240, it’s depicted that the flow of water generates intense spirals and instabilities at the outlet of the collector, contrary to flow of smof-lipid which is more stable and produces less intense spirals. This is caused by the higher viscosity of the smof lipid which prevents the separation and so decreases the minor head losses. After that, a series of numerical simulations are carried out in order to examine the influence of the smoothing of the singularity on the total head loss at the outlet branch. It’s illustrated that changing relatively the form of the collector by smoothing it singularity with 1mm prevents relatively the water flow separation which allows to diminishing the total head loss as well as the fluid returning and the branches blockage. Furthermore, when a smoothing with 3.5mm is applied, it’s observed that the total head loss is decreased and the other flow problems are missed.In the second part of this work, the impact of adding new elements like an extender together with a catheter to the configuration on the total head loss in the outlet branch (Branch 5 + extender + catheter) is investigated. It’s found that the small diameter of the extender and the very small diameter of the catheter push the system to generate much more head loss than what was found in the first case (without adding the new parts). This means that the pressures that should be imposed at the inlets of the system are greater than what is found in the absence of the extender and the catheter. Finally, comparing between the smof-lipid and the water flow for higher flow-rate imposed at inlet 1 (Re* = 240 corresponding to
  = 1000ml/h), and despite the fact that the smof-lipid viscosity is greater than that of water, it’s remarked that without smoothing the collector singularity, the more the flow-rate imposed at the inlet 1 is increased, the less is the head loss ratio
  This is due mostly the behavior of the smof-lipid that has a higher viscosity than water which led the flow to avoid the separation at the outlet of the collector and generates less intense spirals, contrary to water which undergoes a strong fluid separation at higher flow-rates and produces more intense spirals which provokes a huge total head losses even more than the smof-lipid.
References
| [1] | Sarrazin F. et al., (2006) “Micro-drops approach in micro-reactors: mixing characterization”. LA HOUILLE BLANCHE / N° 3. |
| [2] | Whitesides G. M., (2006) “The origins and the future of microfluidics”. Nature Rev., 442 (7101), 368-373. |
| [3] | Dittrich, P. S. & Manz, A., (2006) “Lab-on-a-chip: microfluidics in drug discovery". Nature Rev. Drug Discov. 5, 210–218. |
| [4] | Gao J. et al., (2001) “Integrated microfluidic system enabling protein digestion, peptide separation, and protein identification”. Analytical Chemistry 73, 2648-2655. |
| [5] | Jiang Y. et al., (2001) “Integrated plastic microftuidic devices with ESI-MS for drug screening and residue analysis”. Analytical Chemistry 73, 2048-2053. |
| [6] | Sia, S. K. & Whitesides, G. M., (2003) “Microfluidic devices fabricated in poly (dimethylsiloxane) for biological studies”. Electrophoresis 24, 3563–3576. |
| [7] | Hatch A. et al., (2001) “A rapid diffusion immunoassay in a T-sensor”. Nature Biotechnology 19, 461-465. |
| [8] | Stone H. A. et al., (2004) “Engineering flows in small devices: microfluidics towards a lab-on-a-chip”. Ann. Rev. Fluid Mech. 36, 381-411. |
| [9] | Kameoka J. et al., (2001) “A polymeric microfluidic chip for CE/MS determination of small molecules. Analytical Chemistry 73, 1935-1941. |
| [10] | Nandigana V. V. R. & Aluru, N. R., (2012) “Nonlinear electrokinetic transport under combined ac and dc fields in micro/nanofluidic interface devices”. ASME J. Fluids Eng. 135, 021201. |
| [11] | Kamholz A. E. et al., (1999) “Quantitative analysis of molecular interaction in a microfluidic channel: The T-sensor”. Analytical Chemistry 71, 5340-5347. |
| [12] | Zhang J. & Luo X., (2018) “Mixing performance of a 3D Micro T-mixer with swirl-inducing inlets and rectangular constriction”. Micromachines 9, 199. |
| [13] | Lovich M. et al., (2017) “Drug Flow Through Clinical Infusion Systems: How Modeling of the Common-volume Helps Explain Clinical Events”. Pharm. Technol. Hosp. Pharm. 2(2): 49–62. |
| [14] | Lovich M. et al., (2005) “The impact of carrier flow rate and infusion set dead-volume on the dynamics of intravenous drug delivery”. Anesth Analg; 100:1048–55. |
| [15] | Maiguy-Foinard A. et al., (2017) “Criteria for choosing an intravenous infusion line intended for multidrug infusion in anaesthesia and intensive care units”. Anaesth Crit Care Pain Med 36. 53–63. |
| [16] | Levi D. S. et al., (2010) “Connecting multiple low-flow intravenous infusions in the newborn: Problems and possible solutions”. Pediatr Crit Care Med. Vol. 11, No. 2. |
| [17] | John R. et al., (2017) “Low-cost feedback-controlled syringe pressure pumps for microfluidics applications”. PLoS ONE 12 (4). |
| [18] | Elveflow.com, MICROFLUIDICS AND MICROFLUIDIC DEVICES: A REVIEW. |
| [19] | https://faculty.washington.edu/yagerp/microfluidicstutorial/basicconcepts/basicconcepts.htm |
| [20] | Young J. H. et al., (2016) “Tuning-free controller to accurately regulate flow rates in a microfluidic network”. Scientific reports 6:23273. |
| [21] | O’Brien F. et al., (2019) “Making medicine baby size: the challenge in bridging the formulation gap in neonatal medicine”. Int. J. Mol. Sci., 20(11), 2688. |

 Abstract
 Reference
 Full-Text PDF
 Full-text HTML