-
Paper Information
- Paper Submission
-
Journal Information
- About This Journal
- Editorial Board
- Current Issue
- Archive
- Author Guidelines
- Contact Us
American Journal of Biomedical Engineering
p-ISSN: 2163-1050 e-ISSN: 2163-1077
2020; 10(2): 29-43
doi:10.5923/j.ajbe.20201002.02
Received: Sep. 28, 2020; Accepted: Oct. 21, 2020; Published: Nov. 15, 2020

A Semi-Automated 2D Segmentation and Classification System to Quantify and Characterize Morphological Features of Golgi-Derived Membrane Structures
 Abstract
 Reference
 Full-Text PDF
 Full-text HTML
Jindaporn Yaothak1, Jeremy C. Simpson2, Linda F. Heffernan2, Yuh-Show Tsai1, Chung-Chih Lin3, 4, 5
1Department of Biomedical Engineering, Chung Yuan Christian University, Taoyuan, Taiwan R.O.C.
2Cell Screening Laboratory, School of Biology and Environmental Science, University College Dublin, Belfield, Dublin, Ireland
3Department of Life Sciences and Institute of Genome Sciences, Taipei, Taiwan R.O.C.
4Biophotonics Interdisciplinary Research Center, Taipei, Taiwan R.O.C.
5Brain Research Center, National Yang-Ming University, Taipei, Taiwan R.O.C.
Correspondence to: Chung-Chih Lin, Department of Life Sciences and Institute of Genome Sciences, Taipei, Taiwan R.O.C..
| Email: |  |
Copyright © 2020 The Author(s). Published by Scientific & Academic Publishing.
This work is licensed under the Creative Commons Attribution International License (CC BY).
http://creativecommons.org/licenses/by/4.0/

The Golgi apparatus plays a key role in the secretory pathway of eukaryotic cells. The exact physiological roles and the molecular mechanism of regulation of dynamics of such membranous structures are not fully understood. According to time-lapse imaging data, Golgi-derived membrane structures are highly dynamic and vary in number and shape, i.e. globules, networks, branches, and tubules. Quantification of such dynamics is crucial for further understanding the mechanism of regulation of this organelle. However, reliable quantification methods for Golgi-derived tubules in living cells have not been established. In this study, we demonstrate a semi-automated and user-friendly method, 2D-GolgiMorphSubtype system, to segment, classify, and quantify Golgi cisternae and Golgi-derived membrane structures. A combination of adaptive local normalization and Otsu’s thresholding methods are used for segmentation of subcellular objects. A total of 34 morphological features are used for classification by supervised machine learning. A bagged decision tree is chosen as a classifier for morphological subtypes. Correlation analysis is used to imply possible conversion between different Golgi tubule morphological subtypes. Our segmentation method was found to have the lowest root-mean square error (RMSE) compared to other segmentation methods. Our system revealed a negative correlation between tubule and Golgi cisternae intensity prior to blink-out, supporting that tubular structures are derived from the Golgi apparatus, and that this can be quantified from live cell movie data. Our system was able to classify seven morphological subtypes of Golgi-derived membrane structures, namely globules, lumps, loops, short, medium, long, and branch types with more than 96% accuracy. Total area, number, and length of morphological subtypes were found to be useful for profiling the dynamics of Golgi-derived membranes from different movies. Negative correlations among morphological subtypes indicate that Golgi-derived membranes may interconvert between subtypes, whereas positive correlations imply that Golgi-derived membranes may be derived from a common source. Therefore, the 2D-GolgiMorphSubtype system is the first system for classification of morphological subtypes of Golgi cisternae and Golgi-derived membrane structures. Morphological features of subtypes are useful for characterization of Golgi tubule dynamics in time-lapse imaging experiments. We believe that our system is suitable for profiling the effects of drugs and gene perturbations on Golgi dynamics, thereby further enhancing our understanding of the molecular mechanisms that regulate membrane function in living cells.
Keywords: Golgi-derived membrane tubules, Rab6A, 2D-GolgiMorphSubtype, Morphological subtypes, Classification
Cite this paper: Jindaporn Yaothak, Jeremy C. Simpson, Linda F. Heffernan, Yuh-Show Tsai, Chung-Chih Lin, A Semi-Automated 2D Segmentation and Classification System to Quantify and Characterize Morphological Features of Golgi-Derived Membrane Structures, American Journal of Biomedical Engineering, Vol. 10 No. 2, 2020, pp. 29-43. doi: 10.5923/j.ajbe.20201002.02.
Article Outline
1. Introduction
- Golgi and Golgi-derived membrane structures serve to sort and transport proteins and lipids to specific subcellular compartments [1]. Defects in regulation of the Golgi apparatus, or its associated transport pathways, are known to be relevant to a variety of diseases [2-4]. For many years, the study of transport pathways from the Golgi apparatus to the Endoplasmic Reticulum (ER) have utilized the drug brefeldin A (BFA), which acts by inhibiting the association of the coat protein complex I (COPI) coat with the Golgi apparatus, and this, in turn, leads to an acceleration of the formation of membrane tubules that can be visualized emanating from this compartment [5]. Although the Golgi apparatus is an organelle that has been intensively studied, the regulation and roles of morphological variants of Golgi-derived membrane structures are not fully understood. Moreover, this organelle also displays a complex set of interactions with both the microtubule and actin cytoskeletons [6-9], which regulate the formation and transport of Golgi-derived membrane carriers of various sizes and shapes [10]. The molecular mechanisms that underlie these phenomena are not fully understood, and one limitation has been the absence of a reliable quantification system for assessing the morphology of Golgi-derived membrane structures.A variety of segmentation methods and detection tools have been developed for the study and quantification of organelle morphology [11]. However, there is no specific tool for the analysis of the unique and complex morphological traits of the Golgi apparatus and Golgi-derived membrane structures. Because mitochondria display similar morphological changes to Golgi-derived membrane structures, e.g. fission and fusion [12,13], and tools for segmentation and classification of mitochondrial morphological changes are developed, their study may provide hints to establish a morphological analysis system for Golgi dynamics. The micro-P [14] and CellProfiler [15] image analysis platforms have been used for 2D mitochondrial morphological analysis, and MitoGraph and micro-P 3D are used for 3D mitochondrial morphological analysis [16,17]. In this study, we have used similar approaches to the micro-P platform for developing and establishing a biologist-friendly and semi-automatic detection system for the specific purpose of classifying and quantifying morphological changes to the Golgi apparatus and Golgi-derived membrane structures upon BFA treatment, as a main objective. This system shows that quantifying the morphological features of Golgi-derived membrane structures has potential for furthering our mechanistic understanding of membrane dynamics in living cells and provides a platform for profiling the behavior of this important organelle.
2. Materials and Methods
2.1. Time Lapse Images of Golgi Cisternae and Golgi-Derived Membrane Structures
- HeLa cells were transiently transfected with plasmids encoding the Golgi-localizing protein Rab6A tagged with enhanced yellow fluorescent protein (EYFP). Rab6A is a small GTPase protein associated with Golgi cisternae and Golgi-derived membranes and is used to visualize these membrane structures. During treatments with BFA, Golgi-derived membrane structures are formed and rapidly relocate to the ER [18]. Confocal image stacks of cells expressing YFP-Rab6A were acquired using an Andor Revolution spinning disk confocal microscope, equipped with a UPLSAPO 100x/1.40 NA oil objective at a frame rate of two frames per second. The microscope generated images with 1000x magnification, with a maximum theoretical optical resolution of 212 nanometers. Six movies were analyzed, and each contained 500 frames, approximately 4 minutes in total length. Each movie had different image sizes (movie 1: 461423 pixels; movie 2: 410490 pixels; movie 3: 320304 pixels; movie 4: 319280 pixels; movie 5: 512366 pixels; movie 6: 474165 pixels) to fit the cells being imaged.
2.2. Semi-Automated 2D Segmentation and Classification System
- The overview of our biologist-friendly system for segmentation and subtype classification of Golgi-derived membranes is presented in Figure 1. The concept is that is designed to be a simple and accurate system for segmentation and subtype classification, and that is should provide the biologist the opportunity to set an appropriate threshold for better accuracy of segmentation. The system is built as a standalone application in MATLAB R2016a software using a 64-bit Windows operating system. In brief, a low pass Gaussian filter was applied before the segmentation of Golgi-derived membranes (Fig. 1a). Golgi-derived membrane structures are segmented (Fig. 1b). Morphological features of the Golgi tubules were calculated (Fig. 1c) and used for the next processing step of expert-based grouping (Fig. 1d) and automated classification of subtypes of Golgi-derived membranes (Fig. 1e). Outputs by this system are exported as image, video, and MS Excel files for further analysis (Fig. 1f).
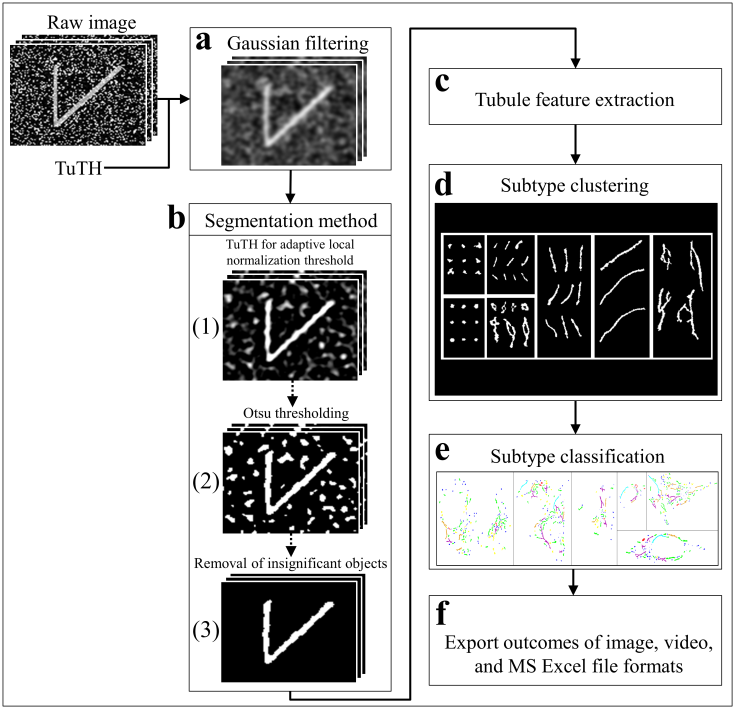 | Figure 1. Golgi tubule detection and subtype classification system. Stack of raw images of simulated tubules is generated. Gaussian noise and impulse noise are added to test inference of background noises on segmentation by our system and other conventional methods (see S1 Table and S2 Figure). a A low pass Gaussian kernel filter is applied to avoid over-segmentation. b(1) Output after filtering is segmented by adaptive local normalization thresholding (ALNT), which generates a sharp edge and clear boundary of the object. b(2) The ALNT-processed images are converted to binary output by Otsu’s method. b(3) The tubule outputs after removal of insignificant objects are the final outputs of segmentation. Morphological features of Golgi-derived membrane structures are calculated (c) and are applied to identify gold standards of morphological subtypes (d). e The gold standards are applied to train classifiers. The best classifier for tubule subtyping is performed by 10–fold cross-validation. f Results are saved as binary and RGB image stack files after segmentation and subtype classification and MS Excel files for offline use |
2.2.1. Segmentation Methods of Golgi Cisternae and Golgi-Derived Membrane Structures
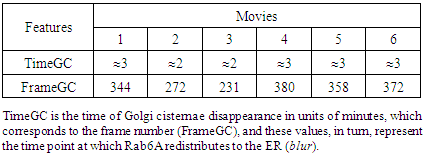
- According to the raw movie image data, Golgi cisternae appear as brighter objects compared to the Golgi-derived membranes, and the Golgi cisternae were therefore detected at a threshold of 0.4% top maximal intensity prior to them disappearing following BFA treatment. “Time of disappearance” is represented as the time point at which Rab6A redistributes to the ER (generally referred to as Golgi blinkout; blur). In Table 1, TimeGC corresponds to the frame of Golgi disappearance (Table 1, FrameGC). Although many methods of segmentation for intracellular organelles are available, the most accurate method for tubular structures is considered to be Adaptive Local Normalization Thresholding (ALNT; [19]), which is the segmentation method for mitochondria [14]. The ALNT performs a calculation of statistical variance in window size, which assesses pixel brightness of the object region and its surrounding background, to detect the localization of the object. Therefore, we applied this well-known and efficient method used in mitochondrial segmentation to segment the Golgi tubules in this study. Moreover, we found that the most accurate segmentation method for these Golgi tubules was found to be the ALNT combining with the Otsu’s method [20], as representative test results shown in Fig. 1b.
|
2.2.2. Classifiers for Profiling Various Golgi-Derived Membrane Structures
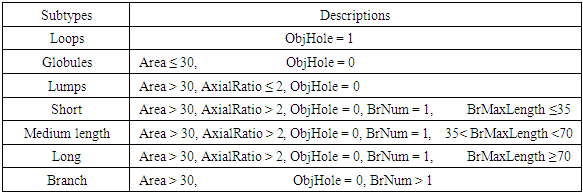
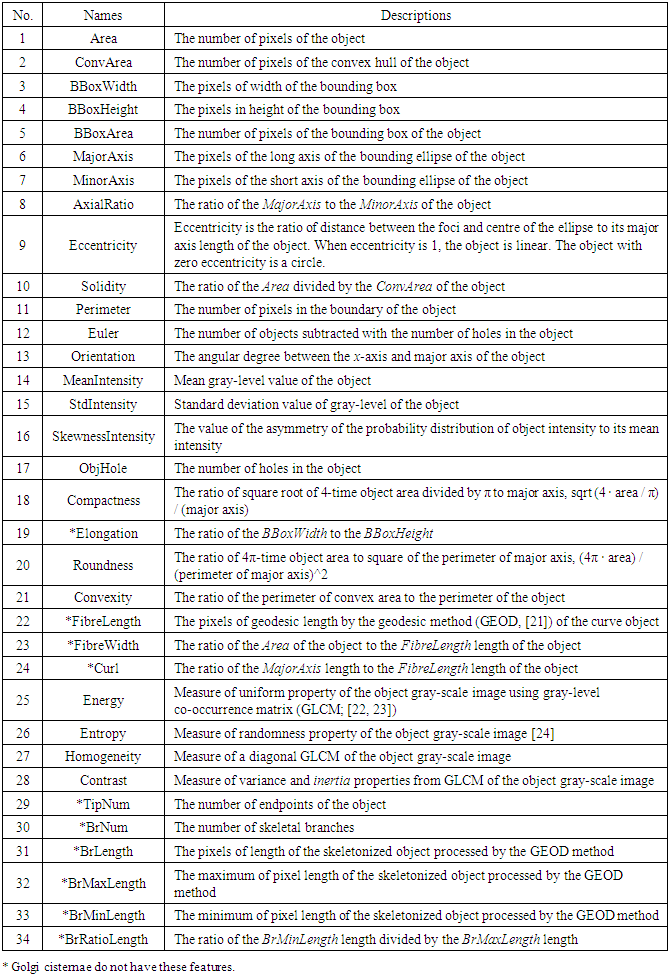
- Due to similarities between the morphology of Golgi-derived membranes and mitochondria [12,13], we used a similar approach to that used by micro-P, software for mitochondrial morphological subtyping [14], to establish our classifier. We firstly defined seven morphological subtypes, namely, globules, lumps, loops, short tubules, medium tubules, and long tubules, and including branched tubules according to the physical structures seen in our image data. Two hundred forty Golgi-derived membrane structures from all movies were randomly and manually picked, and these samples were automatically classified into the seven morphological subtypes (globules: 24 objects; lumps: 30 objects; loops: 34 objects; short: 39 objects; medium length: 46 objects; long: 26 objects; branch: 41 objects) using morphological criteria (Table 2). Thirty-four 2D morphological features of gold standards were extracted to train and test the performance of classifiers (Table 3). To choose the best classifiers, many classifiers of supervised machine learning were used to evaluate predictive accuracy of classification. The performance of classifiers was accomplished by 10-fold cross-validation for 10 runs by using a suitable application named Classification Learner App (CLA) provided in MATLAB software. The CLA tool provides not only the quantitative accuracy of prediction but also the percentage accuracy of confusion matrix for cross-validation results. Finally, the best classifier was used for further tests in this study.
|
|
2.3. Profiling Dynamics of Golgi-Derived Membranes in Different Movies Using Features of Morphological Subtypes
- Total area, length, and number of morphological subtypes in individual cells in individual frames were calculated to profile various dynamics of Golgi-derived membranes from different movies. Morphological features were normalized and Principal Component Analysis (PCA) was applied to visualize high dimensional data by use of MATLAB software [25]. MATLAB provides many principal component algorithms for multivariate data analysis. The choice of appropriate algorithm is dependent on the characteristic of data to be analyzed. Among these algorithms, Alternating Least Squares (ALS) is designed to better deal with missing values and performs well on large data sets. Since the ALS algorithm optimizes the fit of model with very quick convergence and relatively free from local minimum problems [26], it was chosen for this study.
3. Results
3.1. System Performance of 2D-GolgiMorphSubtype System to Quantify Morphological Features from High Content Imaging
3.1.1. Comparison of Segmentation Performance with Other Existing Methods
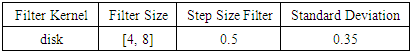
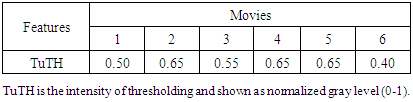
- Several conventional methods of segmentation were compared with our system to evaluate comparative performance in segmentation. Gaussian noise and impulse noise were applied to test the robustness of our system in segmentation and root-mean square error (RMSE) was used for statistical evaluation of segmentation accuracy, as previously reported [27]. Accuracy of segmentation, as determined by a low RMSE, is shown in Figure 2 (our 2D-GolgiDetect: 23.82; saliency detection algorithm [28]: 28.84; black top-hat method of MorphoLibJ-ImageJ plugin [29]: 31.34; Chan-Vese algorithm [30,31]: 39.66). Variables of the ALNT for proper segmentation of Golgi-derived membranes in this study are shown in Table 4. Although the advantage of ALNT is to detect objects from heterogeneous backgrounds, we found that detection accuracy was influenced by gray level thresholds and noise ratios (Table 5, TuTH; S1 Table). Table 5 shows that intensity thresholds are varied across different movies. The variation of gray thresholds seen underlined the importance of having the option for users to be able to adjust the threshold and thereby improve accuracy of segmentation. In summary, our system was capable of identifying objects from noise; up to values of 20% Gaussian noise and impulse noise at intensities of gray levels from 0.7 or higher (see S1 Table and S2 Figure).
|
|
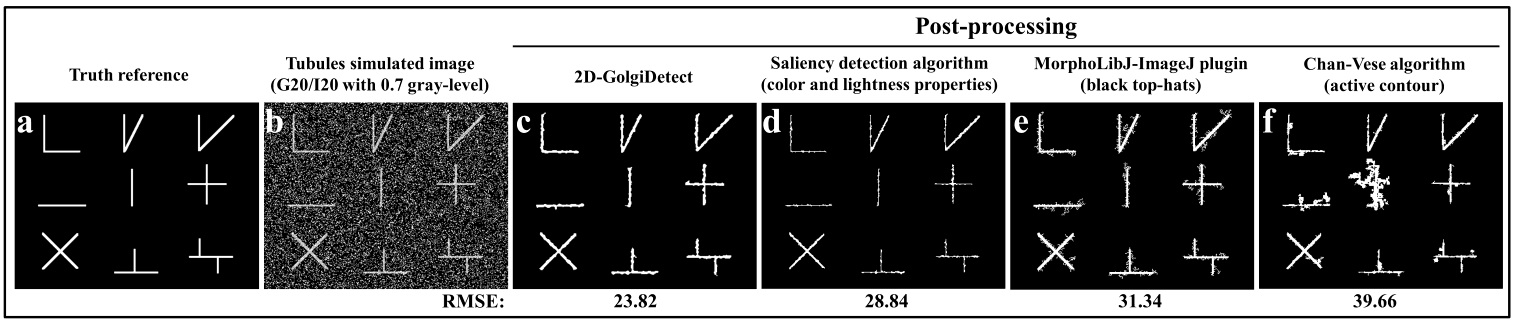 | Figure 2. Comparison of performance of conventional segmentation methods with our system. a A representative simulated image of various shaped tubule structures is used as a gold standard. b The simulated standard tubules have 20% Gaussian noise (G) and 20% impulse (I) noise at a gray level 0.7 added. c Results of 2D-GolgiDetect system are the most accurate, i.e. with the lowest root-mean square error (RMSE), compared to other methods. d-f Results of other segmentation methods with their corresponding RMSE are shown |
3.1.2. Manual Selection and Feature Extraction of Gold Standards for Training Classifiers
- Since mitochondrial dynamics display similar patterns and morphological changes to those of Golgi-derived membrane structures [12,13], we therefore adapted approaches used by micro-P to establish a classifier suitable for this class of membrane organelle [14]. Morphological features, different types of images, and cell types may cause differences in clustering mitochondria to different mitochondrial morphological subtypes. For example, six subtypes have been identified in single-plane of Chinese hamster ovary (CHO) cell images, namely small globules, swollen globules, straight tubules, twisted tubules, branched tubules, and loops [14]. 3D volumetric measurements, e.g. volume, axial ratio, mean distance to the surface, number, and average of skeleton branches, have been used to identify five subtypes, namely globules, lumps, short tubules, long tubules, and branched tubules in mouse skin tissue [32]. 3D features have also been used to classify six subtypes, namely lumps, simple tubules, branched tubules, small reticulum, and large reticulum in 3D stack images of plant cells [33]. We therefore inspected our own time lapse images to determine how many morphological subtypes of Golgi-derived membranes may be present. From this, we determined that seven morphological subtypes could be identified, including branched tubules, globules, lumps, loops, short tubules, medium tubules, and long tubules. Thirty-four 2D morphological features of ‘gold standard’ subtype morphologies were extracted for establishing candidate classifiers, as shown in Table 3. For instance, loops had hole(s) within the object (Fig. 3a: (3)). Globules were defined as having the smallest area and a rounder shape (roundness) (Fig. 3a: (1)). Lumps were larger than the area of the structures annotated in the globules cluster (Fig. 3a: (2)). This shape was distinguished from the globules shape by the AxialRatio length feature and area. Clusters of short, medium length, and long tubules were linear, and were grouped by length (BrMaxLength). These linear clusters may result from the events of Golgi tubule fission and fusion over time (Fig. 3a: (4) short tubules; (5) medium length tubules; (6) long tubules). Number of branches (BrNum) was used to distinguish the linear tubules from branched tubules, and holes (ObjHole) are used to distinguish them from loops. The branched tubules had more branches and greater tip numbers than others (Fig. 3a: (7)) and were recognized by the use of the branched numbers (BrNum) and tip numbers (TipNum) features.
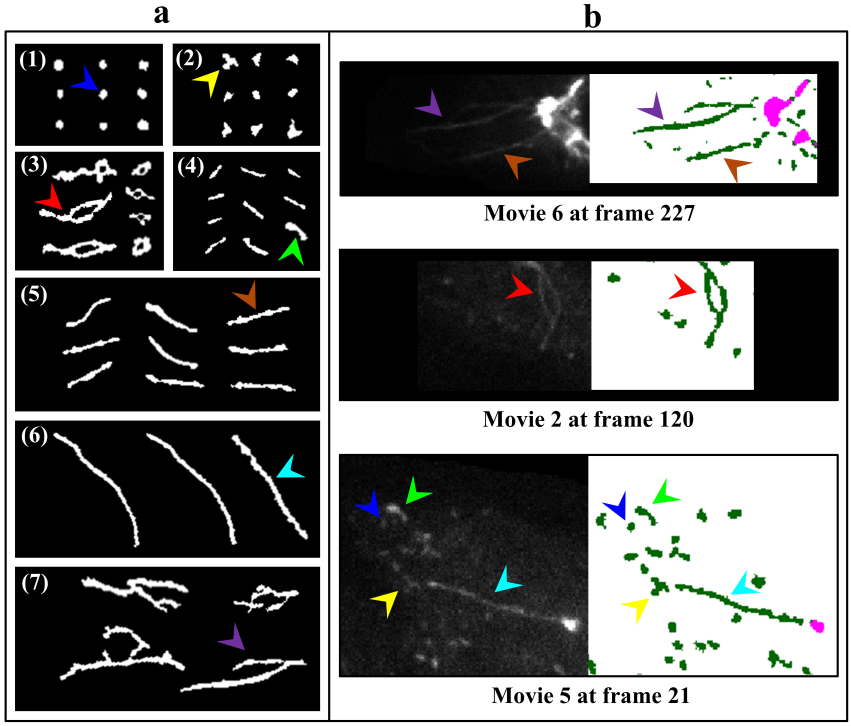 | Figure 3. Representative images of morphological subtypes of Golgi-derived membrane structures. a Several Golgi-derived membrane structures with different sizes and shapes from six movies were categorized into seven clusters, namely (1) globules, (2) lumps, (3) loops, (4) short, (5) medium, (6) long, and (7) branched tubules. b All clusters were confirmed by comparing with original images (gray: raw imaged stacks; right: binary images; dark green: segmented Golgi tubules; pink: segmented Golgi cisternae). Arrowheads with different colors in a (globules: blue; lumps: yellow; loops: red; short: light green; medium length: brown; long: cyan; branch: purple) are taken from the original micrographs in b |
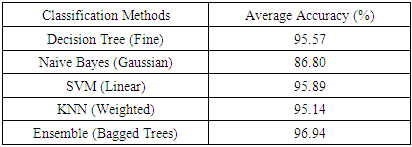
3.1.3. Comparison of Performance of Classifiers Trained by Different Methods of Supervised Machine Learning
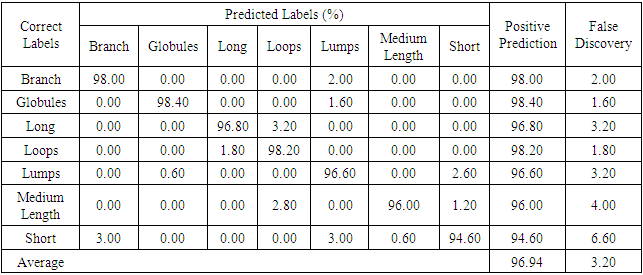
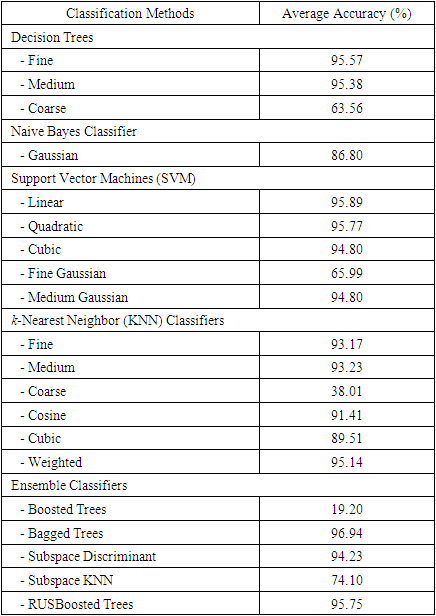
- Because seven classes of Golgi-derived membrane tubule clusters were defined before learning, all the candidate methods chosen for training the system were based on supervised machine learning. A total of 34 morphological features extracted from 240 objects (gold standards) were used for training different methods of machine learning to select the most suitable method for our system. The various classifiers have different advantages depending on the type of data. Although the decision trees algorithm is easy to use and fast for fitting and prediction to distinguish between classes, it has a low accuracy in prediction [34]. The Bayes classifier is a probabilistic classifier to generate the simplest Bayesian network models with strong independence (naive) between features that it is useful for multiclass classification [35]. Support vector machines (SVM) classifiers perform at medium speed for linear data and at slow speed for other data types with greater flexibility due to the Gaussian kernel scale mode [36,37]. The k-nearest neighbor (KNN) classifier is the simplest classification model based on the distance to points, to distinguish between classes [38]. We do not know whether the training methods cause over-training due to the composition of data, i.e. data of a particular type are predominant, such that the classifier may exhibit a poor performance for test data lacking such types of data. Ensemble classifiers are also used for comparison with other methods. However, avoidance of overfitting and speed of prediction of ensemble classifiers depends on the choice of algorithm. For example, a bagging algorithm using random forest with decision trees learner (Bagged Trees; [39,40]) has very high model flexibility compared to other algorithms such as AdaBoost with decision trees learner (Boosted Trees) and subspace with discriminant (Subspace Discriminant). In this study, we included a total of 20 models to see their accuracies in classification (see S3 Table). According to the accuracy of classification, five classifiers from those 20 candidates showed the highest accuracy of prediction in each main method (decision trees (1), naive Bayes (2), SVM (3), KNN (4), and ensemble (5)), as shown in Table 6. The best classifier for these Golgi tubule subtypes in this study was the ensemble classifier using bagging algorithm with decision trees learner (Table 6: 96.94%). Table 7 shows the average accuracy of the confusion matrix of the ensemble classifier type of bagged tree after processing 10 runs of 10-fold cross-validation. A small number of long tubules were misrecognized as loops (1.8%), and several lumps were misrecognized as globules (1.6%) or branched tubules (2%). Based on the accuracies determined, this study then applied the ensemble classifier type of bagged trees to automatically classify subtypes of all Golgi-derived membranes from six example time-lapse movies.
|
|
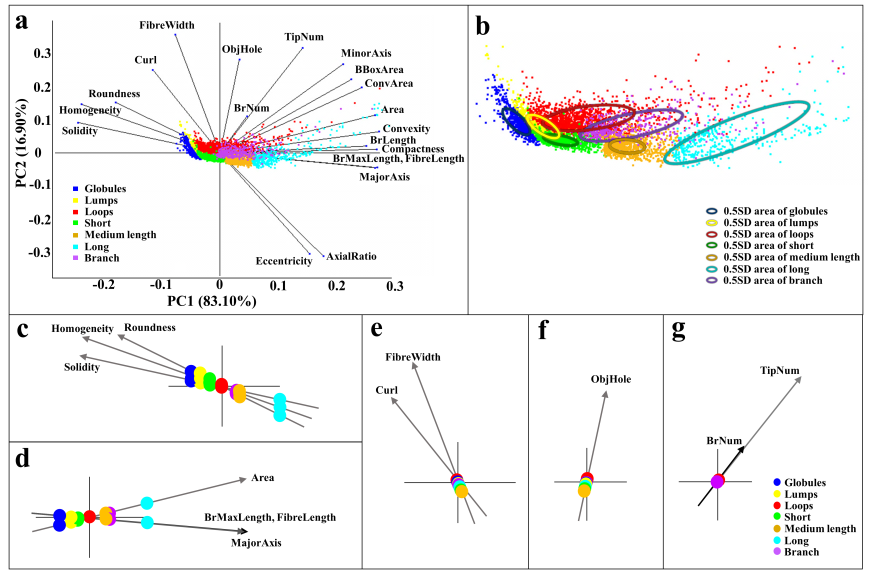 | Figure 4. Identification of morphological features useful for classification of morphological subtypes. a The PCA result is shown as a biplot of two principal components. b Plot shows the data distributions of 0.5 standard deviations within the circles. Identification of 20 significant features from six movies for ensemble classifier is identified according to Eigen values, the longer vectors. Representative features are shown (c: circular shape; d: size and length; e: curve and width; f: object hole; g: number of object tips and branches). |
3.1.4. Illustration of Performance of 2D-GolgiMorphSubtype System
- To fulfill our main objective to establish a biologist-friendly and semi-automatic system for the specific purpose of classifying and quantifying morphological changes to the Golgi apparatus and Golgi-derived membrane structures upon BFA treatment, representative results of our system performance, following segmentation, detection, and classification are shown in Figure 5. Figure 5b shows the accuracy of segmentation. Figure 5c demonstrates the system can distinguish Golgi from Golgi-derived membranes (pink: Golgi cisternae; dark green: Golgi tubules). Some instances are missed in the earlier time frame (Fig. 5a and b; red and yellow arrowheads), possibly due to rapid evolution of Golgi-derived membranes, movement out of the focal plane or segmentation errors of due to low intensity of the objects. Overall, this detection system showed excellent performance in segmentation. Moreover, the complete subtype classification system showed accurate classification of morphological subtypes of Golgi-derived membranes, as shown in Figure 5d (globules: blue; lumps: yellow; loops: red; short tubules: light green; medial tubules: brown; long: cyan; branched tubules: purple).
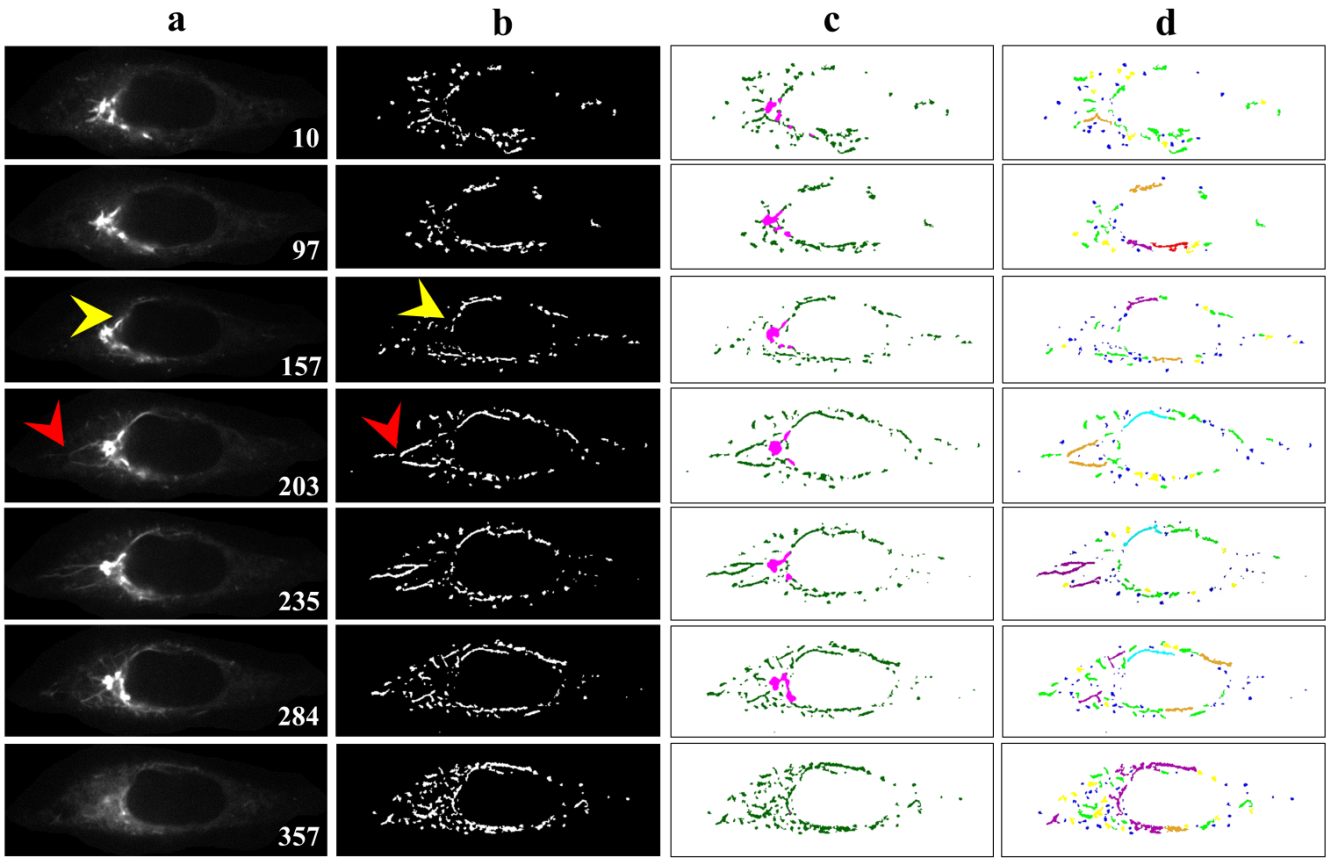 | Figure 5. Representative results of segmentation and classification of Golgi cisternae and morphological subtypes of Golgi-derived membrane structures. a The raw data of movie 6 is used as a truth reference. The frame numbers are as indicated. b The binary image showed excellent segmentation. Occasional segmentation errors occurred due to over-segmentation (a and b: red arrowheads) and missed (a and b: yellow arrowheads) tubules caused by a limitation of the ALNT, particularly at late time points (blur) when objects and their surrounding background had similar ranges of intensity. c Colored outputs label Golgi cisternae in pink and Golgi tubules in dark green. d Classification results successfully revealed seven subtypes of Golgi-derived membrane structures (globules: blue; lumps: yellow; loops: red; short tubules: light green; medium length tubules: brown; long tubules: cyan; branch: purple) |
3.2. Analysis of Features Obtained from the 2D-GolgiMorphSubtype System for Profiling Various Golgi-Derived Membrane Structures
3.2.1. Application of Numerical Features Extracted from Time-Lapse Images to Reveal Whether Golgi Tubules Are Derived from Golgi Cisternae
- Area and number of Golgi cisternae and Golgi-derived membranes are summarized in Table 8. To understand correlations of morphological changes to Golgi-derived membranes, Pearson’s correlation was used in this study, as shown in Figure 6a. Correlations among different paired data were converted into a heat map, i.e. blue and red for positive and negative correlations (R values), respectively, and with significance highlighted (*p-value < 0.05 and **p-value = 0.001). With the exception of movie 6, changes in both the total area of the Golgi and its derived membranes fluctuated and correlated negatively in every movie (Fig. 6a), indicating that as the Golgi dispersed in the presence of BFA, it did so into tubular structures. However, changes in the total area of Golgi cisternae in movie 6 were negatively correlated with the results from other movies, e.g. GCarea6 (total area of Golgi cisternae of movie 6) vs. GCarea1, GCarea2, GCarea4, and GCarea5. In this movie, this was likely due to the fact that changes in the Golgi were only recorded at very late time points (Fig. 6b: black arrowhead). Such changes result in the kinetics of movie 6 being different from that in the other movies. By contrast, changes in the total area of Golgi-derived membranes in all movies showed identical directionality (Fig. 6c).
|
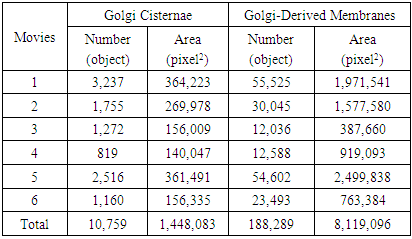
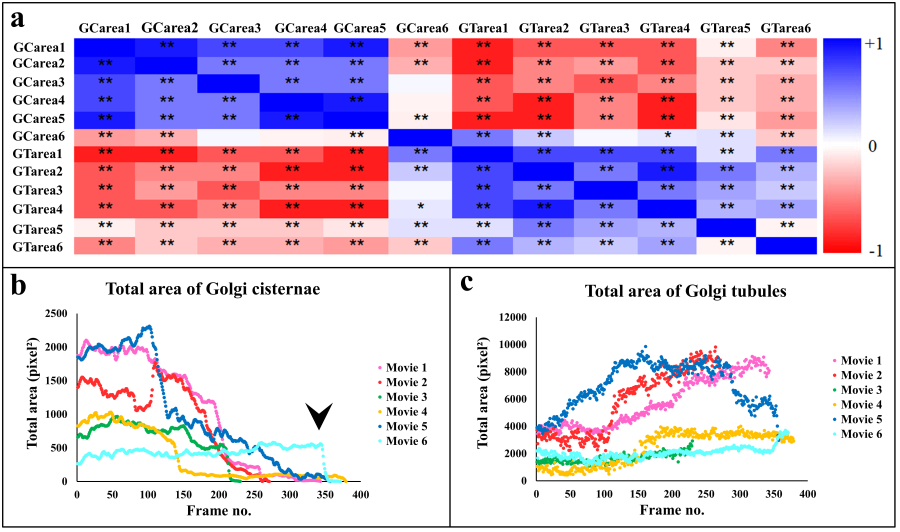 | Figure 6. Feature analysis suggests that Golgi membrane tubules are derived from Golgi cisternae. a Total area of Golgi cisternae (GCarea) and Golgi tubules (GTarea) show negative correlations analyzed in all movies by Pearson’s correlation (*p-value < 0.05 and **p-value = 0.001). Collations are shown as a heat map (R-values) with blue as positive, and red as negative correlations. b-c Time-dependent changes of Golgi cisternae and tubules in the movies fluctuate with similar kinetics. The black arrowhead indicates sudden area reduction in a late time frame of movie 6 |
3.2.2. Application of Morphological Features and Subtyping to Profile Golgi Dynamics From Different Movies
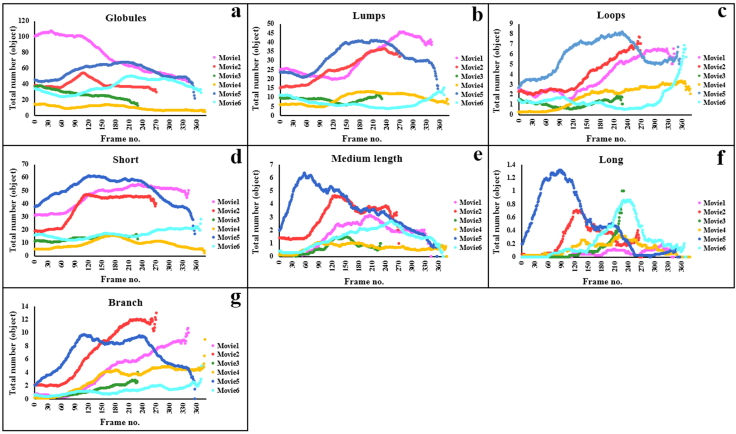
- Comparisons of total area, length, and number of subtypes were used to understand whether these features are useful for profiling Golgi tubule dynamics. The Golgi-derived membrane structures of 188,289 objects (Table 8) were classified into the seven subtypes by the best ensemble classifier type of bagged trees. This study used violin statistical analysis to analyze these features, as shown in Figure 7, with all data shown as distribution of density probability of data smoothed by a kernel density estimator (gray boxes), median (red lines), and mean (blue lines). Movies 1 and 5 had more globules and lumps than those of others (Fig. 7a and b). Loops, medium, long and branched tubules in movie 5 were more abundant than those in other movies (Fig. 7c, e, and f). Movies 1, 2, and 5 had more short tubules (Fig. 7d). These results suggest that such features have potential for profiling variations of dynamics of Golgi-derived membranes from different movies.
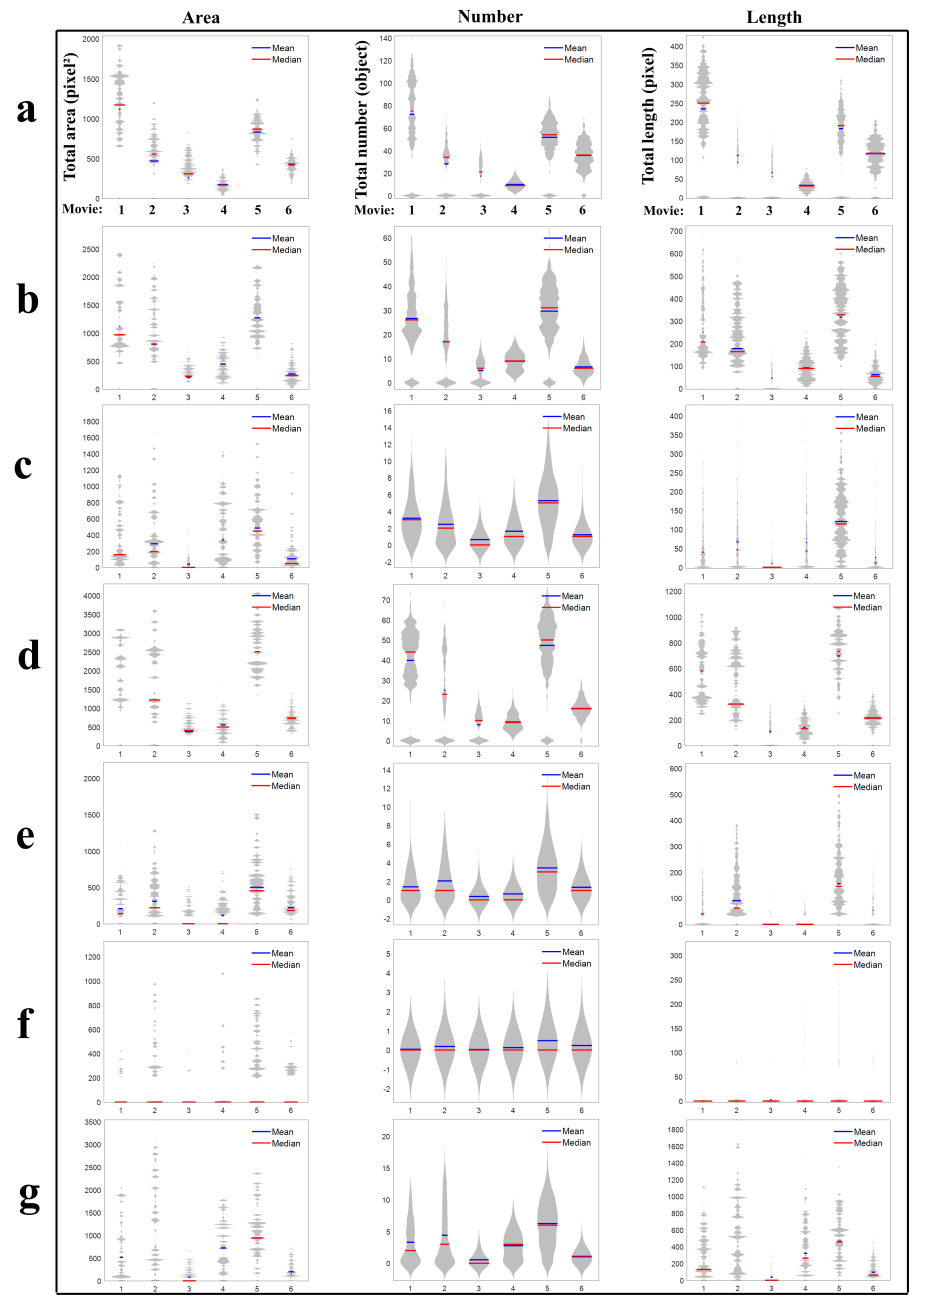 | Figure 7. Feature analysis of Golgi-derived membrane subtypes. Total area, number, and length features of a globules, b lumps, c loops, d short, e medium length, f long, and g network types are plotted with violin statistical analysis. Mean values are marked with blue lines and median values with red lines |
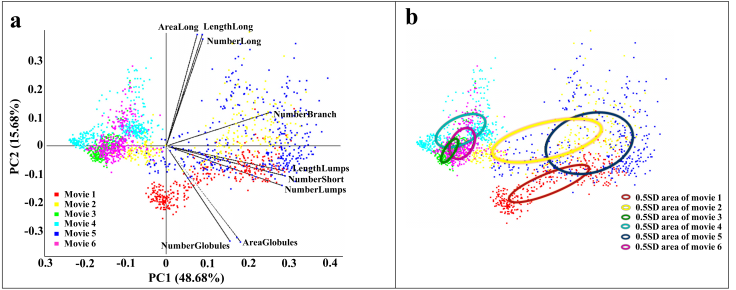 | Figure 8. Profiling Golgi dynamics using features of morphological subtypes. a Total area, number, and length of seven subtypes were used for PCA to profile Golgi dynamics from different movies, and the results are shown as a biplot of two principal components. Data from different movies are labelled with different colors, as indicated. b PCA plot contains all data points and the data distributions of each movie of 0.5 standard deviations are shown within the circles |
 | Figure 9. Morphological changes of subtypes among formation of Golgi-derived membrane structures. Time-dependent plots are smoothed by moving average (window = 50). Changes in the total numbers of morphological subtypes are shown as indicated (a: globules; b: lumps; c: loops; d: short tubules; e: medium tubules; f: long tubules; g: branched tubules) |
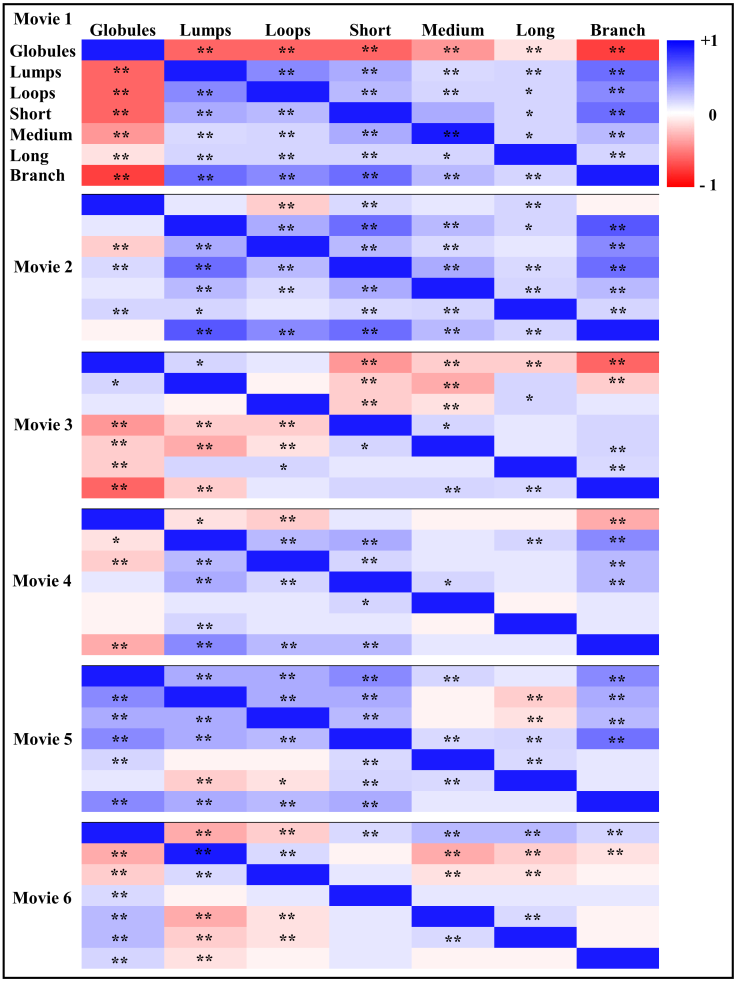 | Figure 10. Correlation of morphological subtypes of Golgi-derived membrane structures from different movies. A total of seven subtypes from six movies were analyzed by Pearson’s correlation (*p-value < 0.05 and **p-value = 0.001). Collations in total number are shown as a heat map (R-values) with blue as positive, and red as negative correlations |
4. Discussion
- This work has established the 2D-GolgiMorphSubtype system, which is the first comprehensive tool for biologists to study the morphological changes of the Golgi apparatus and Golgi-derived membrane structures in living cells. The system utilizes a combination of existing segmentation methods, i.e. adaptive local normalization and Otsu thresholding methods, and together these methods are found to be the most suitable detection system for such kinds of tubular membrane structures. Critically, 34 morphological features have been found to be useful for classifying morphological subtypes of Golgi-derived membranes. Morphological features of subtypes play a benefit for profiling variations of such dynamics observed in different movies. The sensitivity of the system shows strong potential for profiling the effects of RNA interference and drugs on the dynamics of Golgi-derived membranes to enhance our understanding of the mechanisms of morphological changes that occur in Golgi-derived membranes. However, changes in the morphology of Golgi-derived membrane tubules needs to be confirmed by tracking systems to follow their interconversion between types, thereby taking into account dynamic phenomena, such as tubule shortening, extension, fission, and fusion, including their growth and motility. Because of a limit of temporal resolution of 2D cell movies, 3D time-lapse movies with high temporal resolution are also needed to confirm exact morphological subtypes and how they evolve upon BFA treatment or other stimulation.
5. Conclusions
- This study represents the first reported system for numerical morphological analysis of Golgi-derived membranes, classification of morphological subtypes of Golgi-derived membranes, and the quantification and profiling of such dynamic subcellular structures. This system should help biologists more rapidly and accurately screen for factors associated with the formation and movement of Golgi-derived membrane tubules.
Abbreviations
- GC: Golgi Cisternae; GT: Golgi-derived Tubules; ALNT: Adaptive Local Normalization Thresholding; ER: Endoplasmic Reticulum; BFA: Brefeldin A; COPI: Coat Protein Complex I; CHO: Chinese Hamster Ovary; PCA: Principal Component Analysis; ALS: Alternating Least Squares; YFP: Yellow Fluorescent Protein; G: Gaussian Noise; I: Impulse Noise; RMSE: Root Mean Square Error; SVM: Support Vector Machines; KNN: k-Nearest Neighbor.
Funding
- This work is partially supported by the Ministry of Science and Technology, Taiwan R.O.C. under Grant no. MOST 107-2221-E-033-023-MY2. LFH was supported by a postgraduate fellowship from the Irish Research Council (IRC).
Supporting Information
|
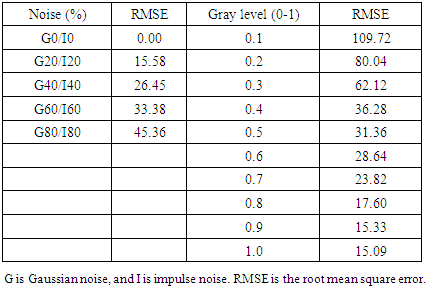
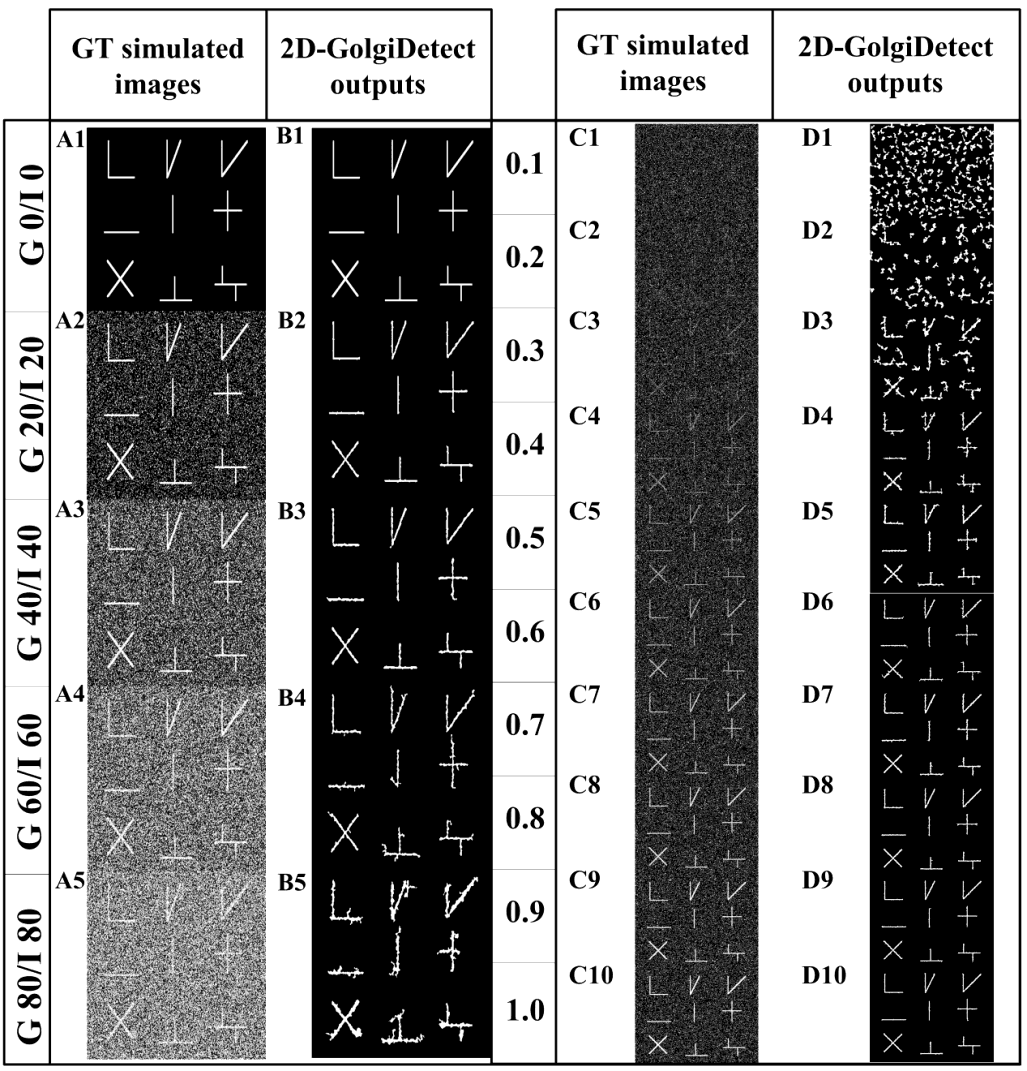 | S2 Figure. Performance evaluation of detection experiments with noise and intensity contamination. Tubular structures with a diameter of 2 pixels, and of various lengths and shapes are simulated, followed by addition of increasing Gaussian (G) noise and impulse (I) noise (A1-A5). The lowest RMSE is seen at G20/I20 with precise detection of the outputs (B2; see S1 Table: 15.58). The G20/I20 is set to add corrupt noise of increasing intensities of normalized gray levels (0-1) (C1-C10). At gray levels from 0.7 to 1.0 (C7-C10), the detection system maintains efficiency and provides accurate results (D7-D10) with low RMSE (see S1 Table: < 25). A specification of detection performance by 2D-GolgiDetect is that it can efficiently detect tubules in the presence of up to 20% Gaussian noise and impulse noise contamination at gray levels of 0.7 or higher |
|
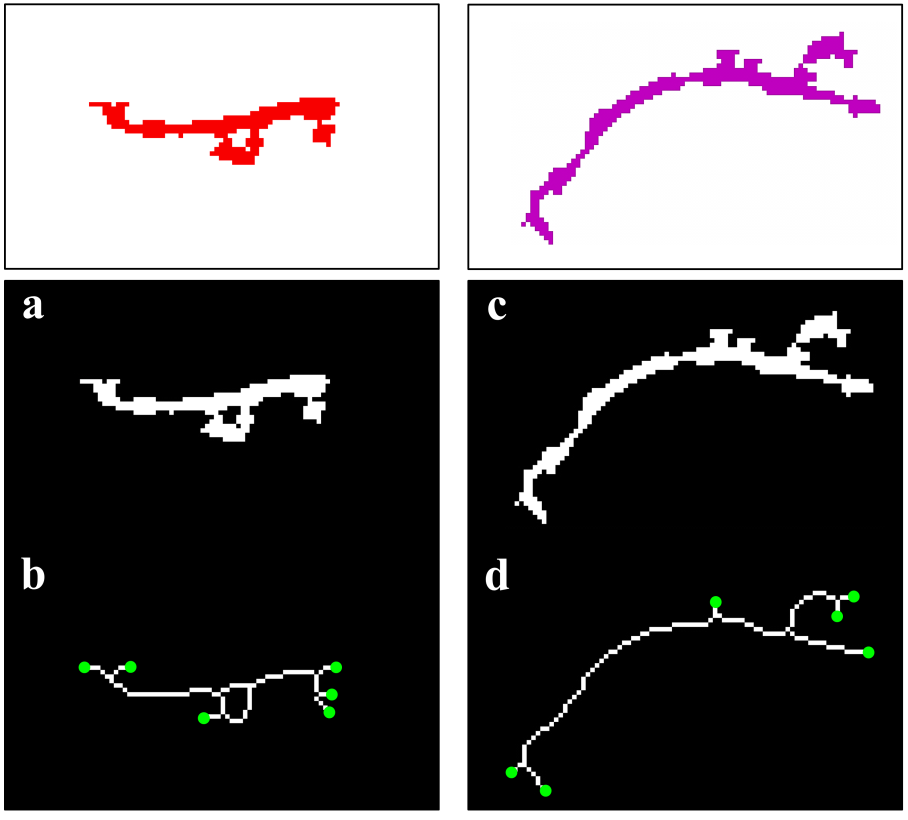 | S4 Figure. Example of why loop structures and branched tubules can show similar numbers of branches and tips. This figure shows an example of why branched tubules and loops can have similar numbers of tips and branches. a Representative binary object of loop structure (Fig. 5d: red tubule at frame 97) is skeletonized, and the skeletonized object shows many tips (green circles) and branches (b). A branched tubule (purple tubule in movie 6 at frame 313) with similar numbers of tips and branches shown for comparison (c and d) |