A. H. M. Zadidul Karim 1, Tabassum Hasnat Reshmi 1, Sabrina Sultana 1, Md. Rakibul Islam 2, Shikder Shafiul Bashar 1, Md. Abdullah Al Mahmud 1
1Department of Electrical and Electronic Engineering, University of Asia Pacific, Dhaka, Bangladesh
2Department of Information and Communication Technology, Bangladesh University of Professionals, Dhaka, Bangladesh
Correspondence to: Sabrina Sultana , Department of Electrical and Electronic Engineering, University of Asia Pacific, Dhaka, Bangladesh.
| Email: |  |
Copyright © 2020 The Author(s). Published by Scientific & Academic Publishing.
This work is licensed under the Creative Commons Attribution International License (CC BY).
http://creativecommons.org/licenses/by/4.0/

Abstract
In this paper, a method is shown to estimate the heart rate (HR) from fingertip type devices. Fingertip devices are commonly cheap and easily wearable. As the skin of fingertip is thin, it is easy to extract heart rate from there. A promising feature in today’s world of HR monitoring is Photoplethysmography (PPG). However, during physical exercise HR estimation accuracy is seriously affected by noise and motion artifacts (MA). To estimate HR changes an algorithm is used named ensemble empirical mode decomposition (EEMD) along with spectrum subtraction (SS). EEMD algorithm decomposes a PPG signal and an acceleration signal into several intrinsic mode functions (IMFs) respectively. Due to a common sparsity constraint on spectral coefficients, this method can easily identify the noise related IMFs. After that correlation coefficient (CC) is determined by the spectrum of the acceleration signal and that PPG signal in the band of [0.4 Hz-5Hz]. If CC>0.5, SS is applied to remove the spectrum of the acceleration signal from the spectrum of the PPG signal. Finally, HR related peak is estimated. Here in this paper, some modification techniques are applied to have better-estimated HR peak. There were 12 subjects from where experimental datasets are recorded. The average absolute error, average absolute error percentage, and root mean square (RMS) error of HR was estimated. In this work, the average percentage error is lower when the CC is equal to 0.7.
Keywords:
Heart Rate, Photoplethysmography, Ensemble Empirical Mode Decomposition, Intrinsic Mode Function, Correlation Coefficient
Cite this paper: A. H. M. Zadidul Karim , Tabassum Hasnat Reshmi , Sabrina Sultana , Md. Rakibul Islam , Shikder Shafiul Bashar , Md. Abdullah Al Mahmud , Analysis and Different Modifications of Empirical Mode Decomposition Method of Heart Rate Extraction from PPG Signal, American Journal of Biomedical Engineering, Vol. 10 No. 1, 2020, pp. 9-15. doi: 10.5923/j.ajbe.20201001.02.
1. Introduction
Photoplethysmographic Signal (PPG) is captured from different human body parts to measure various clinical observations, such as respiration rate and heart rate (HR) [1] by pulse oximeters. Pulse oximeters are small, inexpensive and have easy signal capturing capability. Thus it is popular in wearable devices such as smart watches or wristbands to measure heart rate in real time. However, PPG signal captured from wrist has the worst signal quality and is sensitive to motion artifact (MA) when a subject is under physical exercise with the amount of MA introduced being depended on the type of physical exercise and hand movement. Thus heart rate estimation from this MA contaminated PPG signal is challenging. Different methods have been proposed in the literature to remove MA and estimate of HR successfully. Recently a novel TROIKA framework was proposed by Zhang et al. [2] in which signal decomposition, sparse signal reconstruction and spectral peak tracking methods are used. Another method named JOSS is proposed by Zhang et al. [3]. Other techniques to remove MA and determine HR are adaptive noise cancelation (ANC) [4], electronic processing methodology [5], time-frequency analysis [6], wavelet demising [7], and empirical mode decomposition [8]. When MA is strong, a natural approach is to estimate HR using power spectrum estimation. Another familiar technique is Periodogram algorithm computed via Fast Fourier Transform (FFT). Periodogram has some disadvantages. First, it is an unpredictable spectrum estimator and has high variance.Here, a novel method for determining HR named Ensemble Empirical Mode Decomposition (EEMD) along with Spectral Subtraction (SS) is shown here with some modifications.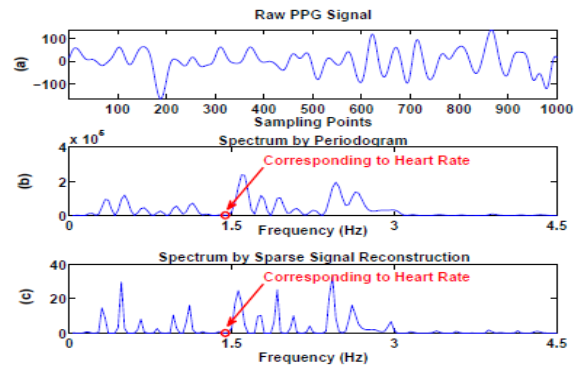 | Figure 1. An example showing a case when the spectral peak associated with the heart rate does not exhibit. (a) A raw PPG signal after band-pass filtered from 0.4 Hz to 5 Hz. (b) The spectrum calculated by Period gram. (c) The spectrum calculated by FOCUSS. The circles in (b) and (c) indicate the frequency location corresponding to the true heart rate (which is calculated from simultaneously recorded ECG) |
2. Methodology
To start the main procedures of our heart rate extraction method, firstly the raw PPG and acceleration signal is initially recorded simultaneously. Then the PPG signal is filtered by 2nd order band-pass filtered (frequency range 0.4-5 Hz). Raw PPG signals are fed into the adaptive filter to reduce the noise outside the heart rate frequency band. Then we have to calculate the correlation coefficient (CC) between the spectra of filtered PPG data and acceleration data. The value of Correlation coefficient considered as threshold indicates the next step of our works. If the value of CC is less than 0.5 then we work with only filtered PPG signal. And if the CC is greater than 0.5 then we work with both preprocessing PPG and acceleration signals. These paper works are based on signal decomposition (EMD). To do decomposition, AM-FM decomposition of the signal is needed which is,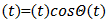 | (1) |
Where (𝑡) defines local energy and (𝑡) defines the local frequency. The Empirical Mode Decomposition (EMD) is an iterative process which decomposes real signals (𝑡) into simpler signals (modes). Each “mono-component” signal y(𝔦) should be representable in the form,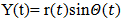 | (2) |
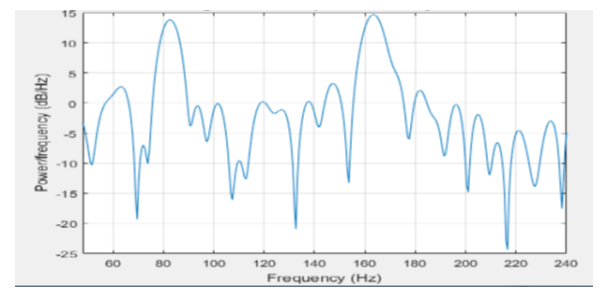
A. Data preprocessing A filter is a device that removes some noisy components or unwanted features from a PPG signal. Filtering is a way of signal processing. Acceleration signal can be reduced by filtering algorithm using a low band-pass filter.B. Spectrum Computation (Periodogram) To calculate the Heart Rate from wrist type PPG we need to estimate the spectrum of both acceleration and PPG signals. To estimate the spectrum we need Spectrum Computation (periodogram) process just after the process of filtering the raw PPG signal. One method for estimating spectral densities is based on using a function called the periodogram. To estimate the periodogram of two signals we need to use the Fast Fourier Transform (FFT). C. Correlation CoefficientThe correlation coefficient determines the degree to which two variables movements are associated. So that correlation coefficient is a number that quantifies a type of correlation and dependence, meaning statistic relationships between two or more values in a fundamental statistic. In this work, the correlation coefficient between the spectrum of acceleration and PPG signals are calculated.Correlation coefficient measured the degree of association, which is denoted by r. The correlation coefficient measurement scale varies from + 1 through 0 to - 1. When one variable increases as the other increases the correlation is positive; when one decreases as the other increases it is negative. In our Heart Rate (HR) monitoring process using wrist type PPG, before Heart Rate monitoring we have to fix the value of spectral CC and then we can estimate the HR in that possible range. The procedures to detection of HR are given below: 1. CC between the spectrum of acceleration and PPG signals are calculated here to measure HR.2. The threshold attributed upon CC.3. The estimated value of the threshold is here 0.5 and this value is used for heart rate monitoring.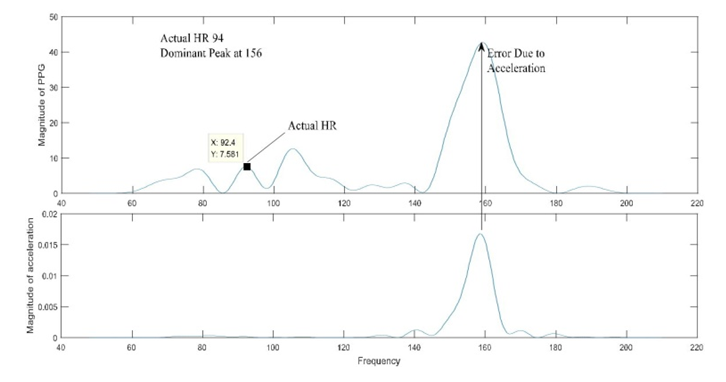 | Figure 2. Periodogram of Corrupted PPG Signal (Frequency in Hz, HR in BPM) |
Here the value of CC= 0.435 and the signal is fully corrupted by motion artifact. That’s because for heart rate estimation maximum amplitude value must be required equal or less than 110. Here the value of the maximum peak (current BPM) is 156. So the signal is corrupted. There are two ways to estimate HR depends on the value of CC.1. If CC > 0.52. If CC < 0.5When CC is greater than the threshold1. When CC is greater than 0.5 the PPG and acceleration signal both are used to estimate the HR.2. Acceleration signals exist there.3. PPG signal is considered corrupted due to noise and motion artifact.4. PPG1, PPG2, Acceleration signals are used to determine the Heart Rate.D. Empirical mode decomposition (EMD)Empirical mode decomposition (EMD) is a self-adaptive signal-processing technique, which has been applied in non-stationary signal-processing successfully and which can divide any signal into several components. EMD generally did the decomposition of signal which is known as intrinsic mode function (IMF). Features of EMD are given below: 1. In EMD mathematically, there is an infinite number of ways to decompose a function into a complete set of components.2. To ones that give us more physical insight are more significant.3. Generally, the fewer the number of representing components, the higher the information content: Sparse representation.4. The adaptive method will represent the characteristics of the signal better.5. EMD is an adaptive method that can generate many sets of IMF components the original data.E. Intrinsic Mode Function (IMF) In 1998, Intrinsic Mode Function (IMF) was introduced by Huang et al. as the result of the Empirical Mode Decomposition (EMD). EMD has been extensively used to analyze various non-linear signals by decomposing data into a series of IMFs and a trend function through sifting processes.  | (3) |
 | Figure 3. Signal Decomposition of PPG signal |
In this portion of the block when CC is greater than 0.5, we considered the PPG signals as corrupted. There has the existence of MA and noise. The acceleration signal has existed here. So both PPG and acceleration signals are used in this condition to calculate the heart rate. The Complete Ensemble Empirical Mode Decomposition (CEEMD) is used to decompose the signals into a number of components named (Intrinsic Mode Functions) IMFs. PPG signal is divided into several IMFs. 0.1 times the standard deviation of the signal is used to generate noise for EEMD and performed 20 realizations. That contains the IMFs. To implement this condition the IMFs of the acceleration data also has to be calculated here.F. Reconstruction of PPG and acceleration signalAfter the decomposition process through CEEMD now the PPG and Acceleration both signals have to be reconstructed. So for the reconstruction following procedures have to be followed:First three and last three IMFs of PPG signals are removed as noise and motion artifact and after removing the PPG signal has been reconstructed. Though acceleration signals are also used so the IMFs of the acceleration data is also calculated and has to remove the three and last three IMFs from here also. The components of acceleration data that are correlated to the PPG signal has to be determined. The each and every remaining IMFs of Acceleration Signals are individually correlated to reconstruct PPG signal. Mid values have to find out and reconstruct the acceleration signals are reconstructed. So both signals have become reconstructed signals and both reconstructed PPG and acceleration signals are obtained.G. Spectrum EstimationThe main goal of this stage was to obtain the spectrum for HR estimation. When the spectral CC was smaller than 0.5, it indicated that the PPG signal contained fewer MA components or the MA was not dominant in the PPG signal. Thus, SS was not performed. After the signal decomposition stage, we obtained a number of IMFs of the PPG signal and reconstructed a new PPG signal by removing the first three IMFs and that was used to obtain the spectrum for HR estimation. The PPG signal contained lots of MA, which can be well approximated by the acceleration signal. Thus, SS was performed. However, instead of directly subtracting the spectrum of the acceleration signal from that of the PPG signal, we selected the spectral components of the acceleration signal which were mostly correlated with the spectrum of the PPG signal.H. HR EstimationWhen CC<0.5, then only PPG signals are used to estimate the heart rate. But on the other hand if CC>0.5, then PPG and acceleration signals both have equal importance for heart rate estimation. If there occurs any type of technical error or some far enough fluctuations between the several detected values then the over fluctuated values are eliminated automatically and the average nearby values are selected instantaneously for heart rate estimation. In CC>0.5 after the process of periodogram reconstructed PPG and acceleration signals are needed to converted into signal scaling to measure the accurate peak. After scaling due to Spectral Subtraction, finally exact Heart Rate can be measured.
3. Modifications in Proposed Method
A. Removal of IMFs In this analysis when CC is smaller or greater than the threshold, firstly the spectrum of the original signal is determined. Then the number of IMFs was found. After that, all the IMFs was compared with the original spectrum. Thus the spectrums of twelve datasets were analyzed. The paper proposed that when CC was smaller than the threshold, the first two IMFs and the last two IMFs of the PPG signal were related to random noise. Also if CC is greater than the threshold the first two and the last two IMFs were removed. On the other hand, according to our analysis whatever the case is the first three IMFs and the last three IMFs can be removed. As the first three IMFs and the last three IMFs do not provide any acceptable HR, these IMFs Power Frequency in Hz can be removed during signal decomposition stages. Suppose, a signal was decomposed into nine data IMFs, the first three IMFs were MA related components. And the last three IMFs were related to low oscillations and the trend. So, the outcome of this analysis is that we may work with fewer IMFs compared to the previous method.Fig. 4 represents a signal with lots of MA-related components.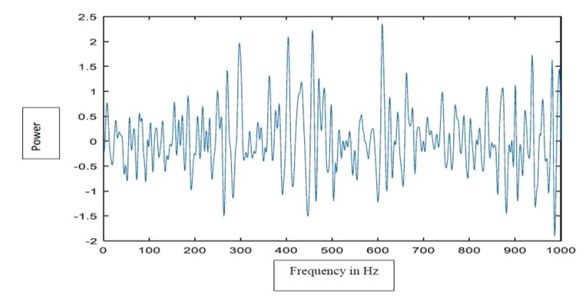 | Figure 4. PPG Signal corrupted by MA For se=1, i=1, IMF=3 |
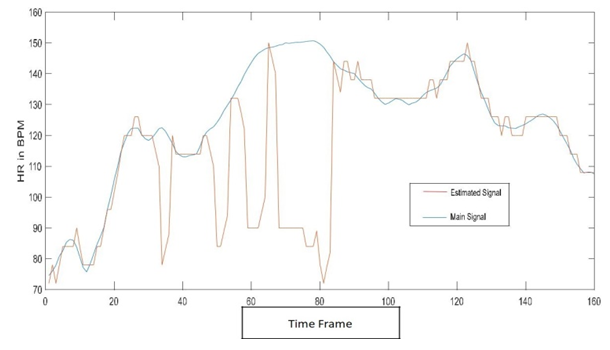
B. Using Tracking methodBy using the 2nd phase tracking the signals are providing a better result. Here the tracking method is used to modify the corrupted signal. By using the tracking system several MA are removed from the PPG signal. The ECG signal is very neat as there is less effect of MA. From the ECG signal, it is quite easy to estimate the HR. But in the case of the PPG signal, the signals are affected by MA related components. So that it is necessary to track the main signal accurately. For doing so, some signals provided very good results and some gave an average result. So the outcome of this modification is that we improve several signals in accordance with the main signal.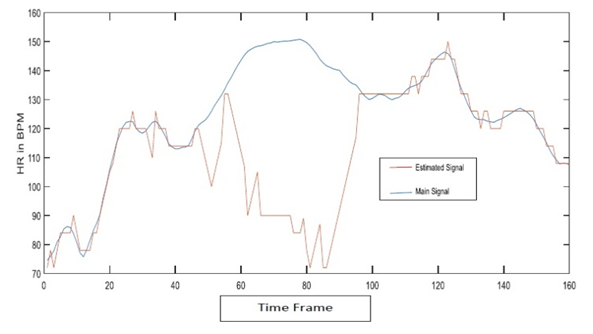 | Figure 5(a). Without tracking method |
In the above figure, the blue line represents the ECG signal and the red line represents the estimated PPG signal. The ECG signal is free of MA. On the other hand, the PPG signal has several MA related components. The PPG signal could not track the ECG signal properly.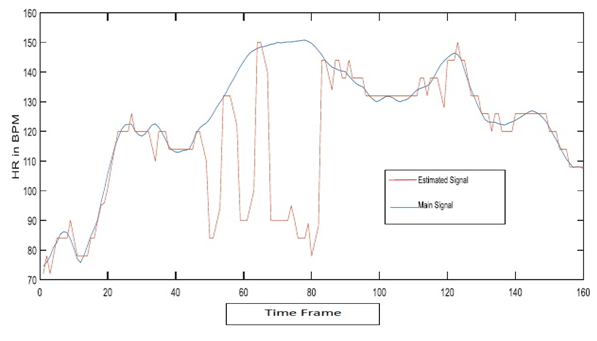 | Figure 5(b). With tracking method |
Fig. 5(b) represents that when we use the tracking method the PPG signal tracks the ECG signal in quite a proper way. So the tracking method makes a difference in the whole theorem.C. Changing CC and threshold In the TROIKA framework, they proposed the value of CC is 0.5. Several data and signals are analyzed by varying the value of CC the threshold by us. After varying CC and the value of the threshold, the PPG signals provided more clear information. Also, the MA-related components were less than before. So we can say that by varying CC and threshold the PPG signal could be better than before for few cases. For some cases, the value of CC is modified.D. Removal of EEMDIn the paper, to track HR an algorithm is used which is EEMD. EEMD is an attractive method to remove MA from ECG signals as well as PPG signals. EEMD decomposes a time series into multiples IMFs. However, EEMD has huge computation load. Due to this computation load, EEMD takes times to compute. To solve this time issue, we take an attempt to decompose signals without EEMD. Decomposing signals without EEMD gives better results for some cases. Such as in fig. 6(b) gives better results compared to the signal in fig. 6(a) which is decomposed with EEMD.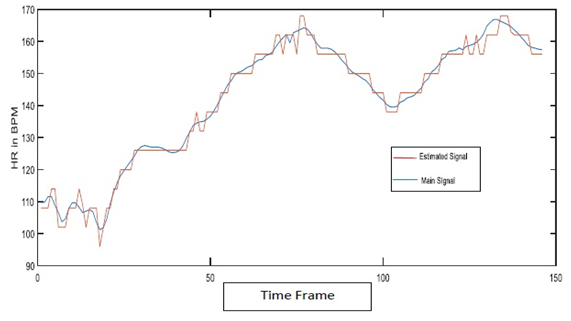 | Figure 6(a). Signal with EEMD |
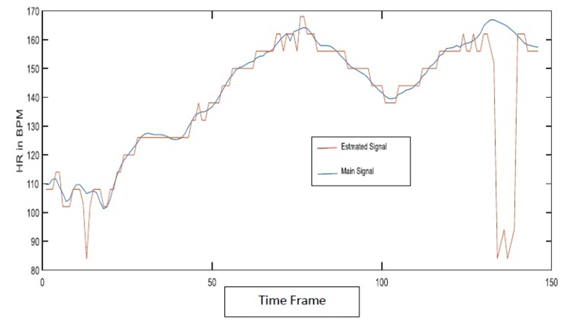 | Figure 6(b). Signal without EEMD |
So the outcome of the modification is that we try to reduce the computation time by decamping the signals without EEMD.
4. Results and Calculation
In this chapter, several figures were described, where the modified estimated heart rate are also determined. Here the appropriate values of HR estimation were detected by periodogram and other calculations. The figures in this chapter are described in two ways. These ways are:1. With tracking2. Without trackingTo obtain the performance of the proposed method, we calculate the average absolute error defined as, 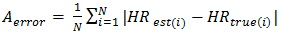 | (4) |
Besides, the average absolute error percentage is also determined, which is defined as,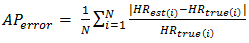 | (5) |
And we also determine average Root mean square error is defined as,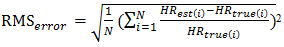 | (6) |
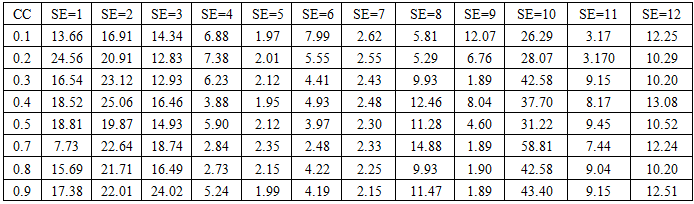
Here, HRtrue(i) denotes the ground-truth of HR and HRest(i) denotes the estimated HR. And the total number of time windows is denoted by N. All errors are calculated in Beats per Minute (BPM). In addition, the Bland–Altman plot was also used to examine the agreement between ground-truth and estimates, which shows the difference between each estimate and the associated ground-truth against their average. Limit of Agreement (LOA) in this analysis was calculated, which is defined as [μ−1.96α, μ+1.96α], where μ is the average difference and α is the standard deviation. Pearson correlation between ground truth and estimation was also calculated. In this heart rate estimation method 12 datasets are used to calculate the heart rate.1. The table is shown before gives a comparison of several errors.2. The operating time with EEMD and without EMD condition was also calculated. Here without EEMD faster than with EEMD. The operating time in both conditions is given below.I) SE=2With EEMD= 473.640817 seconds. Without EEMD= 7.125215 seconds.II) SE=5With EEMD= 545.728124 seconds. Without EEMD= 10.544322 seconds.III) SE=7With EEMD=402.213877 seconds. Without EEMD= 8.623956 seconds.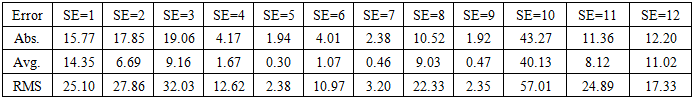 | Table 1. With EEMD, CC=0.7. Modified and with Tracking. The average absolute error, (𝐴𝑒𝑟𝑟𝑜𝑟), average error percentage, (𝐴𝑃𝑒𝑟𝑟𝑜𝑟) and average root mean square error, (𝑅𝑀𝑆𝑒𝑟𝑟𝑜𝑟) on all 12 datasets using the proposed method |
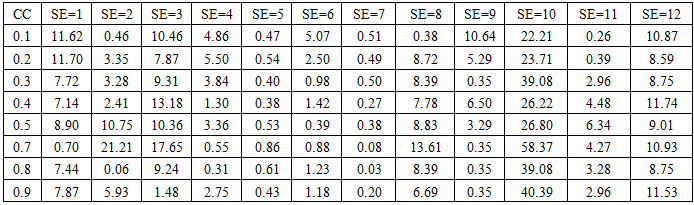
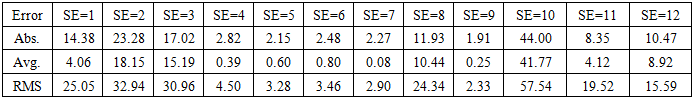 | Table 2. With EEMD, CC=0.7, Unmodified and with Tracking. Average absolute error (𝐴𝑒𝑟𝑟𝑜𝑟), average error percentage (𝐴𝑃𝑒𝑟𝑟𝑜𝑟) and average root mean square error, (𝑅𝑀𝑆𝑒𝑟𝑟𝑜𝑟) on all 12 datasets using the proposed method |
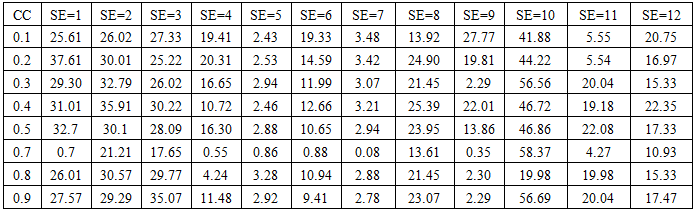
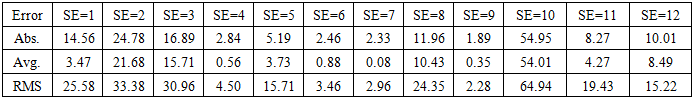 | Table 3. Without EEMD, CC=0.7, with Tracking. Average absolute error (𝐴𝑒𝑟𝑟𝑜𝑟), average error percentage (𝐴𝑃𝑒𝑟𝑟𝑜𝑟) and average root mean square (𝑅𝑀𝑆𝑒𝑟𝑟𝑜𝑟) on all 12 datasets using the proposed method |
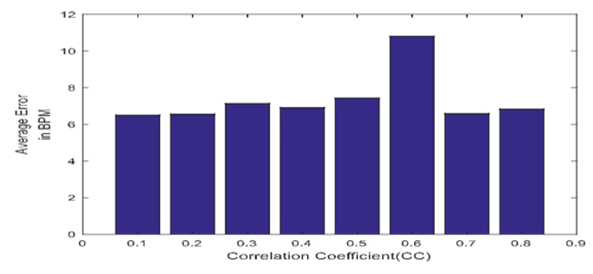
 | Table 4. Average absolute error with modification and variation of CC at 0.1 ~0.9 |
 | Table 5. Average absolute percentage error with modification and variation of CC at 0.1 ~0.9 |
 | Table 6. Average Root Mean Square error with modification and variation of CC at 0.1 ~0.9 |
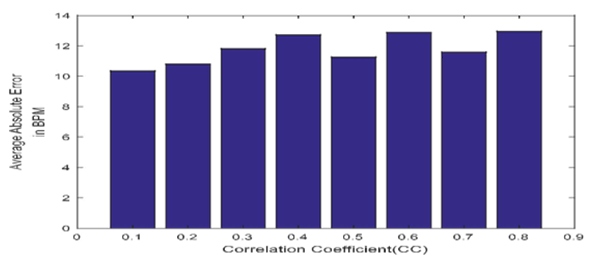 | Figure 7(a). Bar plot diagram of average absolute error with modification |
 | Figure 7(b). Bar plot diagram of average absolute percentage error with modification |
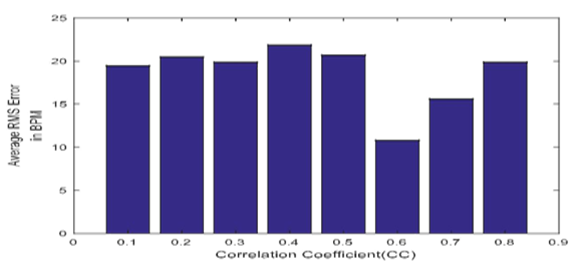 | Figure 7(c). Bar plot diagram of average rms error with modification |
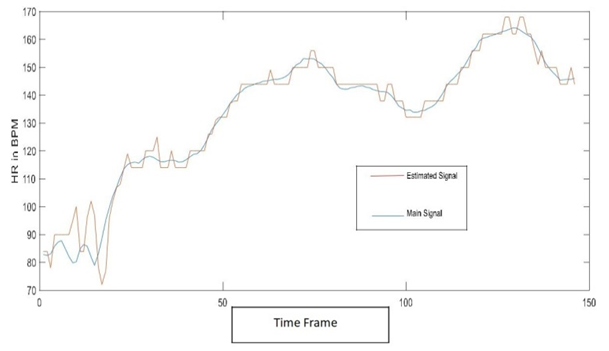
 | Figure 8(a). SE=4, With EEMD, Modified, CC=0.7, with Tracking |
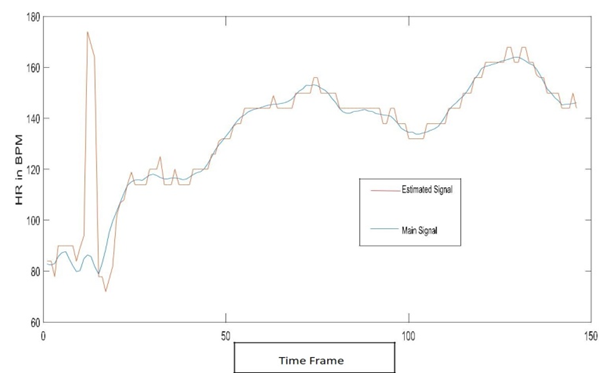
 | Figure 8(b). SE=4, With EEMD, Unmodified, CC=0.7, with Tracking |
 | Figure 9. SE=8, Without EEMD |
5. Conclusions
In this paper, a wrist-PPG based HR estimation method is discussed. This method combined the EEMD with SS technique. EEMD is used to remove unrelated IMFs for PPG signal and the acceleration signal. By modifying the technique, MA is removed and thus enhancing spectral peak localization for HR estimation.
References
| [1] | J. Allen, “Photoplethysmography and its application in clinical physiological measurement,” Physiological measurement, vol. 28, no. 3, pp. R1-R39, 2007. |
| [2] | Zhilin Zhang, Zhouyue Pi, and Benyuan Liu, “Troika: A general framework for heart rate monitoring using wrist-type photoplethysmographic signals during intensive physical exercise,” Biomedical Engineering, IEEE Transactions on, vol. 62, no. 2, pp. 522–531, 2015. |
| [3] | Zhilin Zhang, “Photoplethysmography-based heart rate monitoring in physical activities via joint sparse spectrum reconstruction,” Biomedical Engineering, IEEE Transactions on, vol. 62, no. 8, pp. 1902–1910, Aug 2015. |
| [4] | M. Ram, K. V. Madhav, E. H. Krishna, N. R. Komalla, and K. A. Reddy, “A novel approach for motion artifact reduction in PPG signals based on AS-LMS adaptive filter,” IEEE Trans. on Instrumentation and Measurement, vol. 61, no. 5, pp. 1445-1457, 2012. |
| [5] | M. J. Hayes and P. R. Smith, “A new method for pulse oximetry possessing inherent insensitivity to artifact,” Biomedical Engineering, IEEE Transactions on, vol. 48, no. 4, pp. 452–461, 2001. |
| [6] | Y. sheng Yan, C. C. Poon, and Y. ting Zhang, “Reduction of motionartifact in pulse oximetry by smoothed pseudo wigner-ville distribution,” Journal of NeuroEngineering and Rehabilitation, vol. 2, no. 3, 2005. |
| [7] | M. Raghuram, K. V. Madhav, E. H. Krishna, and K. A. Reddy, “Evaluation of wavelets for reduction of motion artifacts in photoplethysmographic signals,” in Information Sciences Signal Processing and their Applications (ISSPA), 2010 10th International Conference on. IEEE, 2010, pp. 460–463. |
| [8] | X. Sun, P. Yang, Y. Li, Z.Gao, and Y.-T. Zhang, “Robust heart beat detection from photoplethysmography interlaced with motion artifacts based on empirical mode decomposition,” in Biomedical and Health Informatics (BHI), 2012 IEEE-EMBS International Conference on. IEEE, 2012, pp. 775–778. |

 Abstract
 Reference
 Full-Text PDF
 Full-text HTML