-
Paper Information
- Paper Submission
-
Journal Information
- About This Journal
- Editorial Board
- Current Issue
- Archive
- Author Guidelines
- Contact Us
American Journal of Biomedical Engineering
p-ISSN: 2163-1050 e-ISSN: 2163-1077
2020; 10(1): 1-8
doi:10.5923/j.ajbe.20201001.01

Investigation of Genome-Wide Association SNPs and Alzheimer’s Disease
 Abstract
 Reference
 Full-Text PDF
 Full-text HTML
Mark Nnh Mikhail 1, Ahmed Y. Sayed 2, Mai S. Mabrouk 3, Ayman M. Eldeib 1
1Systems and Biomedical Engineering Department, Faculty of Engineering, Cairo University, Cairo, Egypt
2Department of Engineering Mathematics and Physics, Faculty of Engineering, El- Mataria, Helwan University, Cairo, Egypt
3Biomedical Engineering, Misr University for Science and Technology, 6th of October, Giza, Egypt
Correspondence to: Mai S. Mabrouk , Biomedical Engineering, Misr University for Science and Technology, 6th of October, Giza, Egypt.
| Email: |  |
Copyright © 2020 The Author(s). Published by Scientific & Academic Publishing.
This work is licensed under the Creative Commons Attribution International License (CC BY).
http://creativecommons.org/licenses/by/4.0/

The aim of this work is to measure the influence of genome-wide association study single nucleotide polymorphisms (SNPs) in Alzheimer’s disease (AD). Data mining methods were tested. Data used were obtained from ADNI database. Subjects were 214 normal controls (NCs), 364 subjects with mild cognitive impairment (MCI), and 179 subjects with early AD. Linear regression (LR), random forests (RF) and multifactor dimensionality reduction (MDR) models were used. The results demonstrate the effectiveness of using RF and MDR. The MDR model produced the best sensitivity in all comparisons using only 3 SNPs. Regarding specificity, LR resulted in the best specificity in two comparisons (NC vs. MCI and MCI vs. AD), while MDR produced the best specificity in comparison of NC vs. AD. Several significant polymorphisms associated with MCI and AD were identified. RF and MDR are alternatives to existing methods for detecting genetic interactions.
Keywords: Alzheimer’s disease, Single nucleotide polymorphisms, Linear regression, Random forest, Multifactor dimensionality reduction
Cite this paper: Mark Nnh Mikhail , Ahmed Y. Sayed , Mai S. Mabrouk , Ayman M. Eldeib , Investigation of Genome-Wide Association SNPs and Alzheimer’s Disease, American Journal of Biomedical Engineering, Vol. 10 No. 1, 2020, pp. 1-8. doi: 10.5923/j.ajbe.20201001.01.
Article Outline
1. Introduction
- It is typically believed that genes and biomarkers involved in age-related diseases, such as coronary artery disease, cerebrovascular disease, and Alzheimer’s disease (AD), play a vital role in human ageing [1].AD is a complex neurodegenerative disorder that affects up to eighty-one million persons worldwide [2]. AD is usually divided into two types: (i) cases with strong familial clustering, which often show Mendelian disease transmission mechanism and generally exhibit an early (65 years) or very early (50 years) age of onset (collectively referred to as EOAD) and (ii) cases of later-onset age (LOAD) (typically well beyond 65 years), showing no obvious familial aggregation. A strong genetic basis is known for AD, with heritability estimates of approximately 80% [3]. To identify the genes involved in the common LOAD, efforts have focused on conducting genome-wide association studies (GWAS) [4].Whole-exome sequencing and GWAS are recommended to identify the risk gene variants for LOAD [5,6]. Their main role is to identify rare coding variants that were recently recognized as a risk for LOAD [6-9]. With respect to common variants for AD, since 2009, five large GWAS and one meta-analysis have identified more than twenty loci significantly associated with LOAD. According to their potential role in the process causing AD, these genes were classified into three groups: (1) lipid metabolism: APOE, CLU, ABCA7 and SORL1; (2) immune response: CR1, CD33, MS4A, EPHA1, ABCA7, CLU, HLA-DRB5/DRB1 and INPP5D; and (3) endocytosis: BIN1, PICALM, EPHA1, RIN3, CD2AP, SORL1, MEF2C and MADD [5,10-14]. However, in most cases, the identified single nucleotide polymorphisms (SNPs) have small to moderate effect sizes, and the proportion of heritability explained is quite modest.The aim of this work is to measure the influence of GWAS SNPs on gene expression in AD [15]. Due to limitations of the linear model and other parametric statistical models, machine learning and data mining methods will be tested for the same data, mainly random forests (RF) and multifactor dimensionality reduction (MDR), as explained by Moore et al. (2010) [16].
2. Methods
2.1. Experimental Setup
- The data used in the present study were downloaded from the Alzheimer’s Disease Neuroimaging Initiative (ADNI) database. The ADNI is a consortium of universities and medical centers that was established to develop standardized imaging techniques and biomarker procedures in normal subjects, subjects with MCI, and subjects with early AD [17].The subjects for the study were classified as normal controls (NC), subjects with MCI, or subjects with early AD. The criteria for classification of the subjects were described in McKhann et al. (1984) [18].
2.2. Dataset
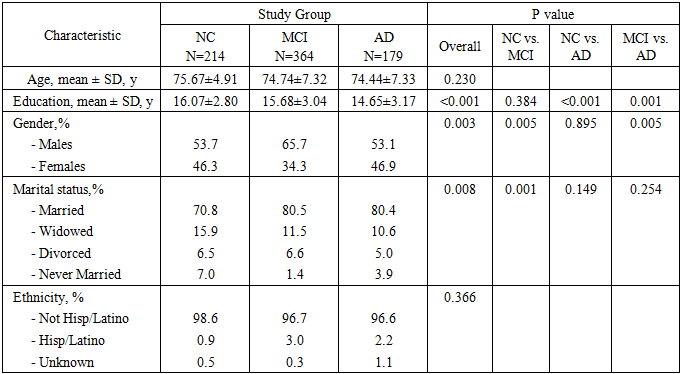
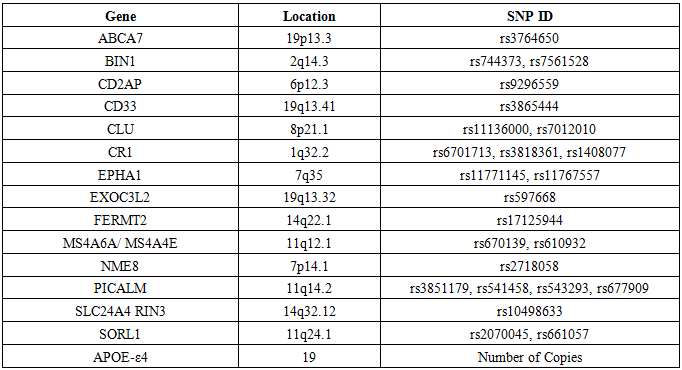
- In the present study, data were downloaded from the ADNI web site (ADNI 1 data) in November 2016. In this work, only ADNI1 subjects with all detailed clinical information and genotype data were included. Whole-genome sequencing (WGS) data of 819 individuals were obtained from the ADNI database (http://adni.loni.usc.edu/). An initial quality control (QC)-based filtering step was performed using PLINK [19] and applied to the selected datasets. The following QC procedures were carried out in order, according to the steps suggested by Shi et al. (2012) [1].• SNPs with genotyping rate less than 0.95 (--geno 0.05) were excluded from further analysis. • SNPs with a minor allele frequency (MAF) less than 0.01 (--maf 0.01) were excluded from further analysis.• A list of SNPs with MAF between 0.01 and 0.05 was generated (--freq). Within this short list, SNPs with a genotyping rate less than 0.99 (geno 0.01) were excluded (--exclude) from further analysis.• SNPs with a Hardy-Weinberg Equilibrium p value less than 0.001 (--hwe 0.001 --hwe-all) were excluded from further analysis, irrespective of status (AD cases or controls).• Individuals with a genotyping rate less than 0.95 (mind 0.05) were excluded from further analysis.This yielded a total of 757 subjects, including 179 LOAD patients, 364 MCI patients and 214 NC. SNPs belonging to the top AD candidate genes listed on the AlzGene database [20], together with those listed by Lambert et al. (2013) [13] and Nettiksimmons et al. (2016) [21], were selected for use in this study if they were present in the ADNI database. Table 1 summarizes the demographic characteristics of the participant groups, while table 2 summarizes the top candidate genes used in this study and their identification numbers, all of which have been proposed to play some role in AD.
|
|
2.3. Linear Regression (LR) Model
- Binary logistic regression analysis was performed under an additive model that included age and sex as covariates to test for associations between each SNP allele and LOAD risk. The data were divided according to age into groups in which each contains an approximately equal number of samples. All significant SNPs were then put into a stepwise multivariable regression model to evaluate the association of SNPs and LOAD susceptibility. All statistical analyses were performed using IBM SPSS version 24.0. The adjusted p value of ≤0.05 was defined as statistically significant.A prediction score was developed using any significant SNP from the previous multivariable regression. This score was used for receiver operator characteristics (ROC) curve analysis with the calculation of the highest Youden Index to calculate best cut-off values that differentiate between the three diagnoses and for the evaluation of this prediction by sensitivity, specificity, positive predictive value (PPV), negative predictive value (NPV) and accuracy.
2.4. Random Forests (RF) Model
- Twenty percent of the dataset was randomly selected and used as the training set, and consequently, the remaining 80% served as the learning set. An RF model is a collection of individual decision tree classifiers, where each tree in the forest has been trained using a bootstrap sample of subjects from the data, and each attribute in the tree is chosen from among a random subset of attributes. Individual trees are constructed as follows from data having N samples and M attributes:1. Choose a training set by selecting 20% of samples.2. At each node in the tree, m attributes are randomly selected from the entire set of M attributes in the data (the magnitude of m is constant throughout the forest building).3. Choose the best split at that node from among the m attributes.4. Iterate the second and third steps until the tree is fully grown [16].RF was performed using RapidMiner Studio software, version 8. The ReliefF algorithm was used for attribute selection.The RF model using regression resulted in a regression tree. This regression tree was used to calculate a prediction for diagnosis. ROC analysis with the calculation of the highest Youden Index was used to calculate best cut-off values for this prediction that differentiate between the three diagnoses.
2.5. Multifactor Dimensionality Reduction (MDR) Model
- MDR is a computational strategy for detecting and characterizing non-linear patterns of gene–gene interactions in genetic association studies. MDR was developed as a genetic model-free non-parametric machine learning strategy for identifying combinations of genetic and environmental factors that are predictive of a discrete clinical end point [22].MDR was performed using Multifactor Dimensionality Reduction Open Source software, version 3.0.2.
2.6. Implementation
- An I7 PC was used together with the following software:• PLINK used for QC and was downloaded from the following site: http://pngu.mgh.harvard.edu/purcell/plink/.• IBM SPSS version 24.0• RapidMiner Studio software, version 8 (RapidMiner, Inc. Boston, MA, USA), downloaded from https://rapidminer.com.• Multifactor Dimensionality Reduction Open Source software, version 3.0.2, produced by The Computational Genetics Laboratory at Dartmouth Medical School, Hanover, New Hampshire, USA The software is available for download at http://www.multifactordimensionalityreduction.org/.
3. Results
3.1. Linear Regression (LR) Model
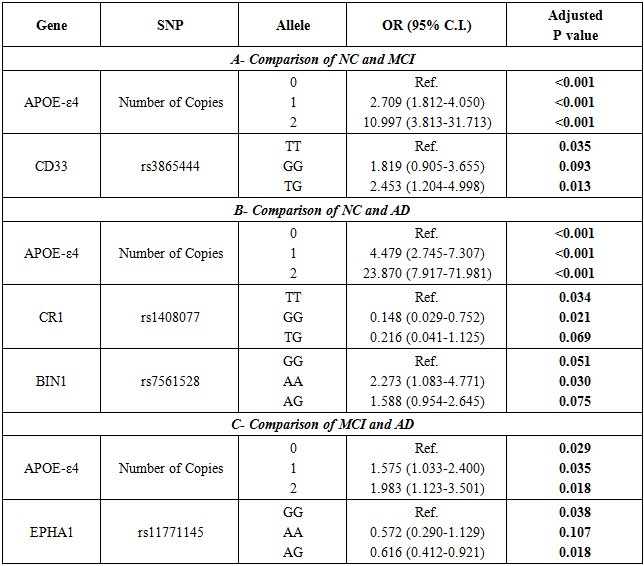
- The results of the multiple regression analysis are presented in table 3. The results indicate that the following SNPs are significant: APOE-ε4, CD33 (rs3865444), CR1 (rs1408077), BIN1 (rs7561528) and EPHA1 (rs11771145). The prediction score resulting from the stepwise LR model was calculated using the following equation:Score = 0.823 + (APOE-ε4*0.322) + (BIN1_ rs7561528-AA*0.143) + (EPHA1_ rs11771145-AG*0.013) – (CD33_ rs3865444-TG*0.032) – (CR1_ rs1408077-GG*0.105)
|
|
3.2. Random Forests (RF) Model
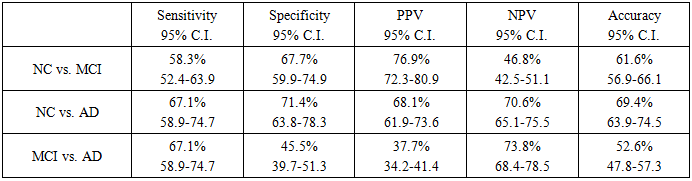
- A regression tree of significant predictor SNPs was constructed, and it contained the following SNPs: APOE-ε4, CR1 (rs3818361), PICALM (rs543293), EPHA1 (rs11767557), NM8 (rs2718058), PICALM (rs3851179) and CLU (rs11136000). The regression tree is presented in Fig. 1. The prediction score increased from the NC to the MCI and to the AD groups. ROC analysis was used to detect the best cut-off values to differentiate between the three diagnoses, and 0.856 was found to differentiate between NC and MCI, 0.866 to differentiate between NC and AD, and 0.864 to differentiate between MCI and AD. All were statistically significant. However, the results are highly significant for the differentiation of NC vs. MCI and NC vs. AD (p<0.001) and weakly significant (p=0.014) for the differentiation of MCI vs. AD.
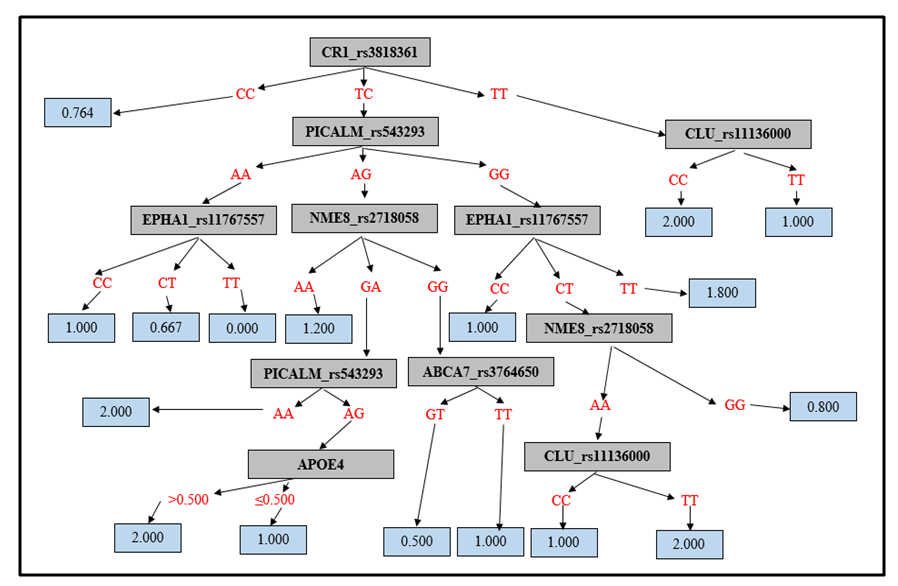 | Figure 1. Random Forests Model Regression Tree |
|
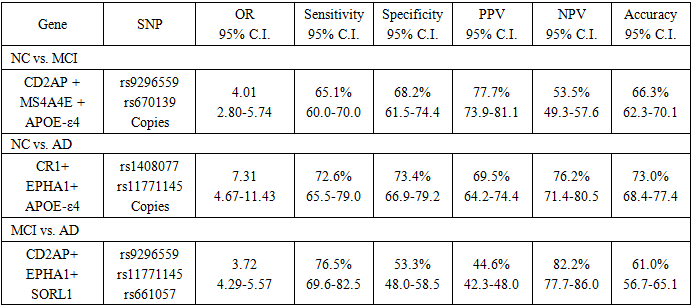
3.3. Multifactor Dimensionality Reduction (MDR) Model
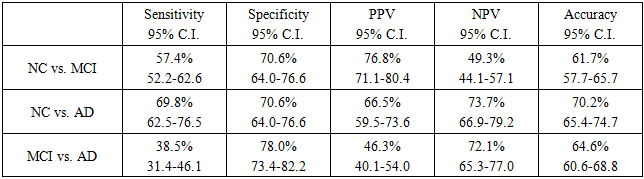
- MDR did not result in a prediction score (as in linear regression and RF). However, it resulted in model using (if --- then). Table 6 shows the prediction accuracy results, sensitivity, and specificity for the MDR model of the SNPs.
|
4. Disscusions
- Prediction is often a primary goal of genomic data analyses. The complexity and high dimensionality of genomic data require flexible and powerful statistical learning tools for effective statistical analysis [23].The LR model, together with other data mining and machine learning methods (RF and MDR), was tested for the same data, as suggested by Moore et al. (2010) [16].The results demonstrated the effectiveness of using RF and MDR for identifying AD causal SNPs with acceptable accuracy. The MDR model produced the best sensitivity in all three comparisons (NC vs. MCI, NC vs. AD and MCI vs. AD) using only 3 SNPs for its algorithm. Regarding specificity, LR resulted in the best specificity in two comparisons (NC vs. MCI and MCI vs. AD), while MDR produced the best specificity in the comparison of NC vs. AD. Accordingly, despite the smaller number of predictors in MDR, the classification performance achieved slightly better performance than other methods.Previous studies concentrated on the use of RF for the analysis of genetic data and found that it is an effective tool for such settings [23]. Wu et al. (2003) [24] compared RF with linear discriminant analysis (LDA), quadratic discriminant analysis (QDA), k-nearest neighbour (KNN) classifier, bagging and boosting classification trees, and support vector machine (SVM) for the separation of early stage ovarian cancer samples from normal tissue samples based on mass spectrometry data. RF performed better than other methods in terms of prediction error rate. Lee et al. (2005) [25] presented a comprehensive comparison of RF to LDA, QDA, logistic regression, partial least square (PLS), KNN, neural network, SVM, and other classification methods using seven microarray gene expression data sets. RF showed the best performance among all tree-based methods. These results suggest that RF is capable of accurate prediction. Carcia-Magarinos et al. (2009) [26] evaluated RF, classification and regression trees (CART), and logistic regression (LR) in 99 simulated scenarios involving different sample sizes, missing data, minor allele frequencies, and other factors. RF was more powerful in detecting true association. CART, RF, and LR yielded similar results in terms of detection of true association; however, CART and RF outperformed LR with regard to classification error. Molinaro et al. (2011) [27] compared RF with Monte Carlo logic regression and MDR in testing SNPs in pro-inflammatory and immuno regulatory genes and the risk of non-Hodgkin lymphoma. RF achieved the best power in these studies.Sherif et al. (2015) [28] used the ADNI-1 dataset to test for the ability of different Bayesian network structure learning algorithms to detect causal AD SNPs and gene-SNP interactions. They tested four types of classification algorithms: naïve Bayes (NB), tree augmented Bayes (TAB), Markov blanket (MB), and minimal augmented Markov blanket (MAMB). They demonstrated the effectiveness of using these algorithms for identifying AD causal SNPs with acceptable accuracy. The results indicated that the SNP set detected by MB-based methods has a strong association with AD and achieved better performance than other methods. Abd El Hamid et al. (2016) [29] used correlation-based feature selection (CFS) and chi-square feature selection to find the most important SNPs. The SVM classifier of different kernels has been used on ADNI-1. The results revealed that the SVM-trained model using RBF kernel had a relatively high association with AD and achieved an accuracy of 76.7%.The good results obtained by MDR models encouraged the development of modified MDR models such as K-Nearest Neighbours MDR (KNN-MDR) [30] and two-step unified model-based MDR (UM-MDR) [31]. However, the high false positive rates, as with the current results, are still a problem. One obvious reason for this finding is multiple testing: the large number of performed tests necessitates that the significance threshold be properly adapted, which is not always easy to do [30].
5. Conclusions
- The prediction of complex disease phenotypes from genotype data is an emerging research goal. SNPs and their association with AD can provide insights into the underlying mechanisms and identify SNPs that may serve as targets for therapeutic intervention. In conclusion, several significant SNPs associated with MCI and AD were identified in the APOE ε4, CD33, CR1, BIN1, EPHA1 PICALM, NM8, CLU, CD2AP and SORL1 genes.The current study showed that RF and MDR are alternatives to other existing methods for detecting genetic interactions, with important advantages. Among the advantages of their use is that they are able to detect interactions between SNPs. Moreover, these methods are non-parametric with no assumed prior distribution, unlike many parametric statistical methods. Nevertheless, parameters (distances, number of neighbours, window definition) are available to allow flexibility in the search strategies, which could help make these methods useful. Finally, using WGS data and the top related genes or adding other modalities, such as PET, MRI, or CSF markers, may improve the prediction accuracy.
Abbreviations
- AD: Alzheimer’s Disease; ADNI: Alzheimer’s Disease Neuroimaging Initiative; APOE: Apolipoprotein E; CART: Classification and Regression Trees; CSF: Cerebro-Spinal Fluid; EOAD: Early-Onset Alzheimer’s Disease; GWAS: Genome-Wide Association Studies; IBM: International Business Machines Corporation; KNN: K-Nearest Neighbor; KNN-MDR: K-Nearest Neighbors MDR; LDA: Linear Discriminant Analysis; LOAD: Late-Onset Alzheimer’s Disease; MAF: Minor Allele Frequency; MAMB: Minimal Augmented Markov Blanket; MB: Markov Blanket; MCI: Mild Cognitive Impairment; MDR: Multifactor Dimensionality Reduction; MRI: Magnetic Resonance Imaging; NB: Naïve Bayes; NC: Normal Controls; NPV: Negative Predictive Value; OR: Odds Ratio; PET: Positron Emission Tomography; PLS: Partial Least Square; PPV: Positive Predictive Value; QC: Quality Control; QDA: Quadratic Discriminant Analysis; RF: Random Forests; ROC: Receiver Operator Characteristics Curve; SNPs: Single Nucleotide Polymorphisms; SPSS: Statistical Package for the Social Sciences; SVM: Support Vector Machine; TAB: True Augmented Bayes; UM-MDR: Unified Model-based MDR; WGS: Whole Genome Sequencing.
ACKNOWLEDGEMENTS
- The data used in preparation of this manuscript were obtained from the ADNI database (adni.loni.usc.edu). As such, the investigators within the ADNI study contributed to the design and implementation of ADNI and/or provided data but did not participate in the analysis or writing of this paper.