-
Paper Information
- Paper Submission
-
Journal Information
- About This Journal
- Editorial Board
- Current Issue
- Archive
- Author Guidelines
- Contact Us
American Journal of Biomedical Engineering
p-ISSN: 2163-1050 e-ISSN: 2163-1077
2019; 9(1): 5-12
doi:10.5923/j.ajbe.20190901.02

Numerical Simulations of Inspiratory Airflow in Healthy and Asthmatic Human Airways
 Abstract
 Reference
 Full-Text PDF
 Full-text HTML
Endalew Getnet Tsega, V. K. Katiyar
Department of Mathematics, Indian Institute of Technology Roorkee, Roorkee, India
Correspondence to: Endalew Getnet Tsega, Department of Mathematics, Indian Institute of Technology Roorkee, Roorkee, India.
| Email: |  |
Copyright © 2019 The Author(s). Published by Scientific & Academic Publishing.
This work is licensed under the Creative Commons Attribution International License (CC BY).
http://creativecommons.org/licenses/by/4.0/

Asthma is a chronic lung disease that inflames and temporary narrows human airways with symptoms of shortness of breath, chest tightness, wheezing, and coughing. It occurs in people of all ages. The increasing atmospheric pollution, the changing lifestyle, increasing industrialization and urbanization have increased the prevalence of asthma several folds globally. In this study, the narrowing effects of asthma on inspiratory airflow dynamics in human upper and lower tracheobronchial airways for rest breathing conditions were investigated using computational fluid dynamics (CFD) techniques. Four airway models (healthy and asthmatic) were constructed for the numerical simulations. The inspiratory airflow velocity, wall pressure and wall shear stress were higher at the asthmatic airways than healthy airways. More significant difference of flow pattern between healthy and asthmatic airways was observed in upper generations than in lower generations. Strong secondary flow was observed in the upper generations for both healthy and asthmatic airways. The airway resistance was extremely higher in lower generation asthmatic airways. This study provides quantitative information on airflow dynamics during asthma attack which can be applied in asthma treatment.
Keywords: Healthy, Asthmatic, Airway model, Computational fluid dynamics (CFD), Numerical simulation, Airflow characteristics, Airway resistance
Cite this paper: Endalew Getnet Tsega, V. K. Katiyar, Numerical Simulations of Inspiratory Airflow in Healthy and Asthmatic Human Airways, American Journal of Biomedical Engineering, Vol. 9 No. 1, 2019, pp. 5-12. doi: 10.5923/j.ajbe.20190901.02.
Article Outline
1. Introduction
- According to estimates by the World Health Organization, 300 million people worldwide suffer from asthma, with 250, 000 people die per year from the disease. The prevalence and incidence of asthma have been increasing in many parts of the world (Nunes et al., 2017). Asthma narrows the breathing airways and obstructs the normal movement of air in and out of the lungs. Asthma changes the respiratory airflow dynamics (Sun et al., 2018; Choi et al., 2018). The narrowed airways result in a higher flow resistance (Eschenbacher, 2013). Asthma affects the larger and smaller airways of the lungs (Wiel et al., 2015, Carr et al. 2017). Many studies have been performed on airflow dynamics in normal and obstructed lung airways. Longest et al. (2006) investigated the effects of asthma induced airway constriction on aerosol dynamics and particle deposition in simplified bifurcating models of pediatric airways. Geometries considered include double bifurcation models of upper (G3–G5) and central (G7–G9) airways for a four-year-old child under healthy and 30% constricted conditions. Yang et al. (2006) studied the flow phenomenon in obstructed three-dimensional four-generation lung models (G5-G8) based on model of Weibel (1963) using CFD solver on unstructured tetrahedral meshes. Farkas and Balashazy (2007) simulated the effect of local obstructions and blockage on the deposition of aerosols in the lung airway subregion of G3–G5. OU et al. (2012) conducted finite-volume based computational fluid dynamics simulation of particle deposition in obstructive human airways (G3−G5). Sul et al. (2014) studied airflow characteristics in the lung between the 8th and the 14th generations using a three-dimensional computational fluid dynamics model and compared normal and obstructed airways for a range of breathing conditions. Chen et al. (2018) investigated airflow dynamics and particle deposition in healthy and asthmatic airways at different breathing conditions. Their study focused on airways consisting of only one bifurcation (G10-G11).Inthavong et al. (2010) investigated the effects of airway obstruction induced by asthma attack on particle deposition on realistic airway models from trachea up to six generations developed from CT scan. Jahani et al. (2017) investigated the regional ventilation characteristics healthy and asthmatic lung using a four-dimensional computed tomography image. Jahani (2016) developed realistic airway models for healthy and asthmatic subjects. He used CFD techniques to simulate airflow and pressure distribution in the airway models during normal breathing.The purpose of this study was to investigate the inspiratory airflow dynamics in asthmatic airways by comparing with that in healthy airways. We planned to look into airflow characteristics and flow resistance in both upper and lower airway generations (healthy and asthmatic) using computational fluid dynamics (CFD) techniques. We aimed to examine the effects asthma on the airflow dynamics by covering large subregions of the respiratory tract.
2. Methods
2.1. Airway Geometric Models and Mesh
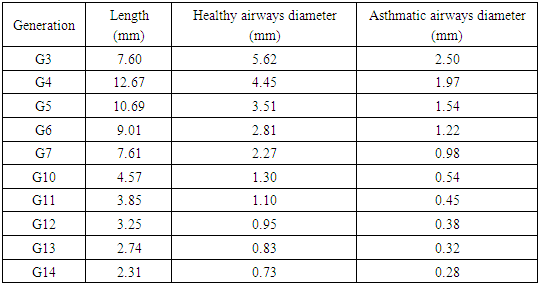
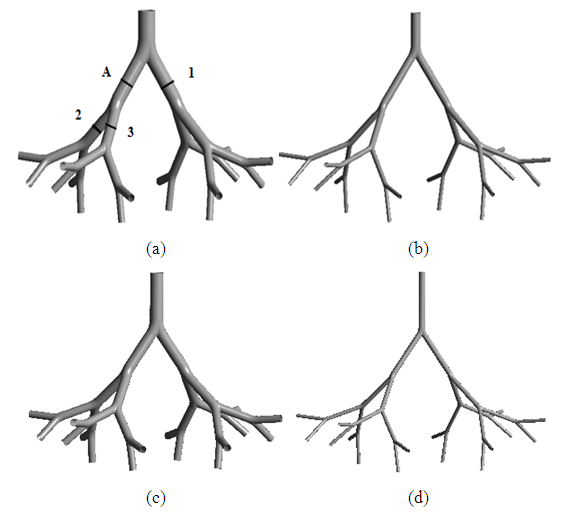
- Based on Weibel’s model, the lower respiratory tract can be divided into two zones: the conducting zone (tracheobronchial airways, G0–G16) and the respiratory zone (G17–G23). For this study, we selected two subregions of the tracheobronchial conducting airways G3–G7 and G10–G14. We constructed two 3D models for each subregion one for healthy airways and the other for asthmatic using SOLIDWORKS 2013 package 3D modeling software. Wiggs (1992) developed a model of airway narrowing in asthma. The result of this model was applied to construct the geometry of asthmatic airways, as depicted in Table 1. An off-planar symmetric airway bifurfications was used in the construction. To make smooth transition between parent and daughter airways, the bifurcation methodology used by Qu et al. (2017) was employed, as shown in Figure 1.
|
 | Figure 1. Schematics view of model of (a) healthy (b) asthmatic upper G3-G7 airways and (c) healthy (d) asthmatic lower G10-G14 airways |
2.2. Governing Equations and Boundary Conditions
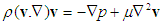
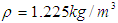
- Air within the human respiratory tract may be considered to be a homogeneous, Newtonian, and incompressible fluid. The Reynolds and Womersley numbers were calculated for flow in the airway models for each airway generations. The calculated values were small and enabled us to assume the flows to be laminar and steady. The governing continuity and momentum equations for the flow are given as:
 | (1) |
 | (2) |
 and
and 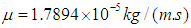 respectively.Airflow velocities were imposed at the inlets of G3 and G10 respectively corresponding to the flow rate 15L/min under rest breathing condition in adult human (Mutuku and Chen, 2018). Pressure outlet (zero relative pressure) was set at all outlets of G7 and G14; and no slip condition was imposed on the walls of the airways for all healthy and asthmatic airways models (Liu et al., 2003; Luo et al., 2008, Zhang et al., 2018). The airways were assumed to be rigid.
2.3. Numerical Methods
- The CFD software ANSYS Fluent 18.2 was used to solve the governing equations. The steady state pressure-based solver was used for the simulations. The coupling between velocity and pressure was solved by SIMPLE algorithm. Pressure value interpolation was second order and the connective terms of the governing equations were discretized with second order upwind scheme. Second order central difference scheme was used for the spatial discretization of diffusive terms. As the convergence criterion, a residual less than 10-6 was used for continuity and velocity equations in the computations. The computations were run on laptop PC with Intel Core i5 processor and 8GB RAM.
3. Validations
- The computational methodology we utilized was validated by the published numerical results of Nowak et al. (2003). We used similar off-plane airway bifurcation model as they used. Airflow simulation was performed in the model of upper healthy G3-G7 airways with equivalent inlet flow rate of 662.4 mL/s at the trachea and the same boundary conditions. The axial velocities were compared along a diameter in mid-plane circular cross-section of the fourth generation at A (Figure 1). The comparison is displayed in Figure 2 and shows that the simulation result is in good agreement with the previously published work. The discrepancies may be because of differences in branching angle and curvature radius used in the airway models.
 | Figure 2. Comparison of velocity profile at the middle circular cross-section of fourth generation |
4. Results and Discussion
- In this section, results of airflow simulations in the models of upper airways (G3-G7) and lower airways (G10-G14) for normal health and asthma conditions are discussed. To visualize the distributions of the airflow fields in the airways clearly, the values were scaled locally in the figures. The middle circular cross-sections of the airway generations at the indicated location 1, 2 and 3 on the airway model of upper healthy airways G3-G7 (see Figure 1a) were also taken for other airway models for discussion.
4.1. Airflow Velocity
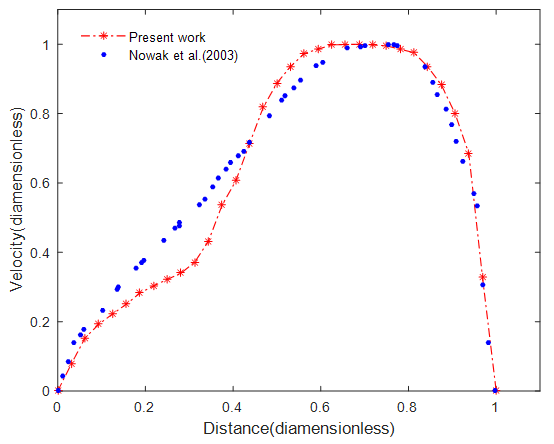
- Figure 3 shows the airflow velocity streamlines of the simulations in the four airway models. The velocity was higher in the asthmatic airways than in the healthy airways in both upper G3-G7 and lower G10-G14. In the upper airways G3-G7, the maximum velocities reached were 1.74 and 8.32m/s for healthy and asthmatic cases respectively. The corresponding maximum values in the lower airways G10-G14 were 0.36 and 2.05 m/s. In the simulations, greater difference of airflow pattern between normal health and asthma conditions was observed in the upper G3-G7 airways than in lower G10-G14 airways. The ratio of airflow velocity magnitude at a certain point in asthmatic airway to that of the corresponding point in healthy airway was higher in the lower (G10-G14) than in the upper (G3-G7). This indicates that asthma narrowing has more effect on lower airways than upper airways.
 | Figure 3. Airflow velocity streamlines in (a) healthy upper G3-G7 (b) asthmatic lower G3-G7 (c) healthy upper G10-G14 (d) asthmatic lower G10-G14 airways |
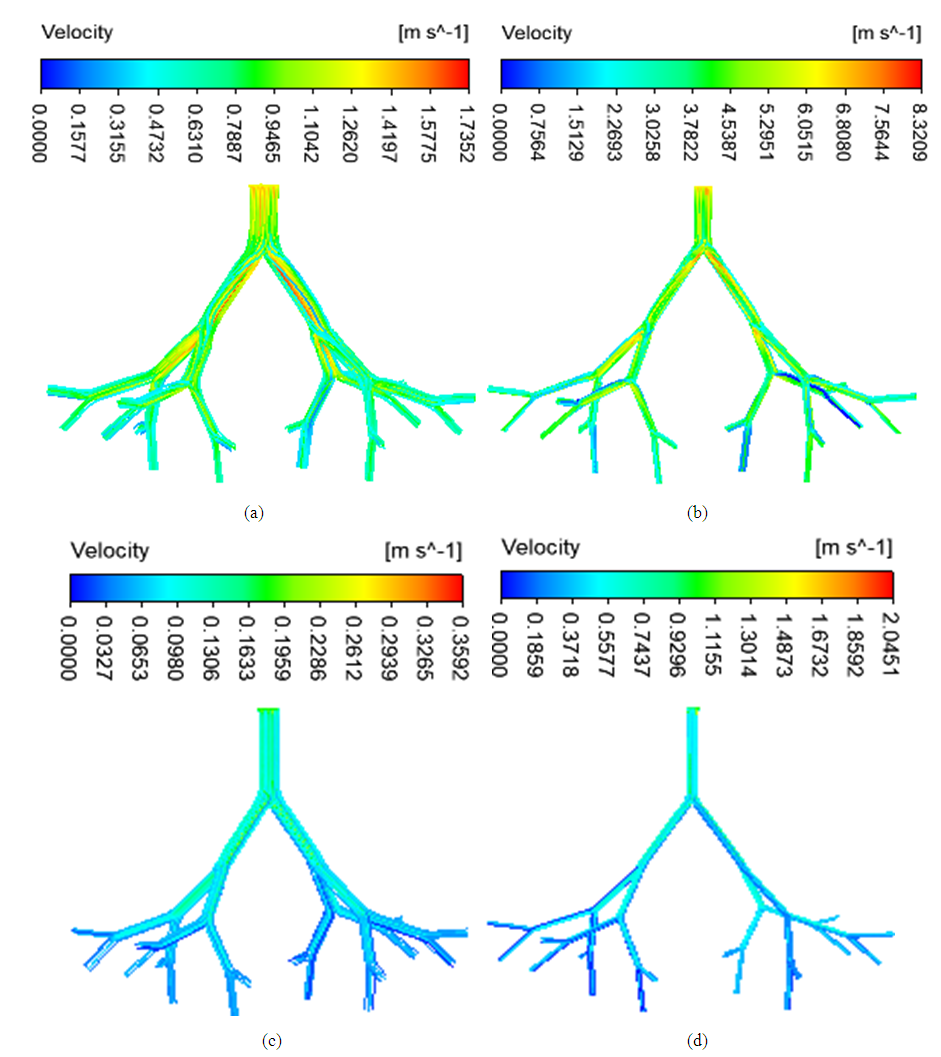
 | Figure 4. Axial velocity contours and secondary flow velocity vectors distributions on the middle circular cross-sections 1, 2 and 3 of (a) healthy upper G3-G7 airways (b) asthmatic upper G3-G7 airways (c) healthy lower G10-G14 airways and (d) asthmatic lower G10-G14 airways |
4.2. Wall Pressure and Wall Shear Stress
- The spatial distribution of wall pressure in the airways is depicted in Figure 5. The wall pressure was higher in asthmatic airways than healthy airways in both upper (G3-G7) and lower (G10-G14). The pressure drops were 3.92, 91.30, 1.54 and 43.45 Pa in the healthy upper G3-G7, asthmatic upper G3-G7, healthy lower G10-G14 and asthmatic lower G10-G14 airways, respectively. The wall pressure decreased down to the generations in all airway models.
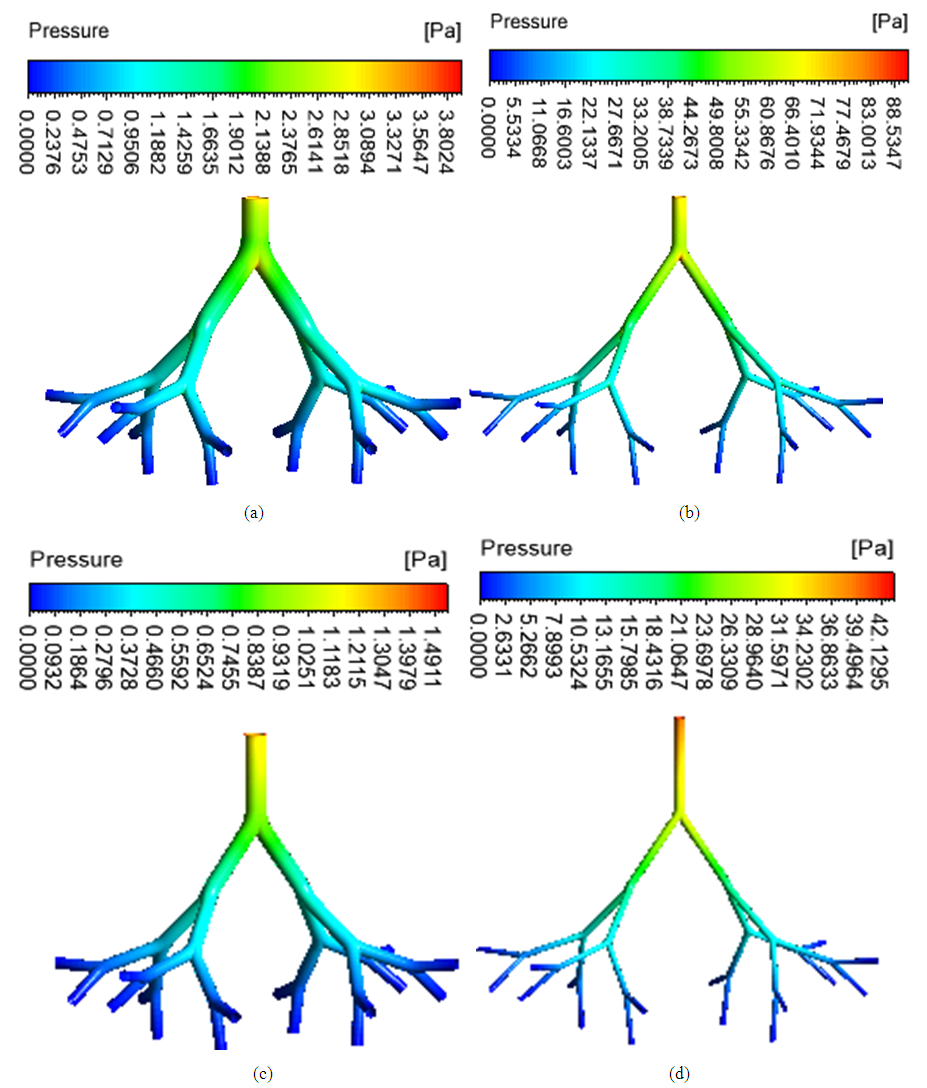 | Figure 5. Wall pressure distribution (a) healthy upper G3-G7 (b) asthmatic lower G3-G7 (c) healthy upper G10-G14 (d) asthmatic lower G10-G14 airways |
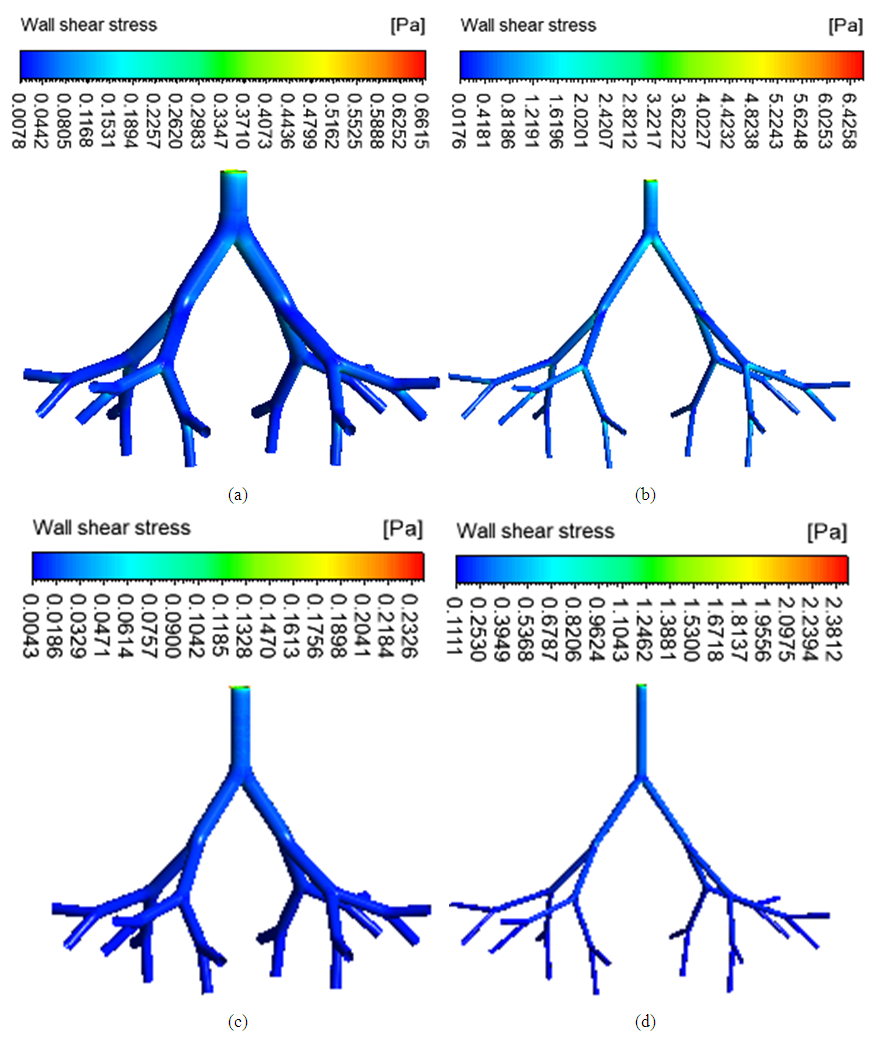 | Figure 6. Wall shear stress in (a) healthy upper G3-G7 (b) asthmatic lower G3-G7 (c) healthy upper G10-G14 (d) asthmatic lower G10-G14 airways |
4.3. Airways Resistance
- The flow resistance of a region of respiratory tract is defined as the ratio of the total pressure drop to the air volume flow rate (Qi et al., 2017). It indicates the opposition of the airways to airflow. The flow resistance of the healthy upper G3-G7, asthmatic upper G3-G7, healthy lower G10-G14 and asthmatic lower G10-G14 airways were 2.09, 48.69, 104.97 and 2965.91 Pa/(L/min) respectively. The flow resistance was higher in the asthmatic airways than in the healthy airways. The numerical simulations showed that during asthma attack, the flow resistance of lower airways was significantly higher than that of the upper airways.
5. Conclusions
- In this study, numerical simulations of inspiratory airflow dynamics were performed in upper and lower tracheobronchial airways for both normal health and asthma conditions in breathing at rest. The results showed that the airflow velocity, wall pressure and wall shear stress were higher in asthmatic airways than in healthy airways. The spatial distributions of such flow fields were shown for upper and lower airways. The airflow pattern difference between asthmatic and healthy airways was higher at the upper ways because of relatively big radii of airways and high velocity magnitude. Secondary flow was strong in upper ways for both normal health and asthma conditions because of the higher centrifugal force caused by the curvature of the airways and higher axial velocity. The resistance of asthmatic airways for airflow was higher than that of the healthy airways. This resistance was significantly higher in lower airways than in upper ways. This suggests that asthma medication should be given further attentions for small airways.